image

GPU Mining Colocation Market Size, Share & Segmentation By Service Type (Managed Colocation, Unmanaged Colocation, and Hybrid Colocation), Mining Type (Bitcoin Mining, Ethereum Mining, Altcoin Mining, and Others), End-User (Individual Miners, Mining Farms and Enterprises), Facility Size (Small, Medium, and Large), Power Capacity (Below 1 MW, 1–5 MW, and Above 5 MW), and Region | Global Forecast 2025-2032

Date: July 2025 Report Code: SNS/ICT/7984 Page 320

GPU Mining Colocation Market Report Scope & Overview:

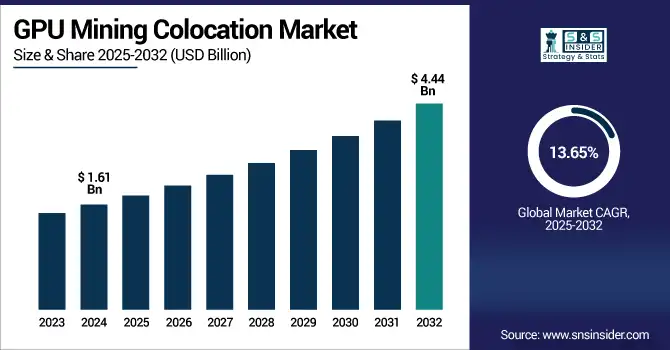
GPU Mining Colocation Market size was valued at USD 1.61 billion in 2024 and is expected to reach USD 4.44 billion by 2032, growing at a CAGR of 13.65% over 2025-2032. 

The GPU Mining Colocation Market growth is expanding rapidly due to rising demand for high-performance computing in cryptocurrency mining. Colocation provides scalable infrastructure, efficient cooling, and stable energy without significant capital investment, as mining becomes power-intensive. The increased number of retail investors willing to participate in crypto, coupled with a growing interest from institutional investors, are driving demand for professional setups. Energy-efficient GPU hardware innovations and a growing preference toward managed and hybrid colocation models to increase efficiencies and lower expenses are helping to accelerate market growth making colocation a more appealing option for miners.

  • Bit Digital, for example, had deployed 50,044 miners by June 30, 2024, with a total hash rate of 4.3 EH/s (2.6 EH/s active), powered by approximately 86% carbon-free energy.

  • The U.S. Department of Energy also emphasizes that server utilization boosts GPU/server efficiency by ~50% when usage increases from 20% to 30%, highlighting the cost-performance optimization achievable through advanced colocation strategies.

The U.S. GPU Mining Colocation Market size was valued at USD 0.44 billion in 2024 and is expected to reach USD 1.20 billion by 2032, growing at a CAGR of 13.41% from 2025-2032. 

The U.S. GPU Mining Colocation Market is growing due to rising crypto adoption, access to affordable renewable energy, and increasing demand for secure, scalable infrastructure. Institutional investments and advanced GPU technology further drive the shift toward professional colocation services.

Market Dynamics:

Drivers:

  • Rising Demand for Scalable, High-Density Infrastructure is Accelerating Adoption of GPU Mining Colocation Across Crypto and AI-Driven Workloads

The increase of GPU-intensive workloads such as crypto mining and generative AI has generated urgent demand for colocations that can scale near term. Many modern GPUs require high power density and high cooling thresholds ill-suited to legacy on-prem configurations. It is even more important for ensuring continuous mining, which is why these facilities have a robust physical infrastructure, 24/7 electricity supply, and backup cooling solutions. As such, it allows for miners to scale quickly at a lower cost of capital with greater operational efficiency. With an in-depth cost-benefit and performance advantages, the colocation segment is growing at a faster pace due to robust retail and institutional mining operations.

  • Hut 8’s Vega data center, a 162,000 ft² liquid-cooled facility powered by 205 MW, supports approximately 15 EH/s of compute representing nearly 2% of global Bitcoin hashpower.

  • Similarly, Bit Digital signed two GPU-cloud deals in Q1 2025 deploying 616 NVIDIA H200 GPUs, generating an estimated USD 20.9 million in annualized revenue under long-term contracts.

Restraints:

  • High Capital and Operational Expenditure in Colocation Setups Continue to Deter Small-Scale or Independent GPU Miners from Entry

Colocation delivers performance and efficiency, but high upfront and ongoing costs represent a major barrier to entry. Colocating GPU rigs will incur upfront costs for shipping, installation of hardware, monthly rental of rack space in a data center, and repair. This is compounded by rising crypto prices, which affect miner ROI. For small or solo miners, however, these economic factors often outweigh the benefits. Additionally in some colocation markets the absence of flexible pricing models or volume discounts limits their availability, forcing the ecosystem to be populated by well-capitalized actors.

  • For instance, Bit Digital’s accounts payable rose by USD 1.1 million in 2024, largely due to maintenance costs associated with mining, cloud, and colocation operations.

  • Base rate of USD 102 per kW per month with a 10-kW minimum, while even a small 1.4-kW Antminer S9 unit can cost around USD 143/month plus a USD 31.55 setup fee. Providers, such as AceHost and others often set minimum thresholds or long-term contracts, further excluding smaller operators from access to professional colocation services.

Opportunities

  • Increased Adoption of Blockchain Technologies Beyond Cryptocurrencies is Expanding the Use Case for GPU-Based Colocation Services

With the expansion of blockchain into finance, healthcare, logistics and entertainment, parallel processing power on GPU are in demand. GPU mining colocation centers started with a crypto-only focus but have since shifted to evolve into high-performance compute hubs for smart contracts, tokenization, and decentralized apps. This will allow providers to not only penetrate enterprise clients, but also generate revenue streams outside of the ever-changing crypto markets. In the meantime, this growing demand of scalable and efficient infrastructure in hybrid blockchain environments boosts the long-term need for co-located GPUs. Such diversification enables providers to leverage larger trends, such as digital transformation and enterprise-grade blockchain.

  • VanEck estimates that by redeploying just 20% of current bitcoin miner capacity for AI and HPC workloads, companies could unlock an estimated USD 37.6 billion in net present value by 2027.

  • Additionally, BCG projects that global data center power demand will grow approximately 16% annually from 2023 to 2028, driven primarily by enterprise and AI workloads indicating sustained infrastructure demand for compute-intensive blockchain applications.

Challenges

  • Hardware Obsolescence and Rapid Innovation Cycles Challenge Colocation ROI and Asset Lifecycle Planning for GPU Miners

The rapid pace of development in the GPU industry, as large improvements in performance happen every 12-18 months, makes colocating older hardware increasingly noncompetitive. Miners with older GPUs suffer from reduced efficiency and profitability, and long-term colocation contracts may not be conducive with fast hardware turnover. This discrepancy also creates ROI risk, which may result in expensive premature upgrades or renegotiations. Colocation providers put up or die. Without that flexibility, both miners and server vendors become stuck with stranded investments and at risk of falling behind the game when it comes to the dynamic GPU compute space.

Segmentation Analysis:

By Service Type

Managed Colocation led the GPU Mining Colocation Market share in 2024 with a 47%, due to its multi-faceted provision of services such as infrastructure, maintenance and security. This market share segment caters to the miners who want minimal operational disturbance and need to concentrate on mining, leaving the technical mechanics, uptime and power redundancy to the colocation provider for a steady performance in a high-stake crypto mining atmosphere.

Hybrid Colocation is expected to grow at a CAGR of 15.70% over 2025-2032 owing to the fact that it combines both self-managed and provider-managed resources. Providing miners with advanced configurations and operational control along with professional infrastructure support to achieve cost effectiveness and scalability while optimizing performance for complex or multi-coin mining projects

By Mining Type

Altcoin Mining held the dominant revenue share of 52% in 2024 as miners continued to diversify away from Bitcoin and toward other GPU-compatible altcoins. The altcoins mentioned above present much lower entry barriers, a higher transaction throughput and algorithmic convenience of GPU rigs which is why they are very appealing to both inexperienced and experienced miners wanting to optimize profits in a volatile crypto climate.

Ethereum Mining is projected to grow at the fastest CAGR of 17.33% over 2025-2032 due to Ethereum forks and Layer-2 projects not utilizing the proof-of-stake consensus yet continuing to use a GPU-compatible proof-of-work algorithms. The growth of decentralized applications and the recovery of an Ethereum network keep the demand for Ethereum-oriented mining, especially in GPU-friendly colocation centers.

By End-User

Mining Farms dominated the market with a 53% revenue share in 2024 owing to their extensive scales, optimized supply of GPUs, and financial backing. They capitalize on economies of scale and resource access to less expensive power sources to provide better efficiency and more uptime, making colocation a cheaper means for creating a space where they can maximize output while minimizing overhead.

Enterprises are expected to grow at the fastest CAGR of 15.29% over 2025-2032 as more enterprises begin to experiment with blockchain infrastructure and decentralized compute strategies. As institutional interest in digital assets and Web3 infrastructure intensifies, enterprises need a dependable, secure, and scalable GPU colocation to host internal blockchain nodes, smart contract platforms, and private mining farms.

By Facility Size

The Medium segment led with a 46% revenue share in 2024, driven by mid-size mining operations seeking a balance between cost and compute capacity. These setups are large enough to benefit from colocation efficiencies but small enough to remain agile in shifting market conditions. They represent the backbone of the sector, with stable investment and consistent mining throughput.

Large segment is anticipated to grow at a CAGR of 15.03% over 2025-2032 due to the rising installations of this ultra-large setup for GPU farms and AI focused colocation centers. Colocation providers have begun to ramp up high-density power and cooling in many of their large-scale data centers, which are well suited for these types of setups. This segment is also supported by partnerships with industry players and government initiatives for large-scale compute centers.

By Power Capacity

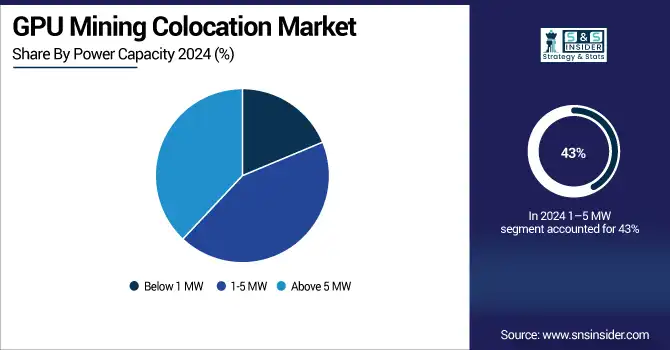
The 1–5 MW segment dominated in 2024 with a 43% revenue share, due to its compatibility with the majority of mid-to-large mining needs. This power range strikes a balance between the scalability required for decentralized mining farms and dedicated blockchain infrastructure projects and the cost that does not raise unnecessary regulatory attention or the permitting challenges associated with larger installations.

Above 5 MW segment is projected to grow at a CAGR of 14.83% during 2025-2032 due to increasing deployment of ultra-large GPU farms and AI-focused colocation centers. These setups require high-density power and cooling, which large-scale colocation facilities are increasingly equipped to provide. Strategic partnerships and government support for industrial-scale compute centers also support this segment’s expansion.

Regional Analysis

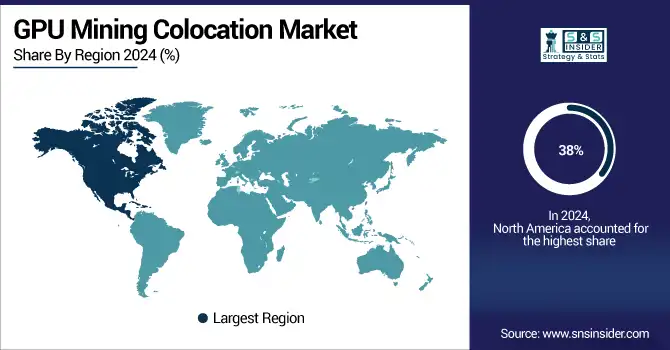
North America dominated the GPU Mining Colocation Market in 2024 with a 38% revenue share, owing to the abundance of renewable energy at low costs, well-developed digital infrastructure and, a clear regulatory framework across major countries such as the U.S. and Canada. North America is also led in high-performance, energy-efficient, GPU mining operations, thanks to a burgeoning number of established colocation providers and institutional miners.

The U.S. is dominating the GPU Mining Colocation Market due to its abundant renewable energy, strong infrastructure, and favorable regulatory environment.

Asia Pacific is projected to grow at the fastest CAGR of 15.41% during 2025-2032, owing to the rising investments in digital assets in the region, and the growing data center capacity in countries, such as Kazakhstan, Malaysia, and India, where electricity costs are also comparatively low. Growing government interest in blockchain and AI use cases contributes to demand for scalable GPU infrastructure across the fast-digitalizing economies in the region.

China is dominating the GPU Mining Colocation Market in Asia Pacific due to its large-scale mining infrastructure, affordable electricity, and established hardware supply chains.

Europe holds a strong position in the GPU Mining Colocation Market owing to its digital infrastructure, increasing energy-efficient mining of GPUs, and demand for Blockchain technologies across a wide range of sectors under supportive regulation and sustainability.

Germany is dominating the GPU Mining Colocation Market in Europe due to its advanced data center ecosystem, reliable power grid, and strong industrial mining presence.

GPU mining colocation market trends indicate strong growth in Latin America and the Middle East & Africa, fueled by low-cost energy, enhanced digital infrastructure, and rising interest in crypto mining as a driver of economic and technological advancement.

Key Players:

GPU mining colocation market companies are CoreWeave, ZoomHash, MegaVolt Mining, Infinity Data Center / Webservio, AceHost, Whitelabel IT Solutions, Coolhousing, Colocation America, Core Scientific, Hut 8 Mining, Hive Digital Technologies, Bit Digital, Iris Energy, HostRunway, ColocationPLUS, CloudKleyer, Veloxty, Bit Capital Group (BitCap), TensorDock, OneMiners, and others.

Recent Developments:

  • 2025: CoreWeave became the first hyperscaler to deploy NVIDIA GB300 NVL72 GPUs globally, collaborating with Dell, Switch, and Vertiv. The deployment earned a Platinum GPU Cloud ClusterMAX rating for advanced AI infrastructure performance.

  • 2024: CoreWeave partnered with MERLIN Edged to launch an innovative, zero‑water AI data center in Barcelona. This sustainable facility supports large-scale GPU workloads while enhancing Europe's AI infrastructure with eco-efficient cooling technologies.

GPU Mining Colocation Market Report Scope:

Report Attributes Details
Market Size in 2024 USD 1.61 Billion 
Market Size by 2032 USD 4.44 Billion 
CAGR CAGR of 13.65% From 2025 to 2032
Base Year 2024
Forecast Period 2025-2032
Historical Data 2021-2023
Report Scope & Coverage Market Size, Segments Analysis, Competitive Landscape, Regional Analysis, DROC & SWOT Analysis, Forecast Outlook
Key Segments • By Service Type (Managed Colocation, Unmanaged Colocation, Hybrid Colocation)
• By Mining Type (Bitcoin Mining, Ethereum Mining, Altcoin Mining, Others)
• By End-User (Individual Miners, Mining Farms, Enterprises)
• By Facility Size (Small, Medium, Large)
• By Power Capacity (Below 1 MW, 1–5 MW, Above 5 MW)
Regional Analysis/Coverage North America (US, Canada), Europe (Germany, UK, France, Italy, Spain, Russia, Poland, Rest of Europe), Asia Pacific (China, India, Japan, South Korea, Australia, ASEAN Countries, Rest of Asia Pacific), Middle East & Africa (UAE, Saudi Arabia, Qatar, South Africa, Rest of Middle East & Africa), Latin America (Brazil, Argentina, Mexico, Colombia, Rest of Latin America).
Company Profiles CoreWeave, ZoomHash, MegaVolt Mining, Infinity Data Center / Webservio, AceHost, Whitelabel IT Solutions, Coolhousing, Colocation America, Core Scientific, Hut 8 Mining, Hive Digital Technologies, Bit Digital, Iris Energy, HostRunway, ColocationPLUS, CloudKleyer, Veloxty, Bit Capital Group (BitCap), TensorDock, OneMiners

Frequently Asked Questions

Ans: The GPU Mining Colocation Market is expected to grow at a CAGR of 13.65% from 2025 to 2032 due to rising computing demand.

Ans: The GPU Mining Colocation Market was valued at USD 1.61 billion in 2024, driven by increasing demand for scalable and efficient infrastructure.

Ans: The key growth factor is rising demand for high-performance computing power needed for crypto mining and AI-driven workloads globally.

Ans: The Managed Colocation segment dominated in 2024 with a 47% revenue share due to full-service infrastructure and operational efficiency.

Ans: North America dominated in 2024 with a 38% revenue share due to advanced infrastructure and access to renewable energy sources.

Table Of Contents

1. Introduction

1.1 Market Definition & Scope

 1.2 Research Assumptions & Abbreviations

 1.3 Research Methodology

2. Executive Summary

2.1 Market Snapshot

 2.2 Market Absolute $ Opportunity Assessment & Y-o-Y Analysis, 2021–2032

 2.3 Market Size & Forecast, By Segmentation, 2021–2032

  2.3.1 Market Size By Service Type

  2.3.2 Market Size By Mining Type

  2.3.3 Market Size By End-User

  2.3.4 Market Size By Facility Size

  2.3.5 Market Size By Power Capacity

 2.4 Market Share & Bps Analysis By Region, 2024

 2.5 Industry Growth Scenarios – Conservative, Likely & Optimistic

 2.6 Industry CxO’s Perspective

3. Market Overview

3.1 Market Dynamics

  3.1.1 Drivers

  3.1.2 Restraints

  3.1.3 Opportunities

  3.1.4 Key Market Trends

 3.2 Industry PESTLE Analysis

 3.3 Key Industry Forces (Porter’s) Impacting Market Growth

 3.4 Industry Supply Chain Analysis

  3.4.1 Raw Material Suppliers

  3.4.2 Manufacturers

  3.4.3 Distributors/Suppliers

  3.4.4 Customers/End-Users

 3.5 Industry Life Cycle Assessment

 3.6 Parent Market Overview

 3.7 Market Risk Assessment

4. Statistical Insights & Trends Reporting

4.1 Infrastructure & Deployment Metrics

4.1.1 Number of GPU Mining Facilities by Region
4.1.2 Average Facility Capacity (MW / Number of GPUs)
4.1.3 Occupancy Rate (%) of Colocation Capacity
4.1.4 Client Mix by Segment (Enterprise, SMB, Individual Miners)
4.1.5 Growth Rate of New Facility Openings (YoY %)

4.2 Technical & Performance Metrics

4.2.1 Average Hashrate per Facility (TH/s or PH/s)
4.2.2 GPU Power Utilization Efficiency (GH/W)
4.2.3 Average Uptime & Availability (%)
4.2.4 Cooling Efficiency (Power Usage Effectiveness, PUE)
4.2.5 Average Maintenance or Downtime Incidents per Month

4.3 Cost & Economics Metrics

4.3.1 Average Colocation Cost per GPU per Month (USD)
4.3.2 Electricity Cost per kWh (USD) by Geography
4.3.3 ROI Timeline for Colocation Clients (Months or Years)
4.3.4 Average Operating Cost per Hashrate Unit (USD per TH/s)
4.3.5 Added Fees (Networking, Cooling, Maintenance) as % of Total Cost

4.5 Energy & Sustainability Metrics

4.5.1 % Facilities Powered by Renewable Energy Sources
4.5.2 Total CO₂ Emissions per PH/s, by Facility Type
4.5.3 Average Energy Efficiency Score per Facility (kWh/Parked GPU)
4.5.4 Carbon Offset or Sustainability Investment per Colocation Provider
4.5.5 Average Water Usage Efficiency (Liters per MWh) in Cooling

4.6 Compliance, Security & Risk Metrics

4.6.1 % Facilities Compliant with Local Regulatory Standards (e.g., Energy, Crypto licensing)
4.6.2 Average Time to Regulatory Approval per Location (Months)
4.6.3 Incidents of Theft or Unauthorized Access per Year (Count)
4.6.4 Insurance Coverage Penetration (%) Across Facilities
4.6.5 Implemented Cybersecurity Protocols (MFA, network segmentation %)

5. GPU Mining Colocation Market Segmental Analysis & Forecast, By Service Type, 2021 – 2032, Value (USD Billion) & Volume (Rack Units (U))

5.1 Introduction

 5.2 Managed Colocation

  5.2.1 Key Trends

  5.2.2 Market Size & Forecast, 2021 – 2032

 5.3 Unmanaged Colocation

  5.3.1 Key Trends

  5.3.2 Market Size & Forecast, 2021 – 2032

 5.4 Hybrid Colocation

  5.4.1 Key Trends

  5.4.2 Market Size & Forecast, 2021 – 2032

6. GPU Mining Colocation Market Segmental Analysis & Forecast, By Mining Type, 2021 – 2032, Value (USD Billion) & Volume (Rack Units (U))

    6.1 Introduction

 6.2 Bitcoin Mining

  6.2.1 Key Trends

  6.2.2 Market Size & Forecast, 2021 – 2032

 6.3 Ethereum Mining

  6.3.1 Key Trends

  6.3.2 Market Size & Forecast, 2021 – 2032

 6.4 Altcoin Mining

  6.4.1 Key Trends

  6.4.2 Market Size & Forecast, 2021 – 2032

 6.5 Others

  6.5.1 Key Trends

  6.5.2 Market Size & Forecast, 2021 – 2032

7. GPU Mining Colocation Market Segmental Analysis & Forecast, By End-User, 2021 – 2032, Value (USD Billion) & Volume (Rack Units (U))

    7.1 Introduction

 7.2 Individual Miners

  7.2.1 Key Trends

  7.2.2 Market Size & Forecast, 2021 – 2032

 7.3 Mining Farms

  7.3.1 Key Trends

  7.3.2 Market Size & Forecast, 2021 – 2032

 7.4 Enterprises

  7.4.1 Key Trends

  7.4.2 Market Size & Forecast, 2021 – 2032

8. GPU Mining Colocation Market Segmental Analysis & Forecast, By Facility Size, 2021 – 2032, Value (USD Billion) & Volume (Rack Units (U))

    8.1 Introduction

 8.2 Small

  8.2.1 Key Trends

  8.2.2 Market Size & Forecast, 2021 – 2032

 8.3 Medium

  8.3.1 Key Trends

  8.3.2 Market Size & Forecast, 2021 – 2032

 8.4 Large

  8.4.1 Key Trends

  8.4.2 Market Size & Forecast, 2021 – 2032

9. GPU Mining Colocation Market Segmental Analysis & Forecast, By Power Capacity, 2021 – 2032, Value (USD Billion) & Volume (Rack Units (U))

    9.1 Introduction 

  9.2 Below 1 MW

   9.2.1 Key Trends 

   9.2.2 Market Size & Forecast, 2021 – 2032 

  9.3 1-5 MW

   9.3.1 Key Trends 

   9.3.2 Market Size & Forecast, 2021 – 2032 

  9.4 Above 5 MW

   9.4.1 Key Trends 

   9.4.2 Market Size & Forecast, 2021 – 2032 

10. GPU Mining Colocation Market Segmental Analysis & Forecast By Region, 2021 – 2032, Value (USD Billion) & Volume (Rack Units (U))

 10.1 Introduction

 10.2 North America

  10.2.1 Key Trends

  10.2.2 GPU Mining Colocation Market Size & Forecast, By Service Type, 2021 – 2032

  10.2.3 GPU Mining Colocation Market Size & Forecast, By Mining Type, 2021 – 2032

  10.2.4 GPU Mining Colocation Market Size & Forecast, By End-User, 2021 – 2032

  10.2.5 GPU Mining Colocation Market Size & Forecast, By Facility Size, 2021 – 2032

  10.2.6 GPU Mining Colocation Market Size & Forecast, By Power Capacity, 2021 – 2032

  10.2.7 GPU Mining Colocation Market Size & Forecast, By Country, 2021 – 2032

   10.2.7.1 USA

    10.2.7.1.1 GPU Mining Colocation Market Size & Forecast, By Service Type, 2021 – 2032

    10.2.7.1.2 GPU Mining Colocation Market Size & Forecast, By Mining Type, 2021 – 2032

    10.2.7.1.3 GPU Mining Colocation Market Size & Forecast, By End-User, 2021 – 2032

    10.2.7.1.4 GPU Mining Colocation Market Size & Forecast, By Facility Size, 2021 – 2032

    10.2.7.1.5 GPU Mining Colocation Market Size & Forecast, By Power Capacity, 2021 – 2032

   10.2.7.2 Canada

    10.2.7.2.1 GPU Mining Colocation Market Size & Forecast, By Service Type, 2021 – 2032

    10.2.7.2.2 GPU Mining Colocation Market Size & Forecast, By Mining Type, 2021 – 2032

    10.2.7.2.3 GPU Mining Colocation Market Size & Forecast, By End-User, 2021 – 2032

    10.2.7.2.4 GPU Mining Colocation Market Size & Forecast, By Facility Size, 2021 – 2032

    10.2.7.2.5 GPU Mining Colocation Market Size & Forecast, By Power Capacity, 2021 – 2032

10.3 Europe

 10.3.1 Key Trends

 10.3.2 GPU Mining Colocation Market Size & Forecast, By Service Type, 2021 – 2032

 10.3.3 GPU Mining Colocation Market Size & Forecast, By Mining Type, 2021 – 2032

 10.3.4 GPU Mining Colocation Market Size & Forecast, By End-User, 2021 – 2032

 10.3.5 GPU Mining Colocation Market Size & Forecast, By Facility Size, 2021 – 2032

 10.3.6 GPU Mining Colocation Market Size & Forecast, By Power Capacity, 2021 – 2032

 10.3.7 GPU Mining Colocation Market Size & Forecast, By Country, 2021 – 2032

  10.3.7.1 Germany

   10.3.7.1.1 GPU Mining Colocation Market Size & Forecast, By Service Type, 2021 – 2032

   10.3.7.1.2 GPU Mining Colocation Market Size & Forecast, By Mining Type, 2021 – 2032

   10.3.7.1.3 GPU Mining Colocation Market Size & Forecast, By End-User, 2021 – 2032

   10.3.7.1.4 GPU Mining Colocation Market Size & Forecast, By Facility Size, 2021 – 2032

   10.3.7.1.5 GPU Mining Colocation Market Size & Forecast, By Power Capacity, 2021 – 2032

  10.3.7.2 UK

   10.3.7.2.1 GPU Mining Colocation Market Size & Forecast, By Service Type, 2021 – 2032

   10.3.7.2.2 GPU Mining Colocation Market Size & Forecast, By Mining Type, 2021 – 2032

   10.3.7.2.3 GPU Mining Colocation Market Size & Forecast, By End-User, 2021 – 2032

   10.3.7.2.4 GPU Mining Colocation Market Size & Forecast, By Facility Size, 2021 – 2032

   10.3.7.2.5 GPU Mining Colocation Market Size & Forecast, By Power Capacity, 2021 – 2032

  10.3.7.3 France

   10.3.7.3.1 GPU Mining Colocation Market Size & Forecast, By Service Type, 2021 – 2032

   10.3.7.3.2 GPU Mining Colocation Market Size & Forecast, By Mining Type, 2021 – 2032

   10.3.7.3.3 GPU Mining Colocation Market Size & Forecast, By End-User, 2021 – 2032

   10.3.7.3.4 GPU Mining Colocation Market Size & Forecast, By Facility Size, 2021 – 2032

   10.3.7.3.5 GPU Mining Colocation Market Size & Forecast, By Power Capacity, 2021 – 2032

  10.3.7.4 Italy

   10.3.7.4.1 GPU Mining Colocation Market Size & Forecast, By Service Type, 2021 – 2032

   10.3.7.4.2 GPU Mining Colocation Market Size & Forecast, By Mining Type, 2021 – 2032

   10.3.7.4.3 GPU Mining Colocation Market Size & Forecast, By End-User, 2021 – 2032

   10.3.7.4.4 GPU Mining Colocation Market Size & Forecast, By Facility Size, 2021 – 2032

   10.3.7.4.5 GPU Mining Colocation Market Size & Forecast, By Power Capacity, 2021 – 2032

  10.3.7.5 Spain

   10.3.7.5.1 GPU Mining Colocation Market Size & Forecast, By Service Type, 2021 – 2032

   10.3.7.5.2 GPU Mining Colocation Market Size & Forecast, By Mining Type, 2021 – 2032

   10.3.7.5.3 GPU Mining Colocation Market Size & Forecast, By End-User, 2021 – 2032

   10.3.7.5.4 GPU Mining Colocation Market Size & Forecast, By Facility Size, 2021 – 2032

   10.3.7.5.5 GPU Mining Colocation Market Size & Forecast, By Power Capacity, 2021 – 2032

  10.3.7.6 Russia

   10.3.7.6.1 GPU Mining Colocation Market Size & Forecast, By Service Type, 2021 – 2032

   10.3.7.6.2 GPU Mining Colocation Market Size & Forecast, By Mining Type, 2021 – 2032

   10.3.7.6.3 GPU Mining Colocation Market Size & Forecast, By End-User, 2021 – 2032

   10.3.7.6.4 GPU Mining Colocation Market Size & Forecast, By Facility Size, 2021 – 2032

   10.3.7.6.5 GPU Mining Colocation Market Size & Forecast, By Power Capacity, 2021 – 2032

  10.3.7.7 Poland

   10.3.7.7.1 GPU Mining Colocation Market Size & Forecast, By Service Type, 2021 – 2032

   10.3.7.7.2 GPU Mining Colocation Market Size & Forecast, By Mining Type, 2021 – 2032

   10.3.7.7.3 GPU Mining Colocation Market Size & Forecast, By End-User, 2021 – 2032

   10.3.7.7.4 GPU Mining Colocation Market Size & Forecast, By Facility Size, 2021 – 2032

   10.3.7.7.5 GPU Mining Colocation Market Size & Forecast, By Power Capacity, 2021 – 2032

  10.3.7.8 Rest of Europe

   10.3.7.8.1 GPU Mining Colocation Market Size & Forecast, By Service Type, 2021 – 2032

   10.3.7.8.2 GPU Mining Colocation Market Size & Forecast, By Mining Type, 2021 – 2032

   10.3.7.8.3 GPU Mining Colocation Market Size & Forecast, By End-User, 2021 – 2032

   10.3.7.8.4 GPU Mining Colocation Market Size & Forecast, By Facility Size, 2021 – 2032

   10.3.7.8.5 GPU Mining Colocation Market Size & Forecast, By Power Capacity, 2021 – 2032

10.4 Asia-Pacific

 10.4.1 Key Trends

 10.4.2 GPU Mining Colocation Market Size & Forecast, By Service Type, 2021 – 2032

 10.4.3 GPU Mining Colocation Market Size & Forecast, By Mining Type, 2021 – 2032

 10.4.4 GPU Mining Colocation Market Size & Forecast, By End-User, 2021 – 2032

 10.4.5 GPU Mining Colocation Market Size & Forecast, By Facility Size, 2021 – 2032

 10.4.6 GPU Mining Colocation Market Size & Forecast, By Power Capacity, 2021 – 2032

 10.4.7 GPU Mining Colocation Market Size & Forecast, By Country, 2021 – 2032

  10.4.7.1 China

   10.4.7.1.1 GPU Mining Colocation Market Size & Forecast, By Service Type, 2021 – 2032

   10.4.7.1.2 GPU Mining Colocation Market Size & Forecast, By Mining Type, 2021 – 2032

   10.4.7.1.3 GPU Mining Colocation Market Size & Forecast, By End-User, 2021 – 2032

   10.4.7.1.4 GPU Mining Colocation Market Size & Forecast, By Facility Size, 2021 – 2032

   10.4.7.1.5 GPU Mining Colocation Market Size & Forecast, By Power Capacity, 2021 – 2032

  10.4.7.2 India

   10.4.7.2.1 GPU Mining Colocation Market Size & Forecast, By Service Type, 2021 – 2032

   10.4.7.2.2 GPU Mining Colocation Market Size & Forecast, By Mining Type, 2021 – 2032

   10.4.7.2.3 GPU Mining Colocation Market Size & Forecast, By End-User, 2021 – 2032

   10.4.7.2.4 GPU Mining Colocation Market Size & Forecast, By Facility Size, 2021 – 2032

   10.4.7.2.5 GPU Mining Colocation Market Size & Forecast, By Power Capacity, 2021 – 2032

  10.4.7.3 Japan

   10.4.7.3.1 GPU Mining Colocation Market Size & Forecast, By Service Type, 2021 – 2032

   10.4.7.3.2 GPU Mining Colocation Market Size & Forecast, By Mining Type, 2021 – 2032

   10.4.7.3.3 GPU Mining Colocation Market Size & Forecast, By End-User, 2021 – 2032

   10.4.7.3.4 GPU Mining Colocation Market Size & Forecast, By Facility Size, 2021 – 2032

   10.4.7.3.5 GPU Mining Colocation Market Size & Forecast, By Power Capacity, 2021 – 2032

  10.4.7.4 South Korea

   10.4.7.4.1 GPU Mining Colocation Market Size & Forecast, By Service Type, 2021 – 2032

   10.4.7.4.2 GPU Mining Colocation Market Size & Forecast, By Mining Type, 2021 – 2032

   10.4.7.4.3 GPU Mining Colocation Market Size & Forecast, By End-User, 2021 – 2032

   10.4.7.4.4 GPU Mining Colocation Market Size & Forecast, By Facility Size, 2021 – 2032

   10.4.7.4.5 GPU Mining Colocation Market Size & Forecast, By Power Capacity, 2021 – 2032

  10.4.7.5 Australia

   10.4.7.5.1 GPU Mining Colocation Market Size & Forecast, By Service Type, 2021 – 2032

   10.4.7.5.2 GPU Mining Colocation Market Size & Forecast, By Mining Type, 2021 – 2032

   10.4.7.5.3 GPU Mining Colocation Market Size & Forecast, By End-User, 2021 – 2032

   10.4.7.5.4 GPU Mining Colocation Market Size & Forecast, By Facility Size, 2021 – 2032

   10.4.7.5.5 GPU Mining Colocation Market Size & Forecast, By Power Capacity, 2021 – 2032

  10.4.7.6 ASEAN Countries

   10.4.7.6.1 GPU Mining Colocation Market Size & Forecast, By Service Type, 2021 – 2032

   10.4.7.6.2 GPU Mining Colocation Market Size & Forecast, By Mining Type, 2021 – 2032

   10.4.7.6.3 GPU Mining Colocation Market Size & Forecast, By End-User, 2021 – 2032

   10.4.7.6.4 GPU Mining Colocation Market Size & Forecast, By Facility Size, 2021 – 2032

   10.4.7.6.5 GPU Mining Colocation Market Size & Forecast, By Power Capacity, 2021 – 2032

  10.4.7.7 Rest of Asia-Pacific

   10.4.7.7.1 GPU Mining Colocation Market Size & Forecast, By Service Type, 2021 – 2032

   10.4.7.7.2 GPU Mining Colocation Market Size & Forecast, By Mining Type, 2021 – 2032

   10.4.7.7.3 GPU Mining Colocation Market Size & Forecast, By End-User, 2021 – 2032

   10.4.7.7.4 GPU Mining Colocation Market Size & Forecast, By Facility Size, 2021 – 2032

   10.4.7.7.5 GPU Mining Colocation Market Size & Forecast, By Power Capacity, 2021 – 2032

10.5 Latin America

 10.5.1 Key Trends

 10.5.2 GPU Mining Colocation Market Size & Forecast, By Service Type, 2021 – 2032

 10.5.3 GPU Mining Colocation Market Size & Forecast, By Mining Type, 2021 – 2032

 10.5.4 GPU Mining Colocation Market Size & Forecast, By End-User, 2021 – 2032

 10.5.5 GPU Mining Colocation Market Size & Forecast, By Facility Size, 2021 – 2032

 10.5.6 GPU Mining Colocation Market Size & Forecast, By Power Capacity, 2021 – 2032

 10.5.7 GPU Mining Colocation Market Size & Forecast, By Country, 2021 – 2032

  10.5.7.1 Brazil

   10.5.7.1.1 GPU Mining Colocation Market Size & Forecast, By Service Type, 2021 – 2032

   10.5.7.1.2 GPU Mining Colocation Market Size & Forecast, By Mining Type, 2021 – 2032

   10.5.7.1.3 GPU Mining Colocation Market Size & Forecast, By End-User, 2021 – 2032

   10.5.7.1.4 GPU Mining Colocation Market Size & Forecast, By Facility Size, 2021 – 2032

   10.5.7.1.5 GPU Mining Colocation Market Size & Forecast, By Power Capacity, 2021 – 2032

  10.5.7.2 Argentina

   10.5.7.2.1 GPU Mining Colocation Market Size & Forecast, By Service Type, 2021 – 2032

   10.5.7.2.2 GPU Mining Colocation Market Size & Forecast, By Mining Type, 2021 – 2032

   10.5.7.2.3 GPU Mining Colocation Market Size & Forecast, By End-User, 2021 – 2032

   10.5.7.2.4 GPU Mining Colocation Market Size & Forecast, By Facility Size, 2021 – 2032

   10.5.7.2.5 GPU Mining Colocation Market Size & Forecast, By Power Capacity, 2021 – 2032

  10.5.7.3 Mexico

   10.5.7.3.1 GPU Mining Colocation Market Size & Forecast, By Service Type, 2021 – 2032

   10.5.7.3.2 GPU Mining Colocation Market Size & Forecast, By Mining Type, 2021 – 2032

   10.5.7.3.3 GPU Mining Colocation Market Size & Forecast, By End-User, 2021 – 2032

   10.5.7.3.4 GPU Mining Colocation Market Size & Forecast, By Facility Size, 2021 – 2032

   10.5.7.3.5 GPU Mining Colocation Market Size & Forecast, By Power Capacity, 2021 – 2032

  10.5.7.4 Colombia

   10.5.7.4.1 GPU Mining Colocation Market Size & Forecast, By Service Type, 2021 – 2032

   10.5.7.4.2 GPU Mining Colocation Market Size & Forecast, By Mining Type, 2021 – 2032

   10.5.7.4.3 GPU Mining Colocation Market Size & Forecast, By End-User, 2021 – 2032

   10.5.7.4.4 GPU Mining Colocation Market Size & Forecast, By Facility Size, 2021 – 2032

   10.5.7.4.5 GPU Mining Colocation Market Size & Forecast, By Power Capacity, 2021 – 2032

  10.5.7.5 Rest of Latin America

   10.5.7.5.1 GPU Mining Colocation Market Size & Forecast, By Service Type, 2021 – 2032

   10.5.7.5.2 GPU Mining Colocation Market Size & Forecast, By Mining Type, 2021 – 2032

   10.5.7.5.3 GPU Mining Colocation Market Size & Forecast, By End-User, 2021 – 2032

   10.5.7.5.4 GPU Mining Colocation Market Size & Forecast, By Facility Size, 2021 – 2032

   10.5.7.5.5 GPU Mining Colocation Market Size & Forecast, By Power Capacity, 2021 – 2032

10.6 Middle East & Africa

 10.6.1 Key Trends

 10.6.2 GPU Mining Colocation Market Size & Forecast, By Service Type, 2021 – 2032

 10.6.3 GPU Mining Colocation Market Size & Forecast, By Mining Type, 2021 – 2032

 10.6.4 GPU Mining Colocation Market Size & Forecast, By End-User, 2021 – 2032

 10.6.5 GPU Mining Colocation Market Size & Forecast, By Facility Size, 2021 – 2032

 10.6.6 GPU Mining Colocation Market Size & Forecast, By Power Capacity, 2021 – 2032

 10.6.7 GPU Mining Colocation Market Size & Forecast, By Country, 2021 – 2032

  10.6.7.1 UAE

   10.6.7.1.1 GPU Mining Colocation Market Size & Forecast, By Service Type, 2021 – 2032

   10.6.7.1.2 GPU Mining Colocation Market Size & Forecast, By Mining Type, 2021 – 2032

   10.6.7.1.3 GPU Mining Colocation Market Size & Forecast, By End-User, 2021 – 2032

   10.6.7.1.4 GPU Mining Colocation Market Size & Forecast, By Facility Size, 2021 – 2032

   10.6.7.1.5 GPU Mining Colocation Market Size & Forecast, By Power Capacity, 2021 – 2032

  10.6.7.2 Saudi Arabia

   10.6.7.2.1 GPU Mining Colocation Market Size & Forecast, By Service Type, 2021 – 2032

   10.6.7.2.2 GPU Mining Colocation Market Size & Forecast, By Mining Type, 2021 – 2032

   10.6.7.2.3 GPU Mining Colocation Market Size & Forecast, By End-User, 2021 – 2032

   10.6.7.2.4 GPU Mining Colocation Market Size & Forecast, By Facility Size, 2021 – 2032

   10.6.7.2.5 GPU Mining Colocation Market Size & Forecast, By Power Capacity, 2021 – 2032

  10.6.7.3 Qatar

   10.6.7.3.1 GPU Mining Colocation Market Size & Forecast, By Service Type, 2021 – 2032

   10.6.7.3.2 GPU Mining Colocation Market Size & Forecast, By Mining Type, 2021 – 2032

   10.6.7.3.3 GPU Mining Colocation Market Size & Forecast, By End-User, 2021 – 2032

   10.6.7.3.4 GPU Mining Colocation Market Size & Forecast, By Facility Size, 2021 – 2032

   10.6.7.3.5 GPU Mining Colocation Market Size & Forecast, By Power Capacity, 2021 – 2032

  10.6.7.4 Egypt

   10.6.7.4.1 GPU Mining Colocation Market Size & Forecast, By Service Type, 2021 – 2032

   10.6.7.4.2 GPU Mining Colocation Market Size & Forecast, By Mining Type, 2021 – 2032

   10.6.7.4.3 GPU Mining Colocation Market Size & Forecast, By End-User, 2021 – 2032

   10.6.7.4.4 GPU Mining Colocation Market Size & Forecast, By Facility Size, 2021 – 2032

   10.6.7.4.5 GPU Mining Colocation Market Size & Forecast, By Power Capacity, 2021 – 2032

  10.6.7.5 South Africa

   10.6.7.5.1 GPU Mining Colocation Market Size & Forecast, By Service Type, 2021 – 2032

   10.6.7.5.2 GPU Mining Colocation Market Size & Forecast, By Mining Type, 2021 – 2032

   10.6.7.5.3 GPU Mining Colocation Market Size & Forecast, By End-User, 2021 – 2032

   10.6.7.5.4 GPU Mining Colocation Market Size & Forecast, By Facility Size, 2021 – 2032

   10.6.7.5.5 GPU Mining Colocation Market Size & Forecast, By Power Capacity, 2021 – 2032

  10.6.7.6 Rest of Middle East & Africa

   10.6.7.6.1 GPU Mining Colocation Market Size & Forecast, By Service Type, 2021 – 2032

   10.6.7.6.2 GPU Mining Colocation Market Size & Forecast, By Mining Type, 2021 – 2032

   10.6.7.6.3 GPU Mining Colocation Market Size & Forecast, By End-User, 2021 – 2032

   10.6.7.6.4 GPU Mining Colocation Market Size & Forecast, By Facility Size, 2021 – 2032

   10.6.7.6.5 GPU Mining Colocation Market Size & Forecast, By Power Capacity, 2021 – 2032

11. Competitive Landscape

 11.1 Key Players' Positioning

 11.2 Competitive Developments

  11.2.1 Key Strategies Adopted (%), By Key Players, 2024

  11.2.2 Year-Wise Strategies & Development, 2021 – 2025

  11.2.3 Number Of Strategies Adopted By Key Players, 2024

 11.3 Market Share Analysis, 2024

 11.4 Product/Service & Application Benchmarking

  11.4.1 Product/Service Specifications & Features By Key Players

  11.4.2 Product/Service Heatmap By Key Players

  11.4.3 Application Heatmap By Key Players

 11.5 Industry Start-Up & Innovation Landscape

 11.6 Key Company Profiles

11.6 Key Company Profiles

11.6.1 CoreWeave

  11.6.1.1 Company Overview & Snapshot

  11.6.1.2 Product/Service Portfolio

  11.6.1.3 Key Company Financials

  11.6.1.4 SWOT Analysis

11.6.2 ZoomHash

  11.6.2.1 Company Overview & Snapshot

  11.6.2.2 Product/Service Portfolio

  11.6.2.3 Key Company Financials

  11.6.2.4 SWOT Analysis

11.6.3 MegaVolt Mining

  11.6.3.1 Company Overview & Snapshot

  11.6.3.2 Product/Service Portfolio

  11.6.3.3 Key Company Financials

  11.6.3.4 SWOT Analysis

11.6.4 Infinity Data Center / Webservio

  11.6.4.1 Company Overview & Snapshot

  11.6.4.2 Product/Service Portfolio

  11.6.4.3 Key Company Financials

  11.6.4.4 SWOT Analysis

11.6.5 AceHost

  11.6.5.1 Company Overview & Snapshot

  11.6.5.2 Product/Service Portfolio

  11.6.5.3 Key Company Financials

  11.6.5.4 SWOT Analysis

11.6.6 Whitelabel IT Solutions

  11.6.6.1 Company Overview & Snapshot

  11.6.6.2 Product/Service Portfolio

  11.6.6.3 Key Company Financials

  11.6.6.4 SWOT Analysis

11.6.7 Coolhousing

  11.6.7.1 Company Overview & Snapshot

  11.6.7.2 Product/Service Portfolio

  11.6.7.3 Key Company Financials

  11.6.7.4 SWOT Analysis

11.6.8 Colocation America

  11.6.8.1 Company Overview & Snapshot

  11.6.8.2 Product/Service Portfolio

  11.6.8.3 Key Company Financials

  11.6.8.4 SWOT Analysis

11.6.9 Core Scientific

  11.6.9.1 Company Overview & Snapshot

  11.6.9.2 Product/Service Portfolio

  11.6.9.3 Key Company Financials

  11.6.9.4 SWOT Analysis=

11.6.10 Hut 8 Mining

  11.6.10.1 Company Overview & Snapshot

  11.6.10.2 Product/Service Portfolio

  11.6.10.3 Key Company Financials

  11.6.10.4 SWOT Analysis

11.6.11 Hive Digital Technologies

  11.6.11.1 Company Overview & Snapshot

  11.6.11.2 Product/Service Portfolio

  11.6.11.3 Key Company Financials

  11.6.11.4 SWOT Analysis

11.6.12 Bit Digital

  11.6.12.1 Company Overview & Snapshot

  11.6.12.2 Product/Service Portfolio

  11.6.12.3 Key Company Financials

  11.6.12.4 SWOT Analysis

11.6.13 Iris Energy

  11.6.13.1 Company Overview & Snapshot

  11.6.13.2 Product/Service Portfolio

  11.6.13.3 Key Company Financials

  11.6.13.4 SWOT Analysis

11.6.14 HostRunway

  11.6.14.1 Company Overview & Snapshot

  11.6.14.2 Product/Service Portfolio

  11.6.14.3 Key Company Financials

  11.6.14.4 SWOT Analysis

11.6.15 ColocationPLUS

  11.6.15.1 Company Overview & Snapshot

  11.6.15.2 Product/Service Portfolio

  11.6.15.3 Key Company Financials

  11.6.15.4 SWOT Analysis

11.6.16 CloudKleyer

  11.6.16.1 Company Overview & Snapshot

  11.6.16.2 Product/Service Portfolio

  11.6.16.3 Key Company Financials

  11.6.16.4 SWOT Analysis

11.6.17 Veloxty

  11.6.17.1 Company Overview & Snapshot

  11.6.17.2 Product/Service Portfolio

  11.6.17.3 Key Company Financials

  11.6.17.4 SWOT Analysis

11.6.18 Bit Capital Group (BitCap)

  11.6.18.1 Company Overview & Snapshot

  11.6.18.2 Product/Service Portfolio

  11.6.18.3 Key Company Financials

  11.6.18.4 SWOT Analysis

11.6.19 TensorDock

  11.6.19.1 Company Overview & Snapshot

  11.6.19.2 Product/Service Portfolio

  11.6.19.3 Key Company Financials

  11.6.19.4 SWOT Analysis

11.6.20 OneMiners

  11.6.20.1 Company Overview & Snapshot

  11.6.20.2 Product/Service Portfolio

  11.6.20.3 Key Company Financials

  11.6.20.4 SWOT Analysis

12. Analyst Recommendations

 12.1 SNS Insider Opportunity Map

 12.2 Industry Low-Hanging Fruit Assessment

 12.3 Market Entry & Growth Strategy

 12.4 Analyst Viewpoint & Suggestions On Market Growth

13. Assumptions

14. Disclaimer

15. Appendix

 15.1 List Of Tables

 15.2 List Of Figures

An accurate research report requires proper strategizing as well as implementation. There are multiple factors involved in the completion of good and accurate research report and selecting the best methodology to compete the research is the toughest part. Since the research reports we provide play a crucial role in any company’s decision-making process, therefore we at SNS Insider always believe that we should choose the best method which gives us results closer to reality. This allows us to reach at a stage wherein we can provide our clients best and accurate investment to output ratio.

Each report that we prepare takes a timeframe of 350-400 business hours for production. Starting from the selection of titles through a couple of in-depth brain storming session to the final QC process before uploading our titles on our website we dedicate around 350 working hours. The titles are selected based on their current market cap and the foreseen CAGR and growth.


The 5 steps process:

Step 1: Secondary Research:

Secondary Research or Desk Research is as the name suggests is a research process wherein, we collect data through the readily available information. In this process we use various paid and unpaid databases which our team has access to and gather data through the same. This includes examining of listed companies’ annual reports, Journals, SEC filling etc. Apart from this our team has access to various associations across the globe across different industries. Lastly, we have exchange relationships with various university as well as individual libraries.

Secondary Research

Step 2: Primary Research

When we talk about primary research, it is a type of study in which the researchers collect relevant data samples directly, rather than relying on previously collected data.  This type of research is focused on gaining content specific facts that can be sued to solve specific problems. Since the collected data is fresh and first hand therefore it makes the study more accurate and genuine.

We at SNS Insider have divided Primary Research into 2 parts.

Part 1 wherein we interview the KOLs of major players as well as the upcoming ones across various geographic regions. This allows us to have their view over the market scenario and acts as an important tool to come closer to the accurate market numbers. As many as 45 paid and unpaid primary interviews are taken from both the demand and supply side of the industry to make sure we land at an accurate judgement and analysis of the market.

This step involves the triangulation of data wherein our team analyses the interview transcripts, online survey responses and observation of on filed participants. The below mentioned chart should give a better understanding of the part 1 of the primary interview.

Primary Research

Part 2: In this part of primary research the data collected via secondary research and the part 1 of the primary research is validated with the interviews from individual consultants and subject matter experts.

Consultants are those set of people who have at least 12 years of experience and expertise within the industry whereas Subject Matter Experts are those with at least 15 years of experience behind their back within the same space. The data with the help of two main processes i.e., FGDs (Focused Group Discussions) and IDs (Individual Discussions). This gives us a 3rd party nonbiased primary view of the market scenario making it a more dependable one while collation of the data pointers.

Step 3: Data Bank Validation

Once all the information is collected via primary and secondary sources, we run that information for data validation. At our intelligence centre our research heads track a lot of information related to the market which includes the quarterly reports, the daily stock prices, and other relevant information. Our data bank server gets updated every fortnight and that is how the information which we collected using our primary and secondary information is revalidated in real time.

Data Bank Validation

Step 4: QA/QC Process

After all the data collection and validation our team does a final level of quality check and quality assurance to get rid of any unwanted or undesired mistakes. This might include but not limited to getting rid of the any typos, duplication of numbers or missing of any important information. The people involved in this process include technical content writers, research heads and graphics people. Once this process is completed the title gets uploader on our platform for our clients to read it.

Step 5: Final QC/QA Process:

This is the last process and comes when the client has ordered the study. In this process a final QA/QC is done before the study is emailed to the client. Since we believe in giving our clients a good experience of our research studies, therefore, to make sure that we do not lack at our end in any way humanly possible we do a final round of quality check and then dispatch the study to the client.

Key Segments: 

By Service Type

  • Managed Colocation

  • Unmanaged Colocation

  • Hybrid Colocation

By Mining Type

  • Bitcoin Mining

  • Ethereum Mining

  • Altcoin Mining

  • Others

By End-User

  • Individual Miners

  • Mining Farms

  • Enterprises

By Facility Size

  • Small

  • Medium

  • Large

By Power Capacity

  • Below 1 MW

  • 1-5 MW

  • Above 5 MW


Request for Segment Customization as per your Business Requirement: Segment Customization Request

Regional Coverage: 

North America

  • US

  • Canada

Europe

  • Germany

  • France

  • UK

  • Italy

  • Spain

  • Poland

  • Russia

  • Rest of Europe

Asia Pacific

  • China

  • India

  • Japan

  • South Korea

  • Australia

  • ASEAN Countries

  • Rest of Asia Pacific

Middle East & Africa

  • UAE

  • Saudi Arabia

  • Qatar

  • South Africa

  • Rest of Middle East & Africa

Latin America

  • Brazil

  • Argentina

  • Mexico

  • Colombia

  • Rest of Latin America

Request for Country Level Research Report: Country Level Customization Request

Available Customization 

With the given market data, SNS Insider offers customization as per the company’s specific needs. The following customization options are available for the report: 

  • Detailed Volume Analysis 

  • Criss-Cross segment analysis (e.g. Product X Application) 

  • Competitive Product Benchmarking 

  • Geographic Analysis 

  • Additional countries in any of the regions 

  • Customized Data Representation 

  • Detailed analysis and profiling of additional market players

Explore Key Insights.


  • Analyzes market trends, forecasts, and regional dynamics
  • Covers core offerings, innovations, and industry use cases
  • Profiles major players, value chains, and strategic developments
  • Highlights innovation trends, regulatory impacts, and growth opportunities
Request an Analyst Call