image

Software as a Service (SaaS) Market Report Scope & Overview:

Software as a Service (SaaS) Market Revenue Analysis

Get more information on Software as a Service (SaaS) Market - Request Sample Report

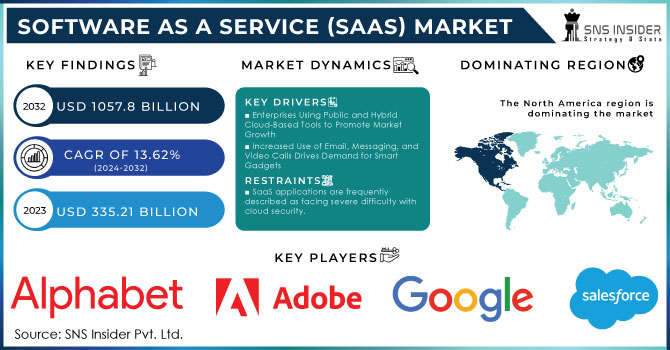
The Software as a Service (SaaS) Market size was recorded at USD 335.21 billion in 2023 and is expected to reach USD 1057.8 billion by 2032, growing at a CAGR of 13.62 % over the forecast period of 2024-2032.

The widespread popularity of public cloud services across all industries is driving a surge in demand for traffic management. Companies are swiftly transitioning from on-premises Software-as-a-Service models due to the exorbitant costs of on-premises software deployment, which is poised to significantly boost the market. The utilization of cloud-based services, particularly cloud application service/software-as-a-service, has increased to USD 195 billion in 2023, with an anticipated global revenue of approximately 245 billion US dollars by the end of the year.

The global Software-as-a-Service (SaaS) market is expected to continue growing as businesses of all sizes adopt SaaS solutions for various operations such as web hosting, e-commerce, enterprise resource planning (ERP), and customer relationship management (CRM). For example, private SaaS companies experienced a growth rate of approximately 35%, surpassing the growth rate of public SaaS companies, which was around 23% in 2023.

The increasing use of emails, instant messaging, and video calls is driving the demand for smart devices among end-users, which in turn is expected to boost the growth of the Software-as-a-Service market. Additionally, organizations are turning to CRM SaaS solutions more and more to reduce IT costs and scale more easily. Businesses can now customize their CRM systems more easily and make them more accessible. For example, in December 2022, AppOmni announced a collaboration with Veeva Systems to provide added security for Veeva CRM and Veeva Vault. With this launch, life sciences customers can now utilize AppOmni's complete threat detection and configuration management capabilities to better operationalize best practices.

In the dynamic Software-as-a-Service market, the utilization of artificial intelligence (AI)internet of things (IoT) to comprehend customer behavior stands out as a significant trend. This involves customizing products, services, and content to specifically meet the individual needs of customers based on collected information. Furthermore, the implementation of Machine Learning (ML) for automated customer inquiry handling through chatbots demonstrates a clear advancement. Additional trends include the adoption of Vertical SaaS, migration to Platform-as-a-Service (PaaS), and the use of Application Programming Interface (API) connections.

The Software-as-a-Service (SaaS) market operates through three primary types of cloud computing: Platform as a Service (PaaS) and Infrastructure as a Service (IaaS). These applications are utilized by various IT specialists, commercial users, and private users. A wide range of products are available, from consumer electronics like Netflix to advanced IT tools. SaaS products typically target both business-to-business (B2B) and business-to-consumer (B2C) users, unlike IaaS and PaaS. For example, the B2B SaaS market has demonstrated the highest medium growth rate with annual recurring revenue of less than $1 million.

Market Dynamics

Drivers

  • Enterprises Using Public and Hybrid Cloud-Based Tools to Promote Market Growth

  • The usage of email, instant messaging, and video calls has significantly increased, which stimulates end-user demand for smart gadgets is drives the market.

Public and hybrid cloud-based solutions are increasingly being adopted by businesses, increasing system resilience and advancing the new realities imposed by the epidemic. Additionally, more businesses are converting to hybrid clouds, which combine on-premises and public cloud solutions. For the sake of future market expansion, some major companies are encouraging and promoting the use of cloud-based solutions. For Instance, the U.S SaaS market has shown rapid growth by supporting various startups in this field such as InVideo, LinkTree, etc.

Restrains

  • SaaS applications are frequently described as facing severe difficulty with cloud security.

  • Sensitive data not secure enough to support market expansion

Professionals use SaaS-based platforms to store both their personal and business-sensitive data. Security has thus always been a top priority for security experts. Misconfigured SaaS is the main issue, according to several businesses in the sector.

The setup of internal applications is also turning into a significant difficulty for security personnel. Misconfigurations cause sensitive data to be lost and hesitant application programming interfaces cause sensitive data to be disclosed without authorization.

Opportunities

  • Increased availability of secure internet servers in China, Japan, and India during the forecast period contributed to the market's expansion.

Key Market Segmentation:

By Component Type:

Software held over 80% of total revenue in 2023. The global crisis accelerated the penetration of flexible working time and work elsewhere, which changed employee expectations. Thus several businesses are now using SaaS solutions for simple communication, business productivity, and remote teamwork. These offer cloud storage, video chat, and project views. Additionally, The demand for SaaS solutions that provide automation to streamline workflows and increase productivity while delivering AI-based insights is also increasing. With the accelerated digital transformation across industries, companies are increasingly relying on data to speed up their processes and get a deeper insight into consumers or users. Investment in SaaS solutions powered by analytics has increased as a result.

By Deployment Type:

With a revenue share above 43% in 2023, the private cloud segment dominated the SaaS Market. Enterprises can get improved speed and reduced latency by combining private cloud infrastructure with SaaS application deployment at the network's edge, in addition to gaining more control and security over data.  Additionally, by employing a private cloud architecture, making sure legal standards are met, and lowering the risk of data breaches, enterprises may keep more control over their data. All things considered, integrating edge computing with the private cloud can offer a strong foundation for providing SaaS applications that satisfy the requirements of contemporary enterprises.

By Enterprise-size:

Large enterprises were the largest enterprise size segment of this market in 2023 with a global share exceeding 61% during that year. Different Ways Large businesses can benefit from SaaS, even large-scale businesses tend to have certain benefits from using this software which includes schemes of flexibility, scalability, and cost. Major companies will also adopt platform-as-a-service (PaaS) solutions. PaaS solutions provide more abstraction than SaaS solutions, enabling companies to focus on creating and deploying applications rather than the upkeep of dedicated infrastructures. They allow large businesses to avail of lower development costs, quicker time-to-market, and better creativity & flexibility. For Instance, the top PaaS providers of the companies are AWS Elastic Beanstalk, Engine Yard, Google App engine, etc.

By Application:

In Application type segmentation, the other categories which include Media, Entertainment, BFSI, and Automobile led the market with a revenue share of over 43% in 2023. The Banks are using the Saas application to provide best customer service through virtual assistance. Like the same, Media and entertainment use the software for marketing and balancing financial coverage, and also for protecting the customer's data and security. For Instance, the popular apps used in these domains are Salesforce, PowerBI, Simens PML, Oracle, etc.

The remaining areas include supply chain management, edge computing, AI as a service, IoT as a service, unified communications as a service, and operations management. The rise of new technologies like artificial intelligence (AI), cloud computing, and robotic process automation (RPA) may bring about a revolution in the supply chain software business.

Regional Analysis

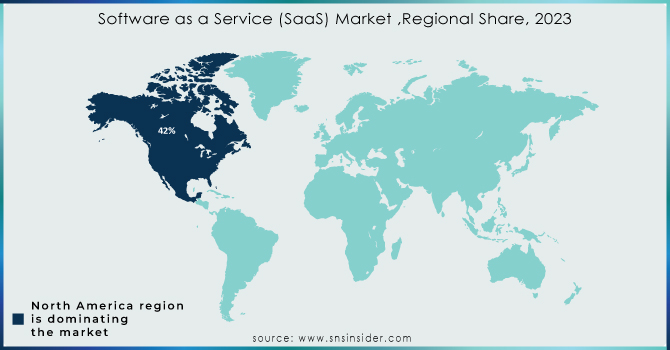
North America led the Software-as-a-Service market with more than 42% of the market share in 2023. The U.S. is helping the market revenue to increase favorably. One of the elements promoting market expansion is the existence of established industry players. Additionally, the region's well-developed IT infrastructure facilitates the quick deployment of cloud-based virtual services, further boosting its sizeable share of the world's software as a service (SaaS) market. The large market share was also aided by the massive investment in cloud infrastructure and the availability of numerous secure internet servers. For Instance, the top U.S.-based SaaS companies are Adobe, Salesforce, ServiceNow, Shopify, etc. which are ruling the market with huge market capital.

 In the future period, Asia Pacific is expected to have the fastest CAGR. Due to the increased demand for outsourcing cloud-based software and the increasing number of small and medium-sized businesses outsourcing throughout the region, China and India are positively influencing the market's growth. To lower the cost of deploying software on-premises, SMEs heavily outsource cloud-based software platforms. Furthermore, it is anticipated that the market will have plenty of opportunities due to the IT sector's significant growth.

Software-as-a-Service-SaaS-Market-Regional-Share-2023

Need any customization research/data on Software as a Service (SaaS) Market - Enquiry Now

Key Players:

The major players in Market are IBM, Alphabet Inc., Google LLC, Salesforce, Inc., Adobe Inc, Oracle, Alibaba Cloud, SAP SE, Rackspace Technology, Inc., ServiceNow, Inc, VMware Inc., Cisco Systems, Inc., IONOS Cloud Inc. Atlassian, Microsoft Corporation, Hewlett Packard Enterprise Company. And others in the final report.

Recent development

  • D2L and MDF COMMERCE is expanding their software market with the current acquisition. MDF Commerce, a Montreal-based company, is buying up EcoInteractive, a software startup, and at the same time, D2L, has purchased H5P Group, a startup specializing in creating interactive content, for USD 25.6 million.

  • A US investment company called STG has bought Eka Software Solutions, an Indian tech firm. Eka specializes in helping businesses manage commodities, especially those related to agriculture and energy.

Software as a Service Market Report Scope:
Report Attributes Details
Market Size in 2023  US$ 335.21 Bn
Market Size by 2032  US$ 1057.8 Bn
CAGR   CAGR of 13.62% From 2024 to 2032
Base Year  2023
Forecast Period  2024-2032
Historical Data  2020-2022
Report Scope & Coverage Market Size, Segments Analysis, Competitive  Landscape, Regional Analysis, DROC & SWOT Analysis, Forecast Outlook
Key Segments

• By Deployment Type (Public, Private, Hybrid)

• By Component (Software, Service)

• By Enterprise-size (Small & Medium Enterprises, Large Enterprises)

• By Application (Customer Relationship Management (CRM), Enterprise Resource Planning (ERP), Content, Collaboration & Communication, BI & Analytics, Human Capital Management, Others)

• By Industry (IT & Telecom, BFSI, Retail & Consumer Goods, Healthcare, Education, Manufacturing, Others)

Regional Analysis/Coverage North America (US, Canada, Mexico), Europe (Eastern Europe [Poland, Romania, Hungary, Turkey, Rest of Eastern Europe] Western Europe] Germany, France, UK, Italy, Spain, Netherlands, Switzerland, Austria, Rest of Western Europe]), Asia Pacific (China, India, Japan, South Korea, Vietnam, Singapore, Australia, Rest of Asia Pacific), Middle East & Africa (Middle East [UAE, Egypt, Saudi Arabia, Qatar, Rest of Middle East], Africa [Nigeria, South Africa, Rest of Africa], Latin America (Brazil, Argentina, Colombia, Rest of Latin America)
Company Profiles IBM, Alphabet Inc., Google LLC, Salesforce, Inc., Adobe Inc, Oracle, Alibaba Cloud, SAP SE, Rackspace Technology, Inc., ServiceNow, Inc, VMware Inc., Cisco Systems, Inc., IONOS Cloud Inc. Atlassian, Microsoft Corporation, Hewlett Packard Enterprise Company
Key Drivers • Enterprises Using Public and Hybrid Cloud-Based Tools to Promote Market Growth
• The usage of email, instant messaging, and video calls has significantly increased, which stimulates end-user demand for smart gadgets is drive the market.
Market Opportunities • Increased availability of secure internet servers in China, Japan, and India during the forecast period contributed to the market's expansion.


Frequently Asked Questions

The CAGR of the Software as a Service Market for the forecast period 2024-2031 is 13.62 %.

The market is expected to grow to USD 1057.8 billion by the forecast period of 2032.

The major worldwide key players in the Software as a Service Market are IBM, Alphabet Inc., Google LLC, Salesforce, Inc., Adobe Inc, Oracle, Alibaba Cloud, SAP SE, Rackspace Technology, Inc., ServiceNow, Inc, VMware Inc., Cisco Systems, Inc., IONOS Cloud Inc. Atlassian, Microsoft Corporation, Hewlett Packard Enterprise Company. And others in final report.

USD  335.21 billion in 2023 is the market share of the Software as a Service Market.

The forecast period for the Software as a Service Market is 2024-2032.

TABLE OF CONTENTS

1. Introduction

1.1 Market Definition

1.2 Scope

1.3 Research Assumptions

2. Industry Flowchart

3. Research Methodology

4. Market Dynamics

4.1 Drivers

4.2 Restraints

4.3 Opportunities

4.4 Challenges

5. Porter’s 5 Forces Model

6.  Pest Analysis

7. Software as a Service Market Segmentation, By Component

7.1 Introduction

7.2 Software

7.3 Deployment

8. Software as a Service Market Segmentation, By Deployment Application

8.1 Introduction

8.2 Private Cloud

8.3 Public Cloud

8.4 Hybrid Cloud

9. Software as a Service Market Segmentation, By Enterprise Size

9.1 Introduction

9.2 Small & Medium Enterprises

9.3 Large Enterprises

10. Software as a Service Market Segmentation, By Application

10.1 Introduction

10.2 Customer Relationship Management (CRM)

10.3 Enterprise Resource Planning (ERP)

10.4 Content

10.5 Collaboration & Communication

10.6 BI & Analytics

10.7 Human Capital Management

10.8 Others

11. Software as a Service Market Segmentation, By Industry

11.1 Introduction

11.2 IT & Telecom

11.3 BFSI

11.4 Retail & Consumer Goods

11.5 Healthcare

11.6 Education

11.7 Manufacturing

11.8 Travel & Hospitality

11.9 Others

12. Regional Analysis

12.1 Introduction

12.2 North America

12.2.1 Trend Analysis

12.2.2 North America Software as a Service Market By Country

12.2.3 North America Software as a Service Market By Component

12.2.4 North America Software as a Service Market By Deployment Application

12.2.5 North America Software as a Service Market By Enterprise Size

12.2.6 North America Software as a Service Market, By Application

12.2.7 North America Software as a Service Market, By Industry

12.2.8 USA     

12.2.8.1 USA Software as a Service Market By Component

12.2.8.2 USA Software as a Service Market By Deployment Application

12.2.8.3 USA Software as a Service Market By Enterprise Size

12.2.8.4 USA Software as a Service Market, By Application

12.2.8.5 USA Software as a Service Market, By Industry

12.2.9 Canada

12.2.9.1 Canada Software as a Service Market By Component   

12.2.9.2 Canada Software as a Service Market By Deployment Application

12.2.9.3 Canada Software as a Service Market By Enterprise Size

12.2.9.4 Canada Software as a Service Market, By Application

12.2.9.5 Canada Software as a Service Market, By Industry

12.2.10 Mexico

12.2.10.1 Mexico Software as a Service Market By Component

12.2.10.2 Mexico Software as a Service Market By Deployment Application

12.2.10.3 Mexico Software as a Service Market By Enterprise Size

12.2.10.4 Mexico Software as a Service Market, By Application

12.2.10.5 Mexico Software as a Service Market, By Industry

12.3 Europe

12.3.1 Trend Analysis

12.3.2 Eastern Europe

12.3.2.1 Eastern Europe Software as a Service Market By Country

12.3.2.2 Eastern Europe Software as a Service Market By Component

12.3.2.3 Eastern Europe Software as a Service Market By Deployment Application

12.3.2.4 Eastern Europe Software as a Service Market By Enterprise Size

12.3.2.5 Eastern Europe Software as a Service Market By Application

12.3.2.6 Eastern Europe Software as a Service Market, By Industry

12.3.2.7 Poland

12.3.2.7.1 Poland Software as a Service Market By Component 

12.3.2.7.2 Poland Software as a Service Market By Deployment Application

12.3.2.7.3 Poland Software as a Service Market By Enterprise Size

12.3.2.7.4 Poland Software as a Service Market By Application

12.3.2.7.5 Poland Software as a Service Market, By Industry

12.3.2.8 Romania

12.3.2.8.1 Romania Software as a Service Market By Component          

12.3.2.8.2 Romania Software as a Service Market By Deployment Application

12.3.2.8.3 Romania Software as a Service Market By Enterprise Size

12.3.2.8.4 Romania Software as a Service Market By Application

12.3.2.8.5 Romania Software as a Service Market, By Industry

12.3.2.9 Hungary

12.3.2.9.1 Hungary Software as a Service Market By Component

12.3.2.9.2 Hungary Software as a Service Market By Deployment Application

12.3.2.9.3 Hungary Software as a Service Market By Enterprise Size

12.3.2.9.4 Hungary Software as a Service Market By Application

12.3.2.9.5 Hungary Software as a Service Market, By Industry

12.3.2.10 turkey

12.3.2.10.1 Turkey Software as a Service Market By Component

12.3.2.10.2 Turkey Software as a Service Market By Deployment Application

12.3.2.10.3 Turkey Software as a Service Market By Enterprise Size

12.3.2.10.4 Turkey Software as a Service Market By Application

12.3.2.10.5 Turkey Software as a Service Market, By Industry

12.3.2.11 Rest of Eastern Europe

12.3.2.11.1 Rest of Eastern Europe Software as a Service Market By Component

12.3.2.11.2 Rest of Eastern Europe Software as a Service Market By Deployment Application

12.3.2.11.3 Rest of Eastern Europe Software as a Service Market By Enterprise Size

12.3.2.11.4 Rest of Eastern Europe Software as a Service Market By Application

12.3.2.11.5 Rest of Eastern Europe Software as a Service Market, By Industry

12.3.3 Western Europe 

12.3.3.1 Western Europe Software as a Service Market By Country

12.3.3.2 Western Europe Software as a Service Market By Component

12.3.3.3 Western Europe Software as a Service Market By Deployment Application

12.3.3.4 Western Europe Software as a Service Market By Enterprise Size

12.3.3.5 Western Europe Software as a Service Market By Application

12.3.3.6 Western Europe Software as a Service Market, By Industry

12.3.3.7 Germany

12.3.3.7.1 Germany Software as a Service Market By Component

12.3.3.7.2 Germany Software as a Service Market By Deployment Application

12.3.3.7.3 Germany Software as a Service Market By Enterprise Size

12.3.3.7.4 Germany Software as a Service Market By Application

12.3.3.7.5 Germany Software as a Service Market, By Industry

12.3.3.8 France 

12.3.3.8.1 France Software as a Service Market By Component

12.3.3.8.2 France Software as a Service Market By Deployment Application

12.3.3.8.3 France Software as a Service Market By Enterprise Size

12.3.3.8.4 France Software as a Service Market By Application

12.3.3.8.5 France Software as a Service Market, By Industry

12.3.3.9 UK

12.3.3.9.1 UK Software as a Service Market By Component

12.3.3.9.2 UK Software as a Service Market By Deployment Application

12.3.3.9.3 UK Software as a Service Market By Enterprise Size

12.3.3.9.4 UK Software as a Service Market By Application

12.3.3.9.5 UK Software as a Service Market, By Industry

12.3.3.10 Italy

12.3.3.10.1 Italy Software as a Service Market By Component   

12.3.3.10.2 Italy Software as a Service Market By Deployment Application

12.3.3.10.3 Italy Software as a Service Market By Enterprise Size

12.3.3.10.4 Italy Software as a Service Market By Application

12.3.3.10.5 Italy Software as a Service Market, By Industry

12.3.3.11 Spain

12.3.3.11.1 Spain Software as a Service Market By Component

12.3.3.11.2 Spain Software as a Service Market By Deployment Application

12.3.3.11.3 Spain Software as a Service Market By Enterprise Size

12.3.3.11.4 Spain Software as a Service Market By Application

12.3.3.11.5 Spain Software as a Service Market, By Industry

12.3.3.12 Netherlands

12.3.3.12.1 Netherlands Software as a Service Market By Component  

12.3.3.12.2 Netherlands Software as a Service Market By Deployment Application

12.3.3.12.3 Netherlands Software as a Service Market By Enterprise Size

12.3.3.12.4 Netherlands Software as a Service Market By Application

12.3.3.12.5 Netherlands Software as a Service Market, By Industry

12.3.3.13 Switzerland

12.3.3.13.1 Switzerland Software as a Service Market By Component   

12.3.3.13.2 Switzerland Software as a Service Market By Deployment Application

12.3.3.13.3 Switzerland Software as a Service Market By Enterprise Size

12.3.3.13.4 Switzerland Software as a Service Market By Application

12.3.3.13.5 Switzerland Software as a Service Market, By Industry

12.3.3.14 Austria 

12.3.3.14.1 Austria Software as a Service Market By Component

12.3.3.14.2 Austria Software as a Service Market By Deployment Application

12.3.3.14.3 Austria Software as a Service Market By Enterprise Size

12.3.3.14.4 Austria Software as a Service Market By Application

12.3.3.14.5 Austria Software as a Service Market, By Industry

12.3.3.15 Rest of Western Europe

12.3.3.15.1 Rest of Western Europe Software as a Service Market By Component

12.3.3.15.2 Rest of Western Europe Software as a Service Market By Deployment Application

12.3.3.15.3 Rest of Western Europe Software as a Service Market By Enterprise Size

12.3.3.15.4 Rest of Western Europe Software as a Service Market By Application

12.3.3.15.5 Rest of Western Europe Software as a Service Market, By Industry

12.4 Asia-Pacific

12.4.1 Trend Analysis

12.4.2 Asia-Pacific Software as a Service Market By Country

12.4.3 Asia-Pacific Software as a Service Market By Component

12.4.4 Asia-Pacific Software as a Service Market By Deployment Application

12.4.5 Asia-Pacific Software as a Service Market By Enterprise Size

12.4.6 Asia-Pacific Software as a Service Market By Application

12.4.7 Asia-Pacific Software as a Service Market, By Industry

12.4.8 China

12.4.8.1 China Software as a Service Market By Component      

12.4.8.2 China Software as a Service Market By Deployment Application         

12.4.8.3 China Software as a Service Market By Enterprise Size

12.4.8.4 China Software as a Service Market By Application

12.4.8.5 China Software as a Service Market, By Industry

12.4.9 India

12.4.9.1 India Software as a Service Market By Component

12.4.9.2 India Software as a Service Market By Deployment Application

12.4.9.3 India Software as a Service Market By Enterprise Size

12.4.9.4 India Software as a Service Market By Application

12.4.9.5 India Software as a Service Market, By Industry

12.4.10 japan

12.4.10.1 Japan Software as a Service Market By Component

12.4.10.2 Japan Software as a Service Market By Deployment Application

12.4.10.3 Japan Software as a Service Market By Enterprise Size

12.4.10.4 Japan Software as a Service Market By Application

12.4.10.5 Japan Software as a Service Market, By Industry

12.4.11 South Korea

12.4.11.1 South Korea Software as a Service Market By Component

12.4.11.2 South Korea Software as a Service Market By Deployment Application

12.4.11.3 South Korea Software as a Service Market By Enterprise Size

12.4.11.4 South Korea Software as a Service Market By Application

12.4.11.5 South Korean Software as a Service Market, By Industry

12.4.12 Vietnam

12.4.12.1 Vietnam Software as a Service Market By Component

12.4.12.2 Vietnam Software as a Service Market By Deployment Application

12.4.12.3 Vietnam Software as a Service Market By Enterprise Size

12.4.12.4 Vietnam Software as a Service Market By Application

12.4.12.5 Vietnam Software as a Service Market, By Industry

12.4.13 Singapore

12.4.13.1 Singapore Software as a Service Market By Component

12.4.13.2 Singapore Software as a Service Market By Deployment Application

12.4.13.3 Singapore Software as a Service Market By Enterprise Size

12.4.13.4 Singapore Software as a Service Market By Application

12.4.13.5 Singapore Software as a Service Market, By Industry

12.4.14 Australia

12.4.14.1 Australia Software as a Service Market By Component

12.4.14.2 Australia Software as a Service Market By Deployment Application

12.4.14.3 Australia Software as a Service Market By Enterprise Size

12.4.14.4 Australia Software as a Service Market By Application

12.4.14.5 Australia Software as a Service Market, By Industry

12.4.15 Rest of Asia-Pacific

12.4.15.1 Rest of Asia-Pacific Software as a Service Market By Component

12.4.15.2 Rest of Asia-Pacific Software as a Service Market By Deployment Application

12.4.15.3 Rest of Asia-Pacific Software as a Service Market By Enterprise Size

12.4.15.4 Rest of Asia-Pacific Software as a Service Market By Application

12.4.15.5 Rest of Asia-Pacific Software as a Service Market, By Industry

12.5 Middle East & Africa

12.5.1 Trend Analysis

12.5.2 Middle East

12.5.2.1 Middle East Software as a Service Market By Country

12.5.2.2 Middle East Software as a Service Market By Component

12.5.2.3 Middle East Software as a Service Market By Deployment Application

12.5.2.4 Middle East Software as a Service Market By Enterprise Size

12.5.2.5 Middle East Software as a Service Market By Application

12.5.2.6 Middle East Software as a Service Market, By Industry

12.5.2.7 UAE

12.5.2.7.1 UAE Software as a Service Market By Component

12.5.2.7.2 UAE Software as a Service Market By Deployment Application

12.5.2.7.3 UAE Software as a Service Market By Enterprise Size

12.5.2.7.4 UAE Software as a Service Market By Application

12.5.2.7.5 UAE Software as a Service Market, By Industry

12.5.2.8 Egypt

12.5.2.8.1 Egypt Software as a Service Market By Component

12.5.2.8.2 Egypt Software as a Service Market By Deployment Application

12.5.2.8.3 Egypt Software as a Service Market By Enterprise Size

12.5.2.8.4 Egypt Software as a Service Market By Application

12.5.2.8.5 Egypt Software as a Service Market, By Industry

12.5.2.9 Saudi Arabia 

12.5.2.9.1 Saudi Arabia Software as a Service Market By Component

12.5.2.9.2 Saudi Arabia Software as a Service Market By Deployment Application

12.5.2.9.3 Saudi Arabia Software as a Service Market By Enterprise Size

12.5.2.9.4 Saudi Arabia Software as a Service Market By Application

12.5.2.9.5 Saudi Arabia Software as a Service Market, By Industry

12.5.2.10 Qatar

12.5.2.10.1 Qatar Software as a Service Market By Component

12.5.2.10.2 Qatar Software as a Service Market By Deployment Application

12.5.2.10.3 Qatar Software as a Service Market By Enterprise Size

12.5.2.10.4 Qatar Software as a Service Market By Application

12.5.2.10.5 Qatar Software as a Service Market, By Industry

12.5.2.11 Rest of Middle East

12.5.2.11.1 Rest of Middle East Software as a Service Market By Component

12.5.2.11.2 Rest of Middle East Software as a Service Market By Deployment Application

12.5.2.11.3 Rest of Middle East Software as a Service Market By Enterprise Size

12.5.2.11.4 Rest of Middle East Software as a Service Market By Application

12.5.2.11.5 Rest of Middle East Software as a Service Market, By Industry

12.5.3 Africa

12.5.3.1 Africa Software as a Service Market By Country

12.5.3.2 Africa Software as a Service Market By Component

12.5.3.3 Africa Software as a Service Market By Deployment Application

12.5.3.4 Africa Software as a Service Market By Enterprise Size

12.5.3.5 Africa Software as a Service Market By Application

12.5.3.6 Africa Software as a Service Market, By Industry

12.5.3.7 Nigeria

12.5.3.7.1 Nigeria Software as a Service Market By Component

12.5.3.7.2 Nigeria Software as a Service Market By Deployment Application

12.5.3.7.3 Nigeria Software as a Service Market By Enterprise Size

12.5.3.7.4 Nigeria Software as a Service Market By Application

12.5.3.7.5 Nigeria Software as a Service Market, By Industry

12.5.3.8 South Africa

12.5.3.8.1 South Africa Software as a Service Market By Component

12.5.3.8.2 South Africa Software as a Service Market By Deployment Application

12.5.3.8.3 South Africa Software as a Service Market By Enterprise Size

12.5.3.8.4 South Africa Software as a Service Market By Application

12.5.3.8.5 South Africa Software as a Service Market, By Industry

12.5.3.9 Rest of Africa

12.5.3.9.1 Rest of Africa Software as a Service Market By Component

12.5.3.9.2 Rest of Africa Software as a Service Market By Deployment Application

12.5.3.9.3 Rest of Africa Software as a Service Market By Enterprise Size

12.5.3.9.4 Rest of Africa Software as a Service Market By Application

12.5.3.9.5 Rest of Africa Software as a Service Market, By Industry

12.6 Latin America

12.6.1 Trend Analysis

12.6.2 Latin America Software as a Service Market by Country

12.6.3 Latin America Software as a Service Market By Component

12.6.4 Latin America Software as a Service Market By Deployment Application

12.6.5 Latin America Software as a Service Market By Enterprise Size

12.6.6 Latin America Software as a Service Market By Application

12.6.7 Latin America Software as a Service Market, By Industry

12.6.8 brazil

12.6.8.1 Brazil Software as a Service Market By Component

12.6.8.2 Brazil Software as a Service Market By Deployment Application

12.6.8.3 Brazil Software as a Service Market By Enterprise Size

12.6.8.4 Brazil Software as a Service Market By Application

12.6.8.5 Brazil Software as a Service Market, By Industry

12.6.9 Argentina

12.6.9.1 Argentina Software as a Service Market By Component

12.6.9.2 Argentina Software as a Service Market By Deployment Application

12.6.9.3 Argentina Software as a Service Market By Enterprise Size

12.6.9.4 Argentina Software as a Service Market By Application

12.6.9.5 Argentina Software as a Service Market, By Industry

12.6.10 Colombia

12.6.10.1 Colombia Software as a Service Market By Component

12.6.10.2 Colombia Software as a Service Market By Deployment Application

12.6.10.3 Colombia Software as a Service Market By Enterprise Size

12.6.10.4 Colombia Software as a Service Market By Application

12.6.10.5 Colombia Software as a Service Market, By Industry

12.6.11 Rest of Latin America

12.6.11.1 Rest of Latin America Software as a Service Market By Component

12.6.11.2 Rest of Latin America Software as a Service Market By Deployment Application

12.6.11.3 Rest of Latin America Software as a Service Market By Enterprise Size

12.6.11.4 Rest of Latin America Software as a Service Market By Application

12.6.11.5 Rest of Latin America Software as a Service Market, By Industry

13. Company Profiles

13.1 IBM

13.1.1 Company Overview

13.1.2 Financial

13.1.3 Products/ Deployments Offered

13.1.4 The SNS View

13.2 Alphabet Inc

13.2.1 Company Overview

13.2.2 Financial

13.2.3 Products/ Deployments Offered

13.2.4 The SNS View

13.3 Google LLC

13.3.1 Company Overview

13.3.2 Financial

13.3.3 Products/ Deployments Offered

13.3.4 The SNS View

13.4 Salesforce, Inc.

13.4.1 Company Overview

13.4.2 Financial

13.4.3 Products/ Deployments Offered

13.4.4 The SNS View

13.5 Adobe Inc.

13.5.1 Company Overview

13.5.2 Financial

13.5.3 Products/ Deployments Offered

13.5.4 The SNS View

13.6 Oracle

13.6.1 Company Overview

13.6.2 Financial

13.6.3 Products/ Deployments Offered

13.6.4 The SNS View

13.7 Alibaba Cloud

13.7.1 Company Overview

13.7.2 Financial

13.7.3 Products/ Deployments Offered

13.7.4 The SNS View

13.8 SAP SE

13.8.1 Company Overview

13.8.2 Financial

13.8.3 Products/ Deployments Offered

13.8.4 The SNS View

13.9 Rackspace Technology, Inc.

13.9.1 Company Overview

13.9.2 Financial

13.9.3 Products/ Deployments Offered

13.9.4 The SNS View

13.10 ServiceNow

13.10.1 Company Overview

13.10.2 Financial

13.10.3 Products/ Deployments Offered

13.10.4 The SNS View

14. Competitive Landscape

14.1 Competitive Benchmarking

14.2 Market Share Analysis

14.3 Recent Developments

            14.3.1 Industry News

            14.3.2 Company News

            14.3.3 Mergers & Acquisitions

15. Use Case and Best Practices

16. Conclusion

An accurate research report requires proper strategizing as well as implementation. There are multiple factors involved in the completion of good and accurate research report and selecting the best methodology to compete the research is the toughest part. Since the research reports we provide play a crucial role in any company’s decision-making process, therefore we at SNS Insider always believe that we should choose the best method which gives us results closer to reality. This allows us to reach at a stage wherein we can provide our clients best and accurate investment to output ratio.

Each report that we prepare takes a timeframe of 350-400 business hours for production. Starting from the selection of titles through a couple of in-depth brain storming session to the final QC process before uploading our titles on our website we dedicate around 350 working hours. The titles are selected based on their current market cap and the foreseen CAGR and growth.


The 5 steps process:

Step 1: Secondary Research:

Secondary Research or Desk Research is as the name suggests is a research process wherein, we collect data through the readily available information. In this process we use various paid and unpaid databases which our team has access to and gather data through the same. This includes examining of listed companies’ annual reports, Journals, SEC filling etc. Apart from this our team has access to various associations across the globe across different industries. Lastly, we have exchange relationships with various university as well as individual libraries.

Secondary Research

Step 2: Primary Research

When we talk about primary research, it is a type of study in which the researchers collect relevant data samples directly, rather than relying on previously collected data.  This type of research is focused on gaining content specific facts that can be sued to solve specific problems. Since the collected data is fresh and first hand therefore it makes the study more accurate and genuine.

We at SNS Insider have divided Primary Research into 2 parts.

Part 1 wherein we interview the KOLs of major players as well as the upcoming ones across various geographic regions. This allows us to have their view over the market scenario and acts as an important tool to come closer to the accurate market numbers. As many as 45 paid and unpaid primary interviews are taken from both the demand and supply side of the industry to make sure we land at an accurate judgement and analysis of the market.

This step involves the triangulation of data wherein our team analyses the interview transcripts, online survey responses and observation of on filed participants. The below mentioned chart should give a better understanding of the part 1 of the primary interview.

Primary Research

Part 2: In this part of primary research the data collected via secondary research and the part 1 of the primary research is validated with the interviews from individual consultants and subject matter experts.

Consultants are those set of people who have at least 12 years of experience and expertise within the industry whereas Subject Matter Experts are those with at least 15 years of experience behind their back within the same space. The data with the help of two main processes i.e., FGDs (Focused Group Discussions) and IDs (Individual Discussions). This gives us a 3rd party nonbiased primary view of the market scenario making it a more dependable one while collation of the data pointers.

Step 3: Data Bank Validation

Once all the information is collected via primary and secondary sources, we run that information for data validation. At our intelligence centre our research heads track a lot of information related to the market which includes the quarterly reports, the daily stock prices, and other relevant information. Our data bank server gets updated every fortnight and that is how the information which we collected using our primary and secondary information is revalidated in real time.

Data Bank Validation

Step 4: QA/QC Process

After all the data collection and validation our team does a final level of quality check and quality assurance to get rid of any unwanted or undesired mistakes. This might include but not limited to getting rid of the any typos, duplication of numbers or missing of any important information. The people involved in this process include technical content writers, research heads and graphics people. Once this process is completed the title gets uploader on our platform for our clients to read it.

Step 5: Final QC/QA Process:

This is the last process and comes when the client has ordered the study. In this process a final QA/QC is done before the study is emailed to the client. Since we believe in giving our clients a good experience of our research studies, therefore, to make sure that we do not lack at our end in any way humanly possible we do a final round of quality check and then dispatch the study to the client.

Key Segments:

By Component:

  • Software

  • Services

By Deployment:

  • Public Cloud

  • Private Cloud

  • Hybrid Cloud

By Enterprise-size:

  • Small & Medium Enterprises

  • Large Enterprises

By Application:

  • Customer Relationship Management (CRM)

  • Enterprise Resource Planning (ERP)

  • Human Capital Management

  • Content, Collaboration & Communication

  • BI & Analytics

  • Others

By Industry:

  • Banking, Financial Services & Insurance (BFSI)

  • Retail & Consumer Goods

  • Healthcare

  • Education

  • Manufacturing

  • Travel & Hospitality

  • Others


Request for Segment Customization as per your Business Requirement: Segment Customization Request


REGIONAL COVERAGE:

North America

  • US

  • Canada

  • Mexico

Europe

  • Eastern Europe

    • Poland

    • Romania

    • Hungary

    • Turkey

    • Rest of Eastern Europe

  • Western Europe

    • Germany

    • France

    • UK

    • Italy

    • Spain

    • Netherlands

    • Switzerland

    • Austria

    • Rest of Western Europe

Asia Pacific

  • China

  • India

  • Japan

  • South Korea

  • Vietnam

  • Singapore

  • Australia

  • Rest of Asia Pacific

Middle East & Africa

  • Middle East

    • UAE

    • Egypt

    • Saudi Arabia

    • Qatar

    • Rest of the Middle East

  • Africa

    • Nigeria

    • South Africa

    • Rest of Africa

Latin America

  • Brazil

  • Argentina

  • Colombia

  • Rest of Latin America


Request for Country Level Research Report: Country Level Customization Request

Available Customization

With the given market data, SNS Insider offers customization as per the company’s specific needs. The following customization options are available for the report:

  • Product Analysis

  • Criss-Cross segment analysis (e.g. Product X Application)

  • Product Matrix which gives a detailed comparison of product portfolio of each company

  • Geographic Analysis

  • Additional countries in any of the regions

  • Company Information

  • Detailed analysis and profiling of additional market players (Up to five)


  •            5000 (33% Discount)


  •            8950 (40% Discount)


  •            3050 (23% Discount)

Start a Conversation

Hi! Click one of our member below to chat on Phone