Green Coffee Market Key Insights:
Get More Information on Green Coffee Market - Request Sample Report
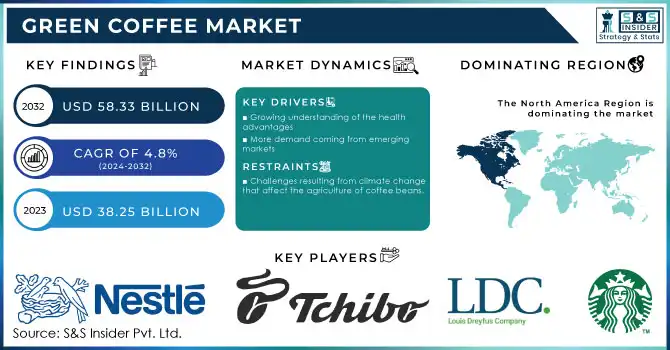
The Green Coffee Market size was valued at USD 38.25 billion in 2023 and is expected to grow to USD 58.33 billion by 2032, at a CAGR of 4.8% over the forecast period of 2024-2032.
The demand for green coffee is anticipated to significantly increase in the future years. The demand for green coffee is rising as a result of its possible health benefits, which include assisting in weight loss and controlling blood pressure and cholesterol levels for diabetic patients.
Green coffee's antioxidants and chromogenic acid levels help to reduce diabetes, obesity, and cardiovascular disorders. Consumers today are gravitating towards healthier choices. Over one billion individuals were fat worldwide, according to a March 2022 World Health Organisation publication. In the upcoming years, it is predicted that 167 million people—adults and children alike—will develop obesity. Additionally, the International Diabetic Federation (IDF) estimates that 537 million people (20-79 years old) will have diabetes. By 2030 and 2045, there will be 643 million and 783 million diabetics worldwide.
As a result, the increased prevalence of various lifestyle issues and the benefits of utilizing green coffee to manage them are some of the key factors projected to fuel market development in the following years.
MARKET DYNAMICS
KEY DRIVERS:
-
Growing understanding of the health advantages:
-
More demand coming from emerging markets:
Coffee beans from emerging economies are becoming more and more popular in the green coffee market. Green coffee beans are in increased demand since more people in these nations are consuming coffee. The chance to sell more beans to these markets is fantastic for coffee enterprises.
RESTRAIN:
-
Challenges resulting from climate change that affect the agriculture of coffee beans.
-
Consumer knowledge of specialty green coffee varietals and their distinctive qualities is limited.
Many customers in the green coffee industry are unfamiliar with specialty coffee kinds and what makes them exceptional. They might not be knowledgeable about the many flavors and characteristics that various coffee beans might provide. Coffee vendors that wish to market their distinctive coffee kinds and inform customers about their remarkable qualities may find it difficult due to this ignorance. It emphasizes the necessity of greater marketing and information to enable customers to recognize the variety and calibre of specialty green coffee.
OPPORTUNITY:
-
Creation of novel products
-
Growing demand from online sources
Online providers are seeing an increase in demand for green coffee. Due to the ease and selection that online shops provide, more and more individuals are purchasing their coffee beans online. This pattern illustrates a change in customer preferences towards green coffee goods purchased online.
CHALLENGES:
-
Absence of scientific support
-
Competition from competing goods
The competition from rival items is a problem in the market for green coffee. Alternative liquids like tea and even soft drinks compete with coffee. Additionally, customers' options for coffee include specialty and instant varieties, which intensifies competition within the coffee industry. To keep their market share, coffee companies must distinguish their goods and marketing approaches.
IMPACT OF RUSSIAN-UKRAINE WAR
The Russian-Ukrainian war may have an impact on the green coffee industry because Ukraine is a nation that cultivates green coffee beans. Due to supply chain disruptions and trade uncertainties, there may be fluctuations in the price and supply of coffee throughout the world, pushing market participants to work through challenges in sourcing and business dealings. The severity of these effects will depend on how long the war lasts and how it affects Ukraine's economy.
Due to the Russia-Ukraine war, the supply chain was disturbed and due to this, the price of commodities has increased including green coffee beans which led to a decrease in sales. The price of green Arabica (unroasted beans) has soared by more than 80% over the past year since practically all supply contracts for coffee are benchmarked to the C price. A 200g jar of coffee costing Rs 280 was raised to Rs 360 by CCL Products, famed for its "Continental" coffee brand, within a year. The price difference between Arabica and Robusta coffees increased by 28.3% to 123.64 US cents/lb in November on the New York and London futures markets.
IMPACT OF ONGOING RECESSION
The green coffee market may be affected in two ways by the prolonged recession. On the one hand, customers could spend less money on expensive coffee and choose less expensive choices. On the other hand, if individuals cut back on dining out, the coffee market may experience a rise in home consumption, perhaps balancing the market dynamics with a shift in demand toward retail sales.
The price of commodities has grown as a result of the recession, including Roasted, Instant/Soluble, and Green Coffee Beans. Unroasted green Arabica bean costs have increased by more than 80%. Futures on Arabica coffee increased by a staggering 73.6%. Additionally, Robusta coffee increased to $2,462. Colombian Mild’s and Other Mild’s, two washed Arabica types, had price increases of 46.1% and 42.2%, respectively. Robusta coffee prices in September 2023 increased 2.1% to $2,691 per tonne by 1433 GMT from a record high of $2,709.
KEY MARKET SEGMENTS
By Type
-
Arabica
-
Robusta
By End Product
-
Roasted Coffee
-
Instant/Soluble Coffee
-
Green Coffee Bean Extract Coffee
By End User
-
General Public
-
Patients of Blood Pressure and Heart Disease
-
Others (Diabetic Patients, Obese people)
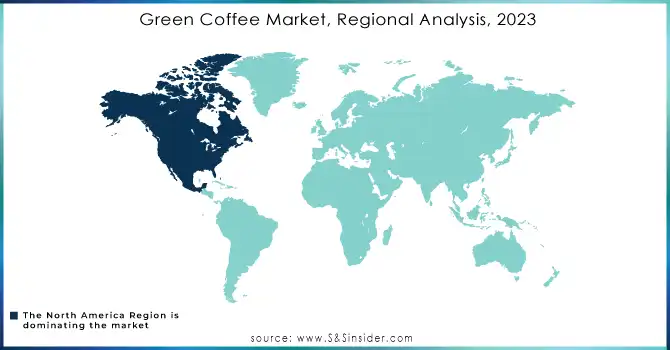
REGIONAL ANALYSIS
North America: North America is the largest consumer of green coffee, accounting for approximately 35% of global consumption. The United States, Canada, and Mexico are the three largest marketplaces in North America. The increased demand for coffee beverages, the expansion of the middle class, and consumers' rising disposable income are driving the growth of the green coffee industry in North America.
Europe: Europe is the second-largest market for green coffee, accounting for around 25% of global consumption. Germany has the largest market in Europe, followed by France and Italy. The demand for green coffee is rising as a result of the European market's strong preference for high-quality, ethically produced coffee.
Asia Pacific: With nearly 20% of the world's demand, Asia Pacific is the third-largest market for green coffee. The demand for green coffee has significantly increased in recent years in the Asia Pacific area, notably in nations like China, South Korea, and Japan. This can be ascribed to the expanding middle class's wealth, shifting lifestyles, and rising interest in sustainable and healthy living.
Need Any Customization Research On Green Coffee Market- Inquiry Now
REGIONAL COVERAGE:
North America
-
US
-
Canada
-
Mexico
Europe
-
Eastern Europe
-
Poland
-
Romania
-
Hungary
-
Turkey
-
Rest of Eastern Europe
-
-
Western Europe
-
Germany
-
France
-
UK
-
Italy
-
Spain
-
Netherlands
-
Switzerland
-
Austria
-
Rest of Western Europe
-
Asia Pacific
-
China
-
India
-
Japan
-
South Korea
-
Vietnam
-
Singapore
-
Australia
-
Rest of Asia Pacific
Middle East & Africa
-
Middle East
-
UAE
-
Egypt
-
Saudi Arabia
-
Qatar
-
Rest of Middle East
-
-
Africa
-
Nigeria
-
South Africa
-
Rest of Africa
-
Latin America
-
Brazil
-
Argentina
-
Colombia
-
Rest of Latin America
Key players:
Some major key players in the Green Coffee Market are Nestle S.A., Tchibo, Louis Dreyfus Company, Belco S.A., Starbucks Corporation, Nordic Approach S.A., Golden Bean Trade, Atlantica Coffee, The Green Coffee Brazil, WS Café and other players.
RECENT DEVELOPMENT
-
Nestle: Nestle said in February 2023 that it will be spending USD 50 million on a new green coffee processing plant in Brazil. The plant will be able to process 50,000 metric tonnes of green coffee annually once it becomes operational in 2025.
-
Starbucks: In January 2023, Starbucks declared that by 2030, it will get all of its coffee from environmentally friendly plantations. As of today, 99% of the company's coffee beans are obtained from farms that adhere to its sustainability requirements, therefore it has already made headway towards achieving this target.
| Report Attributes | Details |
| Market Size in 2023 | US$ 38.25 Bn |
| Market Size by 2032 | US$ 58.33 Bn |
| CAGR | CAGR of 4.8% From 2024 to 2032 |
| Base Year | 2023 |
| Forecast Period | 2024-2032 |
| Historical Data | 2020-2022 |
| Report Scope & Coverage | Market Size, Segments Analysis, Competitive Landscape, Regional Analysis, DROC & SWOT Analysis, Forecast Outlook |
| Key Segments | • By Type (Arabica, Robusta) • By End-product (Roasted, Instant/Soluble, Green Coffee Bean Extract) • By End-user (General Public, Patients of BP) |
| Regional Analysis/Coverage | North America (US, Canada, Mexico), Europe (Eastern Europe [Poland, Romania, Hungary, Turkey, Rest of Eastern Europe] Western Europe] Germany, France, UK, Italy, Spain, Netherlands, Switzerland, Austria, Rest of Western Europe]), Asia Pacific (China, India, Japan, South Korea, Vietnam, Singapore, Australia, Rest of Asia Pacific), Middle East & Africa (Middle East [UAE, Egypt, Saudi Arabia, Qatar, Rest of Middle East], Africa [Nigeria, South Africa, Rest of Africa], Latin America (Brazil, Argentina, Colombia Rest of Latin America) |
| Company Profiles | Nestle S.A., Tchibo, Louis Dreyfus Company, Belco S.A., Starbucks Corporation, Nordic Approach S.A., Golden Bean Trade, Atlantica Coffee, The Green Coffee Brazil, WS Café |
| Key Drivers | • Growing understanding of the health advantages • More demand coming from emerging markets |
| Market Opportunity | • Creation of novel products • Growing demand from online sources |
Get in Touch
