image

Green Water Treatment Chemicals Market Size, Share & Segmentation By Type (Coagulants & Flocculants, Corrosion & Scale Inhibitors, Biocides & Disinfectants, Chelating Agents, and Others), Source (Plant-Based Sources, Animal-Based Sources, and Mineral-Based Sources), Application (Wastewater Treatment, Drinking Water Treatment, Process Water Treatment, and Others), By End-Use Industry (Municipal and Industrial) and Region | Global Forecast for 2025–2032

Date: July 2025 Report Code: SNS/C&M/7823 Page 255

Green Water Treatment Chemicals Market Report Scope & Overview:

The green water treatment chemicals market size was valued at USD 1.61 billion in 2024 and is expected to reach USD 2.86 billion by 2032, growing at a CAGR of 7.44% over the forecast period of 2025-2032.
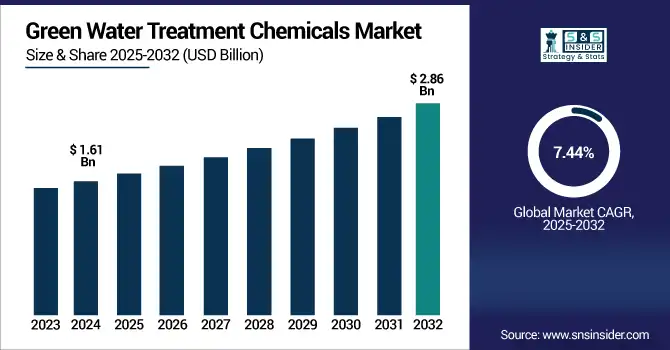
Green water treatment chemicals market analysis indicates that the rising water reuse efforts from both industrial and municipal centers are boosting the market growth. With the increasing scarcity of freshwater resources and the more stringent environmental regulations, industries and municipalities are beginning to use, on a large scale, advanced water recycling and reuse systems in an attempt to decrease water consumption and wastewater disposal. Green water treatment chemicals are biodegradable, non-toxic, and sustainable, which makes them essential for the treatment of reclaimed water without causing harm to ecosystems or human health. The chemicals aid in membrane filtration, biological treatment, and disinfection, and are key in meeting the high-quality recycled water criteria. In addition, the rising urban population with rapid industrial growth creates an urge for effective water reuse, which is anticipated to fuel the demand for environmentally friendly water treatment technology worldwide, which drive the green water treatment chemicals market growth.

The WIFIA loan program of the EPA recently approved USD 268 million to the Hampton Roads Sanitation District for advanced water reuse (SWIFT program) for serving 1.9 million residents via aquifer recharge.

Market Dynamics:

Drivers

  • Stringent Environmental Regulations & Growing Water Reuse Mandates Drives the Market Growth

The growing water scarcity and pollution, stringent water safety, discharge, and reuse standards, especially in the U.S. and Europe, are being implemented by governments around the globe. Industry and municipalities are being forced to greener wastewater solutions due to regulations such as the U.S. EPA's PFAS action plan, Clean Water Act, and National Water Reuse Action Plan (WRAP). Conventional water treatment chemicals, which were used for treating water, were toxic chemicals not biodegradable and are being replaced with green plant-based biodegradable alternatives. Such chemicals are preferred also due to their lower environmental impact, lower toxicity, and can also work well with advanced treatment systems, like membrane filtration and ZLD (Zero Liquid Discharge).

In 2023, the U.S. EPA approved a USD 268 million Water Infrastructure Finance and Innovation Act (WIFIA) Loan to The Hampton Roads Sanitation District for its SWIFT Reuse Project, which uses advanced treatment and a green chemical process to recharge aquifers and reduce pollution

Restrain

  • High Costs & Performance Concerns Compared to Conventional Chemicals May Hamper the Market Growth

Sustainable green water treatment chemicals are more expensive due to their relatively high production costs and limited scale. Most green solutions are either still being developed or have only been introduced to the market in this decade, so they remain more expensive than synthetic alternatives, including biosurfactants, natural coagulants, and enzyme-based treatments. Furthermore, many industrial users are still not convinced that these alternatives actually work, particularly for hard-to-treat highly chemical- or metal-laden wastewaters. The other significant restraint is for adoption in low-cost facilities or developing regions. This is a price-performance barrier. Municipal utilities tend to be smaller with limited budgets and may be reluctant to convert without subsidies or demonstrated cost-benefit information.

Opportunities                                                  

  •  Integration of Smart Dosing Systems & Biotech-Based Green Chemicals Creates an Opportunity in the Market

Smart Sensors, AI-based monitoring, and biotechnology-driven innovations are powering next-gen water treatment. Such technologies facilitate the real-time monitoring of water properties and targeted dosing, which would lead to a reduction in both chemical use and waste. Bio-based polymers, enzymatic treatments, and microbial formulations that provide better treatment efficacy with low environmental impact are now being developed by startups and established firms alike. Additionally, digital water management systems also ensure the optimal usage of green chemicals, lowering operation costs and making sustainable treatment affordable. That not only improves their environmental footprint, but also fits with broader trends of digital transformation for infrastructure and utilities, which drive the green water treatment chemicals market trends.

In 2024, Kurita America joined forces with a biotech startup, Solugen, to develop carbon-negative, AI-enabled platforms for water treatment using bio-based and synthetic-free chemical alternatives to support safer industrial discharge and the circular reuse of water.

Segmentation Analysis:

By Type

Coagulants & Flocculants held the largest green water treatment chemicals market share, around 38%, in 2024. It is owing to their key role in contemporary water treatment technology. These chemicals are necessary for eliminating suspended solids, turbidity, and organic impurities from water in municipal and industrial activities. With increasing environmental concerns and stricter discharge limits, industries and utilities are gradually moving from synthetic formulations to environmentally friendly, biodegradable, and plant-based coagulants such as chitosan, tannin, and starch. These green alternatives not only have comparable performance to metal-based chemicals but also cause less sludge production and secondary pollution.

Corrosion & Scale Inhibitors held a significant green water treatment chemicals market share. It is due to their critical role in maintaining the efficient operation of water systems in industrial, commercial, and municipal facilities. Such inhibitors are an important component of mineral scale formation control, metal surface corrosion prevention, and damage mitigation due to cavitation, the latter resulting in substantial financial losses for operators. Due to the growing regulatory & environmental pressures, there is a clear trend from conventional phosphate-based & toxic formulations toward green alternatives such as biodegradable, non-toxic, and phosphate-free compounds.  

By Source

Plant-Based Sources segment held the largest market share, around 56%, in 2024.  This dominance captures the increasing trend of the global market for natural, renewable, and biodegradable ingredients in water treatment solutions. Plant-based coagulants, flocculants, and other treatment agents are sourced from tannin, starch, and chitosan (from plants and crustacean shells) and are a form of low-toxic, less-sludge production and more effective pollutant removal. They are particularly suited for sensitive ecosystems or applications where eco-compliant discharge is required, like agriculture, food & beverage, and municipal water treatment. And they also suit the trend of sustainable development around the globe and enable industries to comply with stringent environmental regulations while operating the water treatment plants effectively.

Mineral-Based Sources has a significant market share in the green water treatment chemicals market. It is due to its efficiency, stability, and broad spectrum of applicability to different water treatment processes. These minerals (zeolites, clays, natural oxides) are applied as eco-friendly alternative sources for synthetic chemicals for coagulation, adsorption, and pH adjustment. They also represent an ideal choice for the treatment of water from municipal, industrial, or agricultural sources due to their capacity to remove heavy metals, organic pollutants, and suspended solids efficiently with relatively low toxicity and environmental impact. Mineral-based solutions are available at no cost in nature, are less expensive than common synthetic chemicals, and are safer for aquatic ecosystems than the most common synthetic chemicals.

By Application

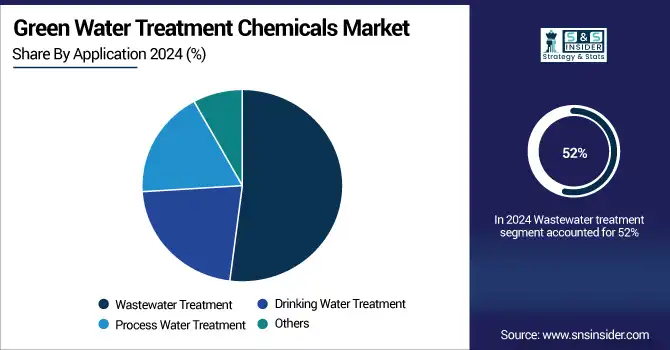
Wastewater treatment held the largest market share, around 52%, in 2024. It is due to the necessity for sustainable and eco-friendly disposal of the increasing volume of industrial and municipal wastewater. A growing number of industrial processes require water, with water scarcity growing throughout the world and discharge limitations being implemented globally, reuse and economically suitable treatment of wastewater have become a high priority for industries and governments. Pollutant removal is a large part of this process, and green water treatment chemicals–namely, biodegradable coagulants, natural flocculants, and non-toxic biocides–help to make this process efficient and effective, while not leaving harmful residues in ecosystems from chemical treatment.

Drinking held a significant market share in the green water treatment chemicals market. It is due to soaring concern about water quality and public health, coupled with the environmental consequences of conventional chemical treatments. With growing demand for safe and sustainable approaches to potable water, utilities are switching to green, non-toxic, biodegradable, and non-toxic residues from treatment chemicals. They comprise natural coagulants, plant-based disinfectants, and mineral-based pH stabilizers for effective purification with low human health and environmental risk.

By End-Use Industry

Municipal held the largest market share, around 68%, in 2024. It is owing to the increasing commitment of cities and local governments toward sustainable water treatment practices. Municipalities must treat large amounts of water for drinking and wastewater, and the transition to environmentally sustainable, non-toxic, and biodegradable chemicals is being driven by more stringent environmental regulations, public health issues, and environmental awareness of water pollution. Urban systems are best treated with green chemicals where they provide appropriate effectiveness, accompanied by minimal harmful by-products, sludge generation, and ecotoxicity. Demand for green solutions is also being fueled by investments in wastewater recycling, decentralized treatment, and water reuse programs.

Industrial held a significant market share in the green water treatment chemicals market. It is due to the increasing demand for sustainable water management, even within building and construction processes, especially in manufacturing, power generation, oil & gas, food processing, and chemical industries. Industries produce huge amounts of complicated wastewater, having heavy metals, organic pollutants, and chemicals that need appropriate as well as eco-friendly treatment. As stricter regulations coupled with growing ESG commitments and the step-up towards circular water use are increasing the demand for green water treatment chemicals- biodegradable scale inhibitors, non-toxic biocides, plant-based coagulants, etc., the market is witnessing a conspicuous shift.

Regional Analysis:

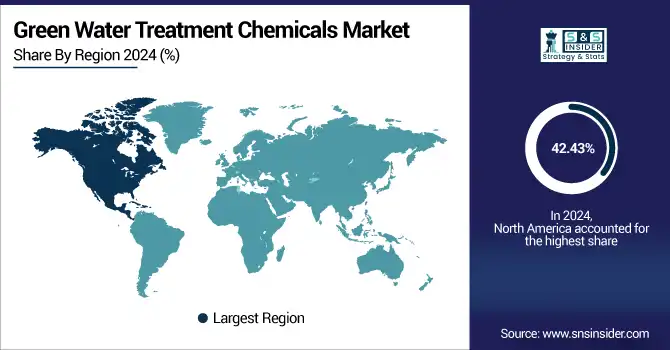
North America green water treatment chemicals market held the largest market share, around 42.43%, in 2024. It is owing to strict environmental regulations, rising awareness of water contamination among consumers, and governmental support for infrastructure development. Regulatory tools, like the Clean Water Act and the Safe Drinking Water Act, and more recent PFAS restrictions, have forced both municipal and industrial facilities to transition to sustainable and non-toxic chemical alternatives. Programs like the EPA’s WIFIA loans have provided big funding boosts to the region for large projects to redevelop ageing water infrastructure. This has attracted key market players, including SNF, Ecolab, and Kurita, to broaden their green chemical offerings.

In 2024, the introduction of the new “GreenFloc” coagulants from SNF, which they state are made from renewable resources and tailored for North American water treatment facilities, embodies the company's environmental focus.

The U.S. green water treatment chemicals market size was USD 504 million in 2024 and is expected to reach USD 904 million by 2032 and grow at a CAGR of 7.57% over the forecast period of 2025-2032. The US is spearheading the shift toward green water treatment chemicals through bold federal initiatives coupled with local mandates. In 2024, the EPA made history when it imposed near-zero limits on that class of chemicals in drinking water, essentially requiring water utilities to improve their treatment processes and stop using harmful chemicals altogether. US facilities are beginning to replace these with biodegradable coagulants, scale inhibitors and other bio-based substitutes, supported by fed funding and increasing ESG pledges from the private sector. Such transformations have provided impetus for innovation and rapid uptake of green solutions in all sectors.

Asia Pacific green water treatment chemicals market held a significant market share and is the fastest-growing segment in the forecast period. It is due to the speed at which industrialization and urban development has occurred, particularly China and India, and the governments addressing this by enforcing stricter environmental legislation and encouraging green water treatment methods. Increasing water reuse in municipal and industrial settings are driving more interest in biodegradable and plant-derived products. As this demand increases, regional manufacturers, as well as global manufacturers, are ramping up production and partnerships in the area. Asia Pacific countries have also announced billions of investments in water infrastructure, following the example of the US, and plans focus on green technologies to tackle increasing pressures of water stress and pollution.

Europe held a significant market share in the forecast period. It is because of the strong historical basis for protecting the environment and not polluting water and air. The recently reformed Urban Waste Water Directive from the European Union requires the removal of micropollutants, including pharmaceuticals and PFAS, leading to a wave of demand for advanced, green treatment chemicals. To comply with these new standards, countries such as Germany, the Netherlands, and Sweden are investing in next-generation treatment facilities utilizing plant-based, biodegradable chemicals. The market share in Europe gets a further boost by launching special green products focusing on the regulations; Veolia, BASF are the key players in this region.
Key Players:

The major green water treatment chemicals companies are Kemira, Veolia, Ecolab, Solenis, BASF SE, Kurita Water Industries, SNF Group, Clariant, Thermax, and Nouryon.

Recent Development:

  • In May 2024, Kurita Water Industries established Kurita AquaChemie India Pvt. AMListings with Flipo and Audio Systems Pvt. This is a part of Kurita's creating shared value global strategy, and will directly supply industrial and municipal customers with water treatment chemicals, including green, biodegradable solutions.
  • In July 2024, Kurita America & Solugen partnered to produce industrial water treatment products that are carbon-negative. The new Tower NG series replaces conventional phosphorus and petroleum-derived additives with biodegradable corrosion inhibitors and polymers to balance high performance with sustainability.

Green Water Treatment Chemicals Market Report Scope

Report Attributes Details
Market Size in 2024 USD1.61 Billion 
Market Size by 2032 USD 2.86 Billion 
CAGR CAGR of7.44% From 2025 to 2032
Base Year 2024
Forecast Period 2025-2032
Historical Data 2021-2023
Report Scope & Coverage Market Size, Segments Analysis, Competitive Landscape, Regional Analysis, DROC & SWOT Analysis, Forecast Outlook
Key Segments • By Type (Coagulants & Flocculants, Corrosion & Scale Inhibitors, Biocides & Disinfectants, Chelating Agents, and Others)
• By Source (Plant-Based Sources, Animal-Based Sources, and Mineral-Based Sources),
• By Application (Wastewater Treatment, Drinking Water Treatment, Process Water Treatment, and Others)
• By End-Use Industry (Municipal, and Industrial) 
Regional Analysis/Coverage North America (US, Canada, Mexico), Europe (Germany, France, UK, Italy, Spain, Poland, Turkey, Rest of Europe), Asia Pacific (China, India, Japan, South Korea, Singapore, Australia, Rest of Asia Pacific), Middle East & Africa (UAE, Saudi Arabia, Qatar, South Africa, Rest of Middle East & Africa), Latin America (Brazil, Argentina, Rest of Latin America)
Company Profiles Kemira, Veolia, Ecolab, Solenis, BASF SE, Kurita Water Industries, SNF Group, Clariant, Thermax, and Nouryon

Frequently Asked Questions

Ans The market was valued at USD 1.61 billion in 2024 and is projected to grow at a CAGR of around 7.44% from 2025 to 2032.

Ans Wastewater Treatment application dominated the green water treatment chemical market.

Ans: Stringent Environmental Regulations & Growing Water Reuse Mandates Drive the Market Growth.

Ans North America held the largest market share, driven by large-scale installations and manufacturing capacity.

Ans: High costs & performance concerns compared to conventional chemicals may hamper the market growth.

Table Of Content

1. Introduction

1.1 Market Definition

1.2 Scope (Inclusion and Exclusions)

1.3 Research Assumptions

2. Executive Summary

2.1 Market Overview

2.2 Regional Synopsis

2.3 Competitive Summary

3. Research Methodology

3.1 Top-Down Approach

3.2 Bottom-up Approach

3.3. Data Validation

3.4 Primary Interviews

4. Market Dynamics Impact Analysis

4.1 Market Driving Factors Analysis

4.1.1 Drivers

4.1.2 Restraints

4.1.3 Opportunities

4.1.4 Challenges

4.2 PESTLE Analysis

4.3 Porter’s Five Forces Model

5. Statistical Insights and Trends Reporting

 5.1 Production Capacity and Utilization by Country, By Derivative, 2024

 5.2 Feedstock Prices by Country and Type, 2024

 5.3   Regulatory Impact by Country and By Derivative 2024.

 5.4 Environmental Metrics: Emissions Data, Waste Management Practices, and     Sustainability Initiatives by Region

 5.5 Innovation and R&D, Type, 2024

6. Competitive Landscape

6.1 List of Major Companies By Region

6.2 Market Share Analysis By Region

6.3 Product Benchmarking

6.3.1 Product specifications and features

6.3.2 Pricing

6.4 Strategic Initiatives

6.4.1 Marketing and promotional activities

6.4.2 Distribution and Supply Chain Strategies

6.4.3 Expansion plans and new product launches

6.4.4 Strategic partnerships and collaborations

6.5 Technological Advancements

6.6 Market Positioning and Branding

7. Green Water Treatment Chemicals Market Segmentation By Type

7.1 Chapter Overview

7.2 Coagulants & Flocculants

7.2.1 Coagulants & Flocculants Market Trends Analysis (2021-2032)

7.2.2 Coagulants & Flocculants Market Size Estimates and Forecasts to 2032 (USD Billion)

7.3 Corrosion & Scale Inhibitors

7.3.1 Corrosion & Scale Inhibitors Market Trends Analysis (2021-2032)

7.3.2 Corrosion & Scale Inhibitors Market Size Estimates and Forecasts to 2032 (USD Billion)

7.4 Biocides & Disinfectants

7.4.1 Biocides & Disinfectants Market Trends Analysis (2021-2032)

7.4.2 Biocides & Disinfectants Market Size Estimates and Forecasts to 2032 (USD Billion)

7.5 Chelating Agents

7.5.1 Chelating Agents Market Trends Analysis (2021-2032)

7.5.2 Chelating Agents Market Size Estimates and Forecasts to 2032 (USD Billion)

7.6 Others

7.6.1 Others Market Trends Analysis (2021-2032)

7.6.2 Others Market Size Estimates and Forecasts to 2032 (USD Billion)

8. Green Water Treatment Chemicals Market Segmentation By Source

8.1 Chapter Overview

8.2 Plant-Based Sources

8.2.1 Plant-Based Sources Market Trends Analysis (2021-2032)

8.2.2 Plant-Based Sources Market Size Estimates and Forecasts to 2032 (USD Billion)

8.3 Animal-Based Sources

        8.3.1 Animal-Based Sources Market Trends Analysis (2021-2032)

8.3.2 Animal-Based Sources Market Size Estimates and Forecasts to 2032 (USD Billion)

8.4 Mineral-Based Sources

         8.4.1 Mineral-Based Sources Market Trends Analysis (2021-2032)

8.4.2 Mineral-Based Sources Market Size Estimates and Forecasts to 2032 (USD Billion)

9. Green Water Treatment Chemicals Market Segmentation By Application

9.1 Chapter Overview

9.2 Wastewater Treatment

9.2.1 Wastewater Treatment Market Trends Analysis (2021-2032)

9.2.2 Wastewater Treatment Market Size Estimates and Forecasts to 2032 (USD Billion)

9.3 Drinking Water Treatment

9.3.1 Drinking Water Treatment Market Trends Analysis (2021-2032)

9.3.2 Drinking Water Treatment Market Size Estimates and Forecasts to 2032 (USD Billion)

9.4 Process Water Treatment

9.4.1 Process Water Treatment Market Trends Analysis (2021-2032)

9.4.2 Process Water Treatment Market Size Estimates and Forecasts to 2032 (USD Billion)

9.5 Other

9.5.1 Other Market Trends Analysis (2021-2032)

9.5.2 Other Market Size Estimates and Forecasts to 2032 (USD Billion)

10. Green Water Treatment Chemicals Market Segmentation by End-Use Industry

10.1 Chapter Overview

10.2 Municipal

10.2.1 Municipal Market Trends Analysis (2021-2032)

10.2.2 Municipal Market Size Estimates and Forecasts to 2032 (USD Billion)

10.3 Industrial

10.3.1 Industrial Market Trend Analysis (2021-2032)

10.3.2 Industrial Market Size Estimates and Forecasts to 2032 (USD Billion)

11. Regional Analysis

11.1 Chapter Overview

11.2 North America

11.2.1 Trend Analysis

11.2.2 North America Green Water Treatment Chemicals Market Estimates and Forecasts by Country (2021-2032) (USD Billion)

11.2.3 North America Green Water Treatment Chemicals Market Estimates and Forecasts By Type (2021-2032) (USD Billion) 

11.2.4 North America Green Water Treatment Chemicals Market Estimates and Forecasts By Source (2021-2032) (USD Billion)

11.2.5 North America Green Water Treatment Chemicals Market Estimates and Forecasts By Application (2021-2032) (USD Billion)

11.2.6 North America Green Water Treatment Chemicals Market Estimates and Forecasts by End-Use Industry (2021-2032) (USD Billion)

11.2.7 USA

11.2.7.1 USA Green Water Treatment Chemicals Market Estimates and Forecasts By Type (2021-2032) (USD Billion)

11.2.7.2 USA Green Water Treatment Chemicals Market Estimates and Forecasts By Source (2021-2032) (USD Billion)

11.2.7.3 USA Green Water Treatment Chemicals Market Estimates and Forecasts By Application (2021-2032) (USD Billion)

11.2.7.4 USA Green Water Treatment Chemicals Market Estimates and Forecasts by End-Use Industry (2021-2032) (USD Billion)

11.2.8 Canada

11.2.8.1 Canada Green Water Treatment Chemicals Market Estimates and Forecasts By Type (2021-2032) (USD Billion)

11.2.8.2 Canada Green Water Treatment Chemicals Market Estimates and Forecasts By Source (2021-2032) (USD Billion)

11.2.8.3 Canada Green Water Treatment Chemicals Market Estimates and Forecasts By Application (2021-2032) (USD Billion)

11.2.8.4 Canada Green Water Treatment Chemicals Market Estimates and Forecasts by End-Use Industry (2021-2032) (USD Billion)

11.2.9 Mexico

11.2.9.1 Mexico Green Water Treatment Chemicals Market Estimates and Forecasts By Type (2021-2032) (USD Billion)

11.2.9.2 Mexico Green Water Treatment Chemicals Market Estimates and Forecasts By Source (2021-2032) (USD Billion)

11.2.9.3 Mexico Green Water Treatment Chemicals Market Estimates and Forecasts By Application (2021-2032) (USD Billion)

11.2.9.4 Mexico Green Water Treatment Chemicals Market Estimates and Forecasts by End-Use Industry (2021-2032) (USD Billion)

11.3 Europe

11.3.1 Trend Analysis

11.3.2 Europe Green Water Treatment Chemicals Market Estimates and Forecasts by Country (2021-2032) (USD Billion)

11.3.3 Europe Green Water Treatment Chemicals Market Estimates and Forecasts By Type (2021-2032) (USD Billion) 

11.3.4 Europe Green Water Treatment Chemicals Market Estimates and Forecasts By Source (2021-2032) (USD Billion)

11.3.5 Europe Green Water Treatment Chemicals Market Estimates and Forecasts By Application (2021-2032) (USD Billion)

11.3.6 Europe Green Water Treatment Chemicals Market Estimates and Forecasts by End-Use Industry (2021-2032) (USD Billion)

11.3.7 Germany

11.3.7.1 Germany Green Water Treatment Chemicals Market Estimates and Forecasts By Type (2021-2032) (USD Billion)

11.3.7.2 Germany Green Water Treatment Chemicals Market Estimates and Forecasts By Source (2021-2032) (USD Billion)

11.3.7.3 Germany Green Water Treatment Chemicals Market Estimates and Forecasts By Application (2021-2032) (USD Billion)

11.3.7.4 Germany Green Water Treatment Chemicals Market Estimates and Forecasts by End-Use Industry (2021-2032) (USD Billion)

11.3.8 France

11.3.8.1 France Green Water Treatment Chemicals Market Estimates and Forecasts By Type (2021-2032) (USD Billion)

11.3.8.2 France Green Water Treatment Chemicals Market Estimates and Forecasts By Source (2021-2032) (USD Billion)

11.3.8.3 France Green Water Treatment Chemicals Market Estimates and Forecasts By Application (2021-2032) (USD Billion)

11.3.8.4 France Green Water Treatment Chemicals Market Estimates and Forecasts by End-Use Industry (2021-2032) (USD Billion)

11.3.9 UK

11.3.9.1 UK Green Water Treatment Chemicals Market Estimates and Forecasts By Type (2021-2032) (USD Billion)

11.3.9.2 UK Green Water Treatment Chemicals Market Estimates and Forecasts By Source (2021-2032) (USD Billion)

11.3.9.3 UK Green Water Treatment Chemicals Market Estimates and Forecasts By Application (2021-2032) (USD Billion)

11.3.9.4 UK Green Water Treatment Chemicals Market Estimates and Forecasts by End-Use Industry  (2021-2032) (USD Billion)

11.3.10 Italy

11.3.10.1 ItalyGreen Water Treatment Chemicals Market Estimates and Forecasts By Type (2021-2032) (USD Billion)

11.3.10.2 Italy Green Water Treatment Chemicals Market Estimates and Forecasts By Source (2021-2032) (USD Billion)

11.3.10.3 Italy Green Water Treatment Chemicals Market Estimates and Forecasts By Application (2021-2032) (USD Billion)

11.3.10.4 Italy Green Water Treatment Chemicals Market Estimates and Forecasts by End-Use Industry (2021-2032) (USD Billion)

11.3.11 Spain

11.3.11.1 Spain Green Water Treatment Chemicals Market Estimates and Forecasts By Type (2021-2032) (USD Billion)

11.3.11.2 Spain Green Water Treatment Chemicals Market Estimates and Forecasts By Source (2021-2032) (USD Billion)

11.3.11.3 Spain Green Water Treatment Chemicals Market Estimates and Forecasts By Application (2021-2032) (USD Billion)

11.3.11.4 Spain Green Water Treatment Chemicals Market Estimates and Forecasts by End-Use Industry (2021-2032) (USD Billion)

11.3.12 Poland

11.3.12.1 Poland Green Water Treatment Chemicals Market Estimates and Forecasts By Type (2021-2032) (USD Billion)

11.3.12.2 Poland Green Water Treatment Chemicals Market Estimates and Forecasts By Source (2021-2032) (USD Billion)

11.3.12.3 Poland Green Water Treatment Chemicals Market Estimates and Forecasts By Application (2021-2032) (USD Billion)

11.3.12.4 Poland Green Water Treatment Chemicals Market Estimates and Forecasts by End-Use Industry (2021-2032) (USD Billion)

11.3.13 Turkey

11.3.13.1 Turkey Green Water Treatment Chemicals Market Estimates and Forecasts By Type (2021-2032) (USD Billion)

11.3.13.2 Turkey Green Water Treatment Chemicals Market Estimates and Forecasts By Source (2021-2032) (USD Billion)

11.3.13.3 Turkey Green Water Treatment Chemicals Market Estimates and Forecasts By Application (2021-2032) (USD Billion)

11.3.13.4 Turkey Green Water Treatment Chemicals Market Estimates and Forecasts by End-Use Industry (2021-2032) (USD Billion)

11.3.14 Rest of Europe

11.3.14.1 Rest of Europe Green Water Treatment Chemicals Market Estimates and Forecasts By Type (2021-2032) (USD Billion)

11.3.14.2 Rest of Europe Green Water Treatment Chemicals Market Estimates and Forecasts By Source (2021-2032) (USD Billion)

11.3.14.3 Rest of Europe Green Water Treatment Chemicals Market Estimates and Forecasts By Application (2021-2032) (USD Billion)

11.3.14.4 Rest of Europe Green Water Treatment Chemicals Market Estimates and Forecasts by End-Use Industry (2021-2032) (USD Billion)

11.4 Asia Pacific

11.4.1 Trend Analysis

11.4.2 Asia Pacific Green Water Treatment Chemicals Market Estimates and Forecasts by Country (2021-2032) (USD Billion)

11.4.3 Asia Pacific Green Water Treatment Chemicals Market Estimates and Forecasts By Type (2021-2032) (USD Billion) 

11.4.4 Asia Pacific Green Water Treatment Chemicals Market Estimates and Forecasts By Source (2021-2032) (USD Billion)

11.4.5 Asia Pacific Green Water Treatment Chemicals Market Estimates and Forecasts By Application (2021-2032) (USD Billion)

11.4.6 Asia Pacific Green Water Treatment Chemicals Market Estimates and Forecasts by End-Use Industry (2021-2032) (USD Billion)

11.4.7 China

11.4.7.1 China Green Water Treatment Chemicals Market Estimates and Forecasts By Type (2021-2032) (USD Billion)

11.4.7.2 China Green Water Treatment Chemicals Market Estimates and Forecasts By Source (2021-2032) (USD Billion)

11.4.7.3 China Green Water Treatment Chemicals Market Estimates and Forecasts By Application (2021-2032) (USD Billion)

11.4.7.4 China Green Water Treatment Chemicals Market Estimates and Forecasts by End-Use Industry (2021-2032) (USD Billion)

11.4.8 India

11.4.8.1 India Green Water Treatment Chemicals Market Estimates and Forecasts By Type (2021-2032) (USD Billion)

11.4.8.2 India Green Water Treatment Chemicals Market Estimates and Forecasts By Source (2021-2032) (USD Billion)

11.4.8.3 India Green Water Treatment Chemicals Market Estimates and Forecasts By Application (2021-2032) (USD Billion)

11.4.8.4 India Green Water Treatment Chemicals Market Estimates and Forecasts by End-Use Industry (2021-2032) (USD Billion)

11.4.9 Japan

11.4.9.1 Japan Green Water Treatment Chemicals Market Estimates and Forecasts By Type (2021-2032) (USD Billion)

11.4.9.2 Japan Green Water Treatment Chemicals Market Estimates and Forecasts By Source (2021-2032) (USD Billion)

11.4.9.3 Japan Green Water Treatment Chemicals Market Estimates and Forecasts By Application (2021-2032) (USD Billion)

11.4.9.4 Japan Green Water Treatment Chemicals Market Estimates and Forecasts by End-Use Industry (2021-2032) (USD Billion)

11.4.10 South Korea

11.4.10.1 South Korea Green Water Treatment Chemicals Market Estimates and Forecasts By Type (2021-2032) (USD Billion)

11.4.10.2 South Korea Green Water Treatment Chemicals Market Estimates and Forecasts By Source (2021-2032) (USD Billion)

11.4.10.3 South Korea Green Water Treatment Chemicals Market Estimates and Forecasts By Application (2021-2032) (USD Billion)

11.4.10.4 South Korea Green Water Treatment Chemicals Market Estimates and Forecasts by End-Use Industry (2021-2032) (USD Billion)

11.4.11 Singapore

11.4.11.1 Singapore Green Water Treatment Chemicals Market Estimates and Forecasts By Type (2021-2032) (USD Billion)

11.4.11.2 Singapore Green Water Treatment Chemicals Market Estimates and Forecasts By Source (2021-2032) (USD Billion)

11.4.11.3 Singapore Green Water Treatment Chemicals Market Estimates and Forecasts By Application (2021-2032) (USD Billion)

11.4.11.4 Singapore Green Water Treatment Chemicals Market Estimates and Forecasts by End-Use Industry (2021-2032) (USD Billion)

11.4.12 Australia

11.4.12.1 Australia Green Water Treatment Chemicals Market Estimates and Forecasts By Type (2021-2032) (USD Billion)

11.4.12.2 Australia Green Water Treatment Chemicals Market Estimates and Forecasts By Source (2021-2032) (USD Billion)

11.4.12.3 Australia Green Water Treatment Chemicals Market Estimates and Forecasts By Application (2021-2032) (USD Billion)

11.4.12.4 Australia Green Water Treatment Chemicals Market Estimates and Forecasts by End-Use Industry (2021-2032) (USD Billion)

11.4.13 Rest of Asia Pacific

11.4.13.1 Rest of Asia Pacific Green Water Treatment Chemicals Market Estimates and Forecasts By Type (2021-2032) (USD Billion)

11.4.13.2 Rest of Asia Pacific Green Water Treatment Chemicals Market Estimates and Forecasts By Source (2021-2032) (USD Billion)

11.4.13.3 Rest of Asia Pacific Green Water Treatment Chemicals Market Estimates and Forecasts By Application (2021-2032) (USD Billion)

11.4.13.4 Rest of Asia Pacific Green Water Treatment Chemicals Market Estimates and Forecasts by End-Use Industry (2021-2032) (USD Billion)

11.5 Middle East and Africa

11.5.1 Trend Analysis

11.5.2 Middle East and Africa Green Water Treatment Chemicals Market Estimates and Forecasts by Country (2021-2032) (USD Billion)

11.5.3 Middle East and Africa Green Water Treatment Chemicals Market Estimates and Forecasts By Type (2021-2032) (USD Billion) 

11.5.4 Middle East and Africa Green Water Treatment Chemicals Market Estimates and Forecasts By Source (2021-2032) (USD Billion)

11.5.5 Middle East and Africa Green Water Treatment Chemicals Market Estimates and Forecasts By Application (2021-2032) (USD Billion)

11.5.6 Middle East and Africa Green Water Treatment Chemicals Market Estimates and Forecasts by End-Use Industry (2021-2032) (USD Billion)

11.5.7 UAE

11.5.7.1 UAE Green Water Treatment Chemicals Market Estimates and Forecasts By Type (2021-2032) (USD Billion)

11.5.7.2 UAE Green Water Treatment Chemicals Market Estimates and Forecasts By Source (2021-2032) (USD Billion)

11.5.7.3 UAE Green Water Treatment Chemicals Market Estimates and Forecasts By Application (2021-2032) (USD Billion)

11.5.7.4 UAE Green Water Treatment Chemicals Market Estimates and Forecasts by End-Use Industry (2021-2032) (USD Billion)

11.5.8 Saudi Arabia

11.5.8.1 Saudi Arabia Green Water Treatment Chemicals Market Estimates and Forecasts By Type (2021-2032) (USD Billion)

11.5.8.2 Saudi Arabia Green Water Treatment Chemicals Market Estimates and Forecasts By Source (2021-2032) (USD Billion)

11.5.8.3 Saudi Arabia Green Water Treatment Chemicals Market Estimates and Forecasts By Application (2021-2032) (USD Billion)

11.5.8.4 Saudi Arabia Green Water Treatment Chemicals Market Estimates and Forecasts by End-Use Industry (2021-2032) (USD Billion)

11.5.9 Qatar

                     11.5.9.1 Qatar Green Water Treatment Chemicals Market Estimates and Forecasts By Type (2021-2032) (USD Billion)

11.5.9.2 Qatar Green Water Treatment Chemicals Market Estimates and Forecasts By Source (2021-2032) (USD Billion)

11.5.9.3 Qatar Green Water Treatment Chemicals Market Estimates and Forecasts By Application (2021-2032) (USD Billion)

11.5.1.9.4 Qatar Green Water Treatment Chemicals Market Estimates and Forecasts by End-Use Industry (2021-2032) (USD Billion)

11.5.10   South Africa

11.5.10.1 South Africa Green Water Treatment Chemicals Market Estimates and Forecasts By Type (2021-2032) (USD Billion)

11.5.10.2 South Africa Green Water Treatment Chemicals Market Estimates and Forecasts By Source (2021-2032) (USD Billion)

11.5.10.3 South Africa Green Water Treatment Chemicals Market Estimates and Forecasts By Application (2021-2032) (USD Billion)

11.5.10.4 South Africa Green Water Treatment Chemicals Market Estimates and Forecasts by End-Use Industry (2021-2032) (USD Billion)

11.5.11 Rest of Middle East & Africa

                    11.5.11.1 Rest of Middle East & Africa Green Water Treatment Chemicals Market Estimates and Forecasts By Type (2021-2032) (USD Billion)

11.5.11.2 Rest of Middle East & Africa  Green Water Treatment Chemicals Market Estimates and Forecasts By Source (2021-2032) (USD Billion)

11.5.11.3 Rest of Middle East & Africa Green Water Treatment Chemicals Market Estimates and Forecasts By Application (2021-2032) (USD Billion)

11.5.11.4 Rest of Middle East & Africa Green Water Treatment Chemicals Market Estimates and Forecasts by End-Use Industry (2021-2032) (USD Billion)

11.6 Latin America

11.6.1 Trend Analysis

11.6.2 Latin America Green Water Treatment Chemicals Market Estimates and Forecasts by Country (2021-2032) (USD Billion)

11.6.3 Latin America Green Water Treatment Chemicals Market Estimates and Forecasts By Type (2021-2032) (USD Billion) 

11.6.4 Latin America Green Water Treatment Chemicals Market Estimates and Forecasts By Source (2021-2032) (USD Billion)

11.6.5 Latin America Green Water Treatment Chemicals Market Estimates and Forecasts By Application (2021-2032) (USD Billion)

11.6.6 Latin America Green Water Treatment Chemicals Market Estimates and Forecasts by End-Use Industry (2021-2032) (USD Billion)

11.6.7 Brazil

11.6.7.1 Brazil Green Water Treatment Chemicals Market Estimates and Forecasts By Type (2021-2032) (USD Billion)

11.6.7.2 Brazil Green Water Treatment Chemicals Market Estimates and Forecasts By Source (2021-2032) (USD Billion)

11.6.7.3 Brazil Green Water Treatment Chemicals Market Estimates and Forecasts By Application (2021-2032) (USD Billion)

11.6.7.4 Brazil Green Water Treatment Chemicals Market Estimates and Forecasts by End-Use Industry (2021-2032) (USD Billion)

11.6.8 Argentina

11.6.8.1 Argentina Green Water Treatment Chemicals Market Estimates and Forecasts By Type (2021-2032) (USD Billion)

11.6.8.2 Argentina Green Water Treatment Chemicals Market Estimates and Forecasts By Source (2021-2032) (USD Billion)

11.6.8.3 Argentina Green Water Treatment Chemicals Market Estimates and Forecasts By Application (2021-2032) (USD Billion)

11.6.8.4 Argentina Green Water Treatment Chemicals Market Estimates and Forecasts by End-Use Industry (2021-2032) (USD Billion)

11.6.9 Rest of Latin America

11.6.9.1 Rest of Latin America Green Water Treatment Chemicals Market Estimates and Forecasts By Type (2021-2032) (USD Billion)

11.6.9.2 Rest of Latin America Green Water Treatment Chemicals Market Estimates and Forecasts By Source (2021-2032) (USD Billion)

11.6.9.3 Rest of Latin America Green Water Treatment Chemicals Market Estimates and Forecasts By Application (2021-2032) (USD Billion)

11.6.9.4 Rest of Latin America Green Water Treatment Chemicals Market Estimates and Forecasts by End-Use Industry (2021-2032) (USD Billion)

12. Company Profiles

12.1 Kemira

          12.1.1 Company Overview

12.1.2 Financial

12.1.3 Products/ Services Offered

12.1.4 SWOT Analysis

12.2 Veolia

           12.2.1 Company Overview

12.2.2 Financial

12.2.3 Products/ Services Offered

12.2.4 SWOT Analysis

12.3 Ecolab          

          12.3.1 Company Overview

12.3.2 Financial

12.3.3 Products/ Services Offered

12.3.4 SWOT Analysis

12.4 Solenis

          12.4.1 Company Overview

12.4.2 Financial

12.4.3 Products/ Services Offered

12.4.4 SWOT Analysis

12.5 BASF SE

          12.5.1 Company Overview

12.5.2 Financial

12.5.3 Products/ Services Offered

12.5.4 SWOT Analysis

12.6 Kurita Water Industries

            12.6.1 Company Overview

12.6.2 Financial

12.6.3 Products/ Services Offered

12.6.4 SWOT Analysis

12.7 SNF Group

          12.7.1 Company Overview

12.7.2 Financial

12.7.3 Products/ Services Offered

12.7.4 SWOT Analysis

12.8 Clariant

12.8.1 Company Overview

12.8.2 Financial

12.8.3 Products/ Services Offered

12.8.4 SWOT Analysis

12.9 Thermax

12.9.1 Company Overview

12.9.2 Financial

12.9.3 Products/ Services Offered

12.9.4 SWOT Analysis

12.10 Nouryon

12.10.1 Company Overview

12.10.2 Financial

12.10.3 Products/ Services Offered

12.10.4 SWOT Analysis

13. Use Cases and Best Practices

14. Conclusion

An accurate research report requires proper strategizing as well as implementation. There are multiple factors involved in the completion of good and accurate research report and selecting the best methodology to compete the research is the toughest part. Since the research reports we provide play a crucial role in any company’s decision-making process, therefore we at SNS Insider always believe that we should choose the best method which gives us results closer to reality. This allows us to reach at a stage wherein we can provide our clients best and accurate investment to output ratio.

Each report that we prepare takes a timeframe of 350-400 business hours for production. Starting from the selection of titles through a couple of in-depth brain storming session to the final QC process before uploading our titles on our website we dedicate around 350 working hours. The titles are selected based on their current market cap and the foreseen CAGR and growth.


The 5 steps process:

Step 1: Secondary Research:

Secondary Research or Desk Research is as the name suggests is a research process wherein, we collect data through the readily available information. In this process we use various paid and unpaid databases which our team has access to and gather data through the same. This includes examining of listed companies’ annual reports, Journals, SEC filling etc. Apart from this our team has access to various associations across the globe across different industries. Lastly, we have exchange relationships with various university as well as individual libraries.

Secondary Research

Step 2: Primary Research

When we talk about primary research, it is a type of study in which the researchers collect relevant data samples directly, rather than relying on previously collected data.  This type of research is focused on gaining content specific facts that can be sued to solve specific problems. Since the collected data is fresh and first hand therefore it makes the study more accurate and genuine.

We at SNS Insider have divided Primary Research into 2 parts.

Part 1 wherein we interview the KOLs of major players as well as the upcoming ones across various geographic regions. This allows us to have their view over the market scenario and acts as an important tool to come closer to the accurate market numbers. As many as 45 paid and unpaid primary interviews are taken from both the demand and supply side of the industry to make sure we land at an accurate judgement and analysis of the market.

This step involves the triangulation of data wherein our team analyses the interview transcripts, online survey responses and observation of on filed participants. The below mentioned chart should give a better understanding of the part 1 of the primary interview.

Primary Research

Part 2: In this part of primary research the data collected via secondary research and the part 1 of the primary research is validated with the interviews from individual consultants and subject matter experts.

Consultants are those set of people who have at least 12 years of experience and expertise within the industry whereas Subject Matter Experts are those with at least 15 years of experience behind their back within the same space. The data with the help of two main processes i.e., FGDs (Focused Group Discussions) and IDs (Individual Discussions). This gives us a 3rd party nonbiased primary view of the market scenario making it a more dependable one while collation of the data pointers.

Step 3: Data Bank Validation

Once all the information is collected via primary and secondary sources, we run that information for data validation. At our intelligence centre our research heads track a lot of information related to the market which includes the quarterly reports, the daily stock prices, and other relevant information. Our data bank server gets updated every fortnight and that is how the information which we collected using our primary and secondary information is revalidated in real time.

Data Bank Validation

Step 4: QA/QC Process

After all the data collection and validation our team does a final level of quality check and quality assurance to get rid of any unwanted or undesired mistakes. This might include but not limited to getting rid of the any typos, duplication of numbers or missing of any important information. The people involved in this process include technical content writers, research heads and graphics people. Once this process is completed the title gets uploader on our platform for our clients to read it.

Step 5: Final QC/QA Process:

This is the last process and comes when the client has ordered the study. In this process a final QA/QC is done before the study is emailed to the client. Since we believe in giving our clients a good experience of our research studies, therefore, to make sure that we do not lack at our end in any way humanly possible we do a final round of quality check and then dispatch the study to the client.

Key Segments

By Type

  • Coagulants & Flocculants

  • Corrosion & Scale Inhibitors

  • Biocides & Disinfectants

  • Chelating Agents

  • Others

By Source

  • Plant-Based Sources

  • Animal-Based Sources

  • Mineral-Based Sources

By Application

  • Wastewater Treatment

  • Drinking Water Treatment

  • Process Water Treatment

  • Others

By End-Use Industry

  • Municipal

  • Industrial

Request for Segment Customization as per your Business Requirement: Segment Customization Request

Regional Coverage: 

North America

  • US

  • Canada

  • Mexico

Europe

  • Germany

  • France

  • UK

  • Italy

  • Spain

  • Poland

  • Turkey

  • Rest of Europe

Asia Pacific

  • China

  • India

  • Japan

  • South Korea

  • Singapore

  • Australia

  • Rest of Asia Pacific

Middle East & Africa

  • UAE

  • Saudi Arabia

  • Qatar

  • South Africa

  • Rest of Middle East & Africa

Latin America

  • Brazil

  • Argentina

  • Rest of Latin America

Request for Country Level Research Report: Country Level Customization Request

Available Customization 

With the given market data, SNS Insider offers customization as per the company’s specific needs. The following customization options are available for the report: 

  • Detailed Volume Analysis 

  • Criss-Cross segment analysis (e.g. Product X Application) 

  • Competitive Product Benchmarking 

  • Geographic Analysis 

  • Additional countries in any of the regions 

  • Customized Data Representation 

  • Detailed analysis and profiling of additional market players

Explore Key Insights.


  • Analyzes market trends, forecasts, and regional dynamics
  • Covers core offerings, innovations, and industry use cases
  • Profiles major players, value chains, and strategic developments
  • Highlights innovation trends, regulatory impacts, and growth opportunities
Request an Analyst Call