Haptic Technology Market Size

Get More Information on Haptic Technology Market - Request Sample Report
Market Report Scope & Overview
The Haptic Technology Market was Valued at USD 6.60 Billion in 2023 and is now anticipated to grow to USD 15.73 Billion by 2032, growing at CAGR 9.02% of during the forecast Period 2024 - 2032.
The haptic technology operations is rising, stimulated by the desire for progressively realistic user experiences. Customers are increasingly looking for having the capacity to regulate the type, courage, and amount of haptic input. Developments in hardware and software development provide more seamless incorporation of tactile technology with numerous devices, resulting in a broader range of haptic experiences. This growth is accelerated by advancements in actuators, software, and interaction with VR/AR/AI, which blur the divide among the virtual and real worlds. Haptics is finding creative uses in product design and education, going beyond its usual use in entertainment and telecommunications.
High-end haptic gloves like the Nova 2 and HaptX G1 showcase the cutting edge of this technology. These gloves provide users with a sense of touch through various methods, including force feedback and vibrotactile actuators. The Nova 2 also introduces "palm feedback" for a more immersive experience, while the HaptX G1 utilizes microfluidics and pneumatics to create a true sense of contact with virtual objects. With prices starting at over $4,499, these gloves are currently high-investment solutions, but they represent the exciting potential of haptic technology to revolutionize the way we interact with the digital world.
Meta has unveiled a new set of haptic gloves aimed at improving virtual reality industries experiences by providing more realistic touch sensations in a subtle manner. These gloves have the capability to revolutionize how individuals interact with VR by allowing them to touch virtual textures and objects.
Texas Instruments recently disclosed progress in developing haptic devices that comply with the Matter standard, showcasing its significant role in the semiconductor industry. With the goal of enhancing compatibility among different smart home devices, Matter presents a fresh standard for smart home connectivity. This development could simplify the integration of haptic technology into smart home systems.
MARKET DYNAMICS
Drivers
Consumer Electronics are Changing Due to Haptics
The introduction of haptics has set off a sensory explosion in electronic devices for consumers. Consider your smartphone engaging to your touch with a pleasing click for pressing buttons or a texture resist during scanning; this is the power of tactile technology. Gone are the days of generic tremors. Haptics provide complex criticism, ranging from sharp affirming statements to rougher surfaces, making experiences enjoyable and educational. Imagine the satisfying "thump" of beating a game section, or the silky surface of an e-reader page turn. These small indicators give a level of realism that already present in our digital experiences. But haptics, which extend beyond entertainment. Consider unique vibrating patterns for notifications or tactile information that influences your touchscreen movement on options. This not only improves usability, but it additionally displays promise for features that are accessible for people with visual impairments. As haptic technology advances, the possibilities are limitless: merging feedback into wearables for a more pleasant user experience, or establishing virtual purchases where you can feel item textures without choosing. The forthcoming generation of technology for consumers is becoming further tactile, with haptics leading this captivating alteration.
Haptics are revolutionizing automobiles & redefining safe driving
Haptic technology brings in a new era of natural interaction between the driving and automobile, altering how we experience road safety. Considering a slight vibrations on the wheel of your car, just a small nudge that alerts you to an unplanned change in lane. This highlights the power of tactile technology. Haptics extend beyond simply vibrations. They increase awareness by combining sensations of touch into vehicles controls and dashboards. A modest tug on the wheel of the vehicle could suggest lanes variation, whilst a vibrating motion in the dashboard could mean a blind spot. In contrast to shouting warnings, these subtle signals capture your keen interest without seeming excessive. The benefits go far past safety. Haptics may enhance control as well as comfort. Consider feeling a pleasant confirmation when changing the temperature management or a calming pulse as you operate cruise control. These haptic indicates provide input but maintaining your eyes on the road. As technology evolves, more inventive possibilities are on the horizon. Haptic navigation systems could direct your fingers on the steering wheel, whereas immersive parking assistance could provide participation on steering and their position. The future of driving is becoming more understandable and secure, and tactile sensations are at the center of this exciting changing.
Restraints
Aiming for the Future but Meeting Obstacles
Haptic technology shows great potential in providing immersive touch experiences in future iterations, yet significant technical hurdles must be overcome before it can fully realize its capabilities. The main challenge lies in reliability. Current haptics cannot replicate the precise nuances of human touch. When choosing between velvet and silk, it's difficult for modern technology to replicate the small details in appearance, temperature differences, and subtle tactile sensations. The extra problem comes from the size and weight of haptic actuators. These sensors may be bulky and weighty, particularly when providing strong force feedback. This leads to bulky electronic devices and challenges in creating intricate haptic interfaces. Think about using a VR headset and haptic gloves for an extended period; convenience might not be your initial focus. Finally, concerns about battery life continue to be significant. Mainly designed for portable electronic devices with limited battery capacities, haptic feedback can consume a significant amount of battery power. Imagine your phone abruptly dying as you are on the verge of completing a thrilling haptic game. It's an extremely aggravating situation. Advancements in miniaturization, better materials, and software are enabling the development of increasingly realistic, lighter, and more energy-efficient tactile experiences. Once haptic technology surpasses these technical challenges, it is expected to break free from its limitations and change the way we interact with the digital world.
Cost Barriers Impeding the Adoption of Haptic
Even though haptic technology holds the potential for immersive touch experiences in the future, its widespread use is hindered by economic challenges. The high cost linked to development and integration is the initial challenge. Picture the intricate interaction among actuators, sensors, and control systems – crucial components for generating haptic sensations. Creating and incorporating these parts can come at a high cost, presenting a challenge for sectors that prioritize affordability. This can restrict the utilization of haptics in affordable electronic devices.
The complications do not stop at that point. Specialized software development is necessary in order to produce truly immersive haptic experiences. Consider it as creating a special touch language, converting digital movements into subtle vibrations and textures. This particular software introduces more complexity and expense to the project as a whole. Think about requiring a group of developers solely for enhancing the tactile feedback of a basic button press - this is the level of commitment haptics currently requires.
KEY SEGMENTS
BY COMPONENT
-
Hardware
-
Software
Hardware holds a majority share of 50% in the Haptic Technology Market, making it the dominant segment. Every haptic feedback technology must include these components. Hardware consists of physical components, whereas software functions as the mind's engine. New developments continue to sustain this dominance. While reductions result in lighter and more condensed components, new transducer advancements provide more vivid sensations and stronger pressure effects, creating potential new opportunities for haptics in devices and smartphones. The hardware market offers numerous opportunities as well. Various hardware components, such as basic vibration motors in mobile phones to advanced processors in virtual reality controllers, can be tailored to meet specific requirements for numerous applications in different industries. When considering its various uses, hardware can have a significant impact on expanding haptic experiences across different industries. While technology remains dominant now, haptics' future probably lies in a harmonious approach where advancements in software and hardware work together to unlock the potential of this medium and create more engaging interactions.
BY APPLICATION
-
automotive & Transportation
-
Healthcare
-
Education & Research
-
Consumer Devices
-
Commercial & Industrial
-
Others
Consumer Devices holds the largest market share at 35%, making it the most dominant segment. When it comes to haptics, electronic devices reign supreme in terms of programs. Three factors contribute to this dominance. To begin with, haptics were initially integrated into wearables, gaming controllers, tablets, smartphones, and various consumer devices. The extensive user base, comfortable with technological innovations, has improved the fundamental framework of the market. Furthermore, haptics enhance the accessibility of consumer products. Picture the incredible sounds of digital buttons being clicked or the seamless sensation of scrolling—these characteristics enhance our daily interactions with a more genuine and instinctive touch. To sum up, accessibility and growth are essential elements that propel the quickly advancing consumer electronics industry. This advances haptic technology, making it easier to incorporate into a wider variety of products across different price points.
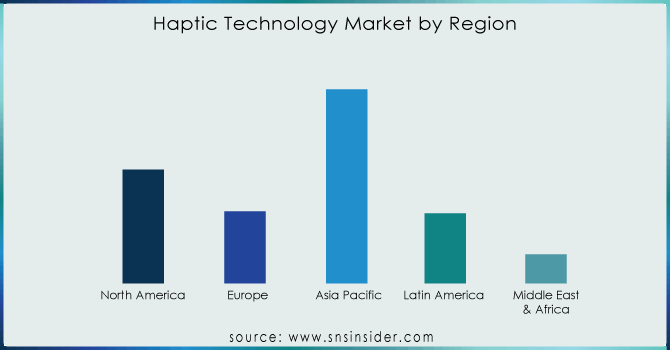
REGIONAL ANALYSES
Pacific (APAC) region is mainly influenced by several factors. The consumer electronics industry in that region is flourishing, particularly in nations such as South Korea, Japan, and China. These countries excel in manufacturing wearable gaming consoles, smartphones, and other gadgets that are popular for haptic feedback. The strong manufacturing base is driving consumer demand for and use of haptic technology. Secondly, many APAC governments are providing funding for research and development as they recognize the potential of haptics. Government assistance and regulations cultivate the conducive setting for the development and advancement of haptic technology companies. The APAC region has a unique economic advantage because of its rapid industrialization and expanding workforce, leading to increased financial independence. This results in a substantial and eager consumer base looking to purchase haptic-enabled electronics, thus boosting the swift expansion of the local industry.
It is approximated that North America holds 20% of the market share. Although not the top market share leader globally, North America remains a significant contributor to innovation. This region is a center for cutting-edge research and innovation, with leading haptic technology companies continuously expanding the range of possibilities. Their objective is to innovate haptic experiences and develop innovative solutions with the potential to revolutionize multiple industries.
In contrast, safety and quality are prioritized in Europe. The auction websites they operate have strict standards and require top-notch products. The cautious attitude could lead to a slower acceptance of new haptic technologies. However, it does offer a level of security and user satisfaction in haptic applications. Although adoption rates may differ, Europe aims to promote the creation of haptic solutions that are consistently robust, prioritizing an outstanding customer experience.
There is opportunity for significant growth in South America, the Middle East, and Africa. Despite their decreased market share, numerous factors indicate that these regions will become important competitors in the future. Initially, fast economic growth is being seen in a number of these nations. The growing number of users and more funding will boost the future adoption of haptic-enabled technology. Additionally, there is a large, potential market for haptic equipment in these regions. Compared to well-known regions, South America and the Middle East and Africa offer a new opportunity for businesses looking to expand and establish a presence in these uncharted territories. The absence of an established network can enhance a company's ability to implement haptic technology solutions and potentially surpass competitors.
Get Customized Report as per Your Business Requirement - Request For Customized Report
REGIONAL COVERAGE
North America
-
US
-
Canada
-
Mexico
Europe
-
Eastern Europe
-
Poland
-
Romania
-
Hungary
-
Turkey
-
Rest of Eastern Europe
-
-
Western Europe
-
Germany
-
France
-
UK
-
Italy
-
Spain
-
Netherlands
-
Switzerland
-
Austria
-
Rest of Western Europe
-
Asia Pacific
-
China
-
India
-
Japan
-
South Korea
-
Vietnam
-
Singapore
-
Australia
-
Rest of Asia Pacific
Middle East & Africa
-
Middle East
-
UAE
-
Egypt
-
Saudi Arabia
-
Qatar
-
Rest of Middle East
-
-
Africa
-
Nigeria
-
South Africa
-
Rest of Africa
-
Latin America
-
Brazil
-
Argentina
-
Colombia
-
Rest of Latin America
Key Players
The major key players are Immersion Corporation (U.S.), 3D Systems (U.S.) Jahwa Electronics (South Korea), Renesas Electronics Corporation (Japan), Texas Instruments (U.S.), D-Box Technologies (Canada), AAC Technologies (China), Johnson Electric (China), Microchip Technology (U.S.), TDK Corporation (Japan), Awinic (China) and others.
RECENT DEVELOPMENT
In February 22, 2024 - Renesas Electronics Corporation a premier supplier of advanced semiconductor solutions, today announced the development of embedded processor technology that enables higher speeds and lower power consumption in microprocessor units (MPUs) that realize advanced vision AI.
In October 2023, AITO BV released an integrated touchpad that offers a best in class haptic application, while delivering significant cost and space savings as compared to its competitor’s products. This enables manufacturers to introduce the benefits of haptic touch technology to a much wider range of laptops and other devices.
In October 2023, Boréas Technologies launched HapticStudio, an intuitive software development kit (SDK) for designers to develop customized haptic effects on CapDrive semiconductors. The company offers BOS1921 CapDrive ultra-low-power piezo driver with advanced sensing.
In February 28, 2023 – 3D Systems announced a multi-faceted restructuring initiative designed to improve operating efficiencies that include optimizing its European metal printer operations and streamlining its software organization.
In March 18, 2022 - TDK Corporation announced that it has decided to build “the Inakura Factory West Site” in Nikaho City, Akita Prefecture, Japan. The new factory will be a new production facility for electronic components.
| Report Attributes | Details |
|---|---|
| Market Size in 2023 | USD 6.60 Billion |
| Market Size by 2032 | USD 15.73 Billion |
| CAGR | CAGR of 9.02 % From 2024 to 2032 |
| Base Year | 2023 |
| Forecast Period | 2024-2032 |
| Historical Data | 2020-2022 |
| Report Scope & Coverage | Market Size, Segments Analysis, Competitive Landscape, Regional Analysis, DROC & SWOT Analysis, Forecast Outlook |
| Key Segments | • By Component (Hardware, Software) • By Application (Automotive & Transportation, Healthcare, Education & Research, Consumer Devices, Commercial & Industrial, Others) |
| Regional Analysis/Coverage | North America (US, Canada, Mexico), Europe (Eastern Europe [Poland, Romania, Hungary, Turkey, Rest of Eastern Europe] Western Europe] Germany, France, UK, Italy, Spain, Netherlands, Switzerland, Austria, Rest of Western Europe]), Asia Pacific (China, India, Japan, South Korea, Vietnam, Singapore, Australia, Rest of Asia Pacific), Middle East & Africa (Middle East [UAE, Egypt, Saudi Arabia, Qatar, Rest of Middle East], Africa [Nigeria, South Africa, Rest of Africa], Latin America (Brazil, Argentina, Colombia, Rest of Latin America) |
| Company Profiles | Immersion Corporation (U.S.), 3D Systems (U.S.) Jahwa Electronics (South Korea), Renesas Electronics Corporation (Japan), Texas Instruments (U.S.), D-Box Technologies (Canada), AAC Technologies (China), Johnson Electric (China), Microchip Technology (U.S.), TDK Corporation (Japan), Awinic (China) and others. |
| Key Drivers | • Consumer Electronics are Changing Due to Haptics • Haptics are revolutionizing automobiles & redefining safe driving |
| RESTRAINTS | • Aiming for the Future but Meeting Obstacles • Cost Barriers Impeding the Adoption of Haptic |
Get in Touch
