pH Sensor Market Report Scope and Overview:
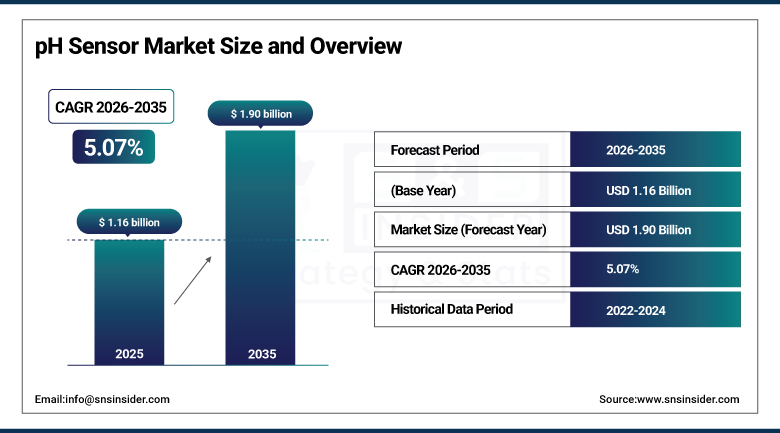
The pH Sensor Market size was valued at USD 1.16 Billion in 2025 and is expected to reach USD 1.90 Billion by 2035, growing at a CAGR of 5.07% over the forecast period of 2026-2035.
The global pH sensor market is growing considerably as a result of an increasing demand for real-time monitoring, industrial automation, and stringent water quality standards. All this is driven by a rise in total adoption in biotechnology, pharmaceuticals, and environmental management. This trend is being supported by factors such as increased sensor accuracy, ease in integrating sensors with control systems, and miniaturized electronics. It is witnessing high demand in wastewater treatment and food safety applications, wherein continuous pH monitoring is a major requirement. Emerging economies have also been adding to market momentum as they modernize their infrastructure and become increasingly aware of the necessity of maintaining environmental sustainability.
Recent advancements have increased pH sensor accuracy by up to 30%, significantly reducing measurement drift in industrial environments.
Over 90 countries have implemented national water quality standards requiring real-time pH monitoring in discharge systems.
pH Sensor Market Size and Growth Forecast:
-
Market Size in 2025: USD 1.16 Billion
-
Market Size by 2035: USD 1.90 Billion
-
CAGR: 5.07% from 2026 to 2035
-
Base Year: 2025
-
Forecast Period: 2026–2035
-
Historical Data: 2022–2024
To Get More Information On pH Sensor Market - Request Free Sample Report
pH Sensor Market Trends Highlights:
-
Rapid advancement of pH sensor technologies is driving higher sensitivity, stability, and broader application scopes — from printed potentiometric electrodes using carbon black/polyaniline for clinical diagnostics to robust solid‑state designs for challenging industrial environments.
-
Compact and inline pH sensors like the mikron 91 are increasingly adopted in continuous bioprocessing, chromatography, and automated workflows, offering temperature‑compensated, real‑time pH measurement with minimal maintenance.
-
Innovation in materials and fabrication (e.g., nanocomposites, screen‑printed electrodes, and advanced microfabrication) is enabling cost‑effective, miniaturized, and robust pH sensors suitable for in‑field, clinical, and industrial use.
-
Integration with microfluidic and analytical systems is expanding the role of pH sensors in lab‑on‑a‑chip devices, enhancing spatial resolution and enabling precise control for biomedical, environmental, and food safety monitoring.
-
Sensor performance improvements such as enhanced selectivity, wide linear ranges, and strong reproducibility are enabling accurate pH measurement across diverse sample matrices, which supports broader adoption in healthcare, water treatment, and process industries.
-
Market growth is supported by automation, real‑time monitoring, and smart manufacturing trends, as inline and connected pH sensors become integral parts of process control systems across pharmaceuticals, chemicals, and wastewater management.
U.S. pH Sensor Market Size Outlook
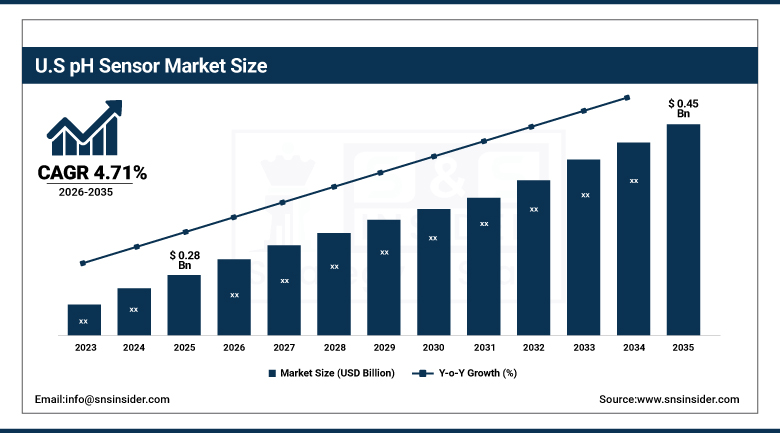
The U.S. pH Sensor Market size was USD 0.28 billion in 2025 and is expected to reach USD 0.45 billion by 2035, growing at a CAGR of 4.71% over the forecast period of 2026–2035.The U.S. market is generating substantial traction in the pH sensor industry, due to the growing adoption in smart wearables, factory automation, and various advanced healthcare devices. Robust R&D investments, presence of key sensor manufacturers, and a strong industrial environment are propelling adoption across industries, making the U.S. a key player in global share of pH sensor market.
Nearly 75% of newly installed bioreactor systems in U.S. pharma manufacturing use integrated pH sensing for quality assurance.
Over 78% of U.S. pharmaceutical manufacturers implemented real-time pH monitoring in bioprocesses to meet evolving FDA guidelines.
pH Sensor Market Drivers:
-
Growth of pH sensor systems is attributed to rise in need for water quality monitoring in industries and municipalities
Growing need for pH sensor system to meet regulations and protect the environment from various industries and municipalities bolsters demand for water quality monitoring. Industries need to continuously monitor the quality of the effluent because the government authorities are becoming stricter and tighter in norms for discharge. As a result, there has been an investment in smart water infrastructure by municipal utilities not only for detecting contamination, but also to delivery safe water. Seamless integration of pH sensors with industrial plants is key to sustainable manufacturing, and with manufacturers prioritising sustainable practices, declining chemical waste, expanding treatment processes for a wide range of industries including energy, food & beverage, and chemicals.
Over 65% of U.S. wastewater treatment plants integrated real-time pH monitoring systems to comply with EPA discharge standards.
More than 70% of food and beverage manufacturers implemented automated pH sensing in their quality control processes to meet hygiene regulations.
pH Sensor Market Restraints:
-
High-temperature, chemically aggressive environments degrade sensor reliability, limiting use in sophisticated applications
In many complex real-life applications such as petrochemicals, power generation, and metal processing, traditional sensor reliability breaks down at high-temperature and chemically aggressive environments. Typical pH sensors do not function well under these conditions and require frequent replacement due to performance degradation and lack of accuracy. Such unreliability directly impacts critical process control, downtime as well as product quality. Ruggedized sensors do exist, but they have a higher price point and are more complicated to integrate, and thus have a poor adoption context in plants where multi-functional sensing (or wireless capability) is important for seamless monitoring.
pH Sensor Market Opportunities:
-
Use of IoT and wireless connectivity in pH sensor allow smart monitoring and automation in modern industries
The adoption of pH sensors equipped with IoT and wireless connectivity capabilities creates the possibilities for smart monitoring and automation in smart industrial systems, which is a trend related to Industry 4.0. That means to use real-time data sharing, predictive maintenance, and SCADA and cloud-based platforms making use of connected pH sensors, etc. They supplement decision making, eliminate manual efforts, and boost regulatory compliance in water treatment, manufacturing, and pharmaceutical systems. The global growth in demand for pH monitoring technologies is further complemented by such industries migrating towards smart sensors that not only provide a sensing capability, but also deliver actionable insights through digital transformation, thus providing a compelling case for the large growth potential of IoT-enabled pH monitoring technologies.
SCADA-based process monitoring systems are projected to manage over 60% of industrial water treatment facilities by 2026,” significantly driven by integration with smart pH sensors.
The adoption of wireless pH sensors in the pharmaceutical and water treatment sectors grew by 28% year-over-year in 2024,” reflecting a shift toward real-time compliance and automation..
pH Sensor Market Segment Analysis:
By Type
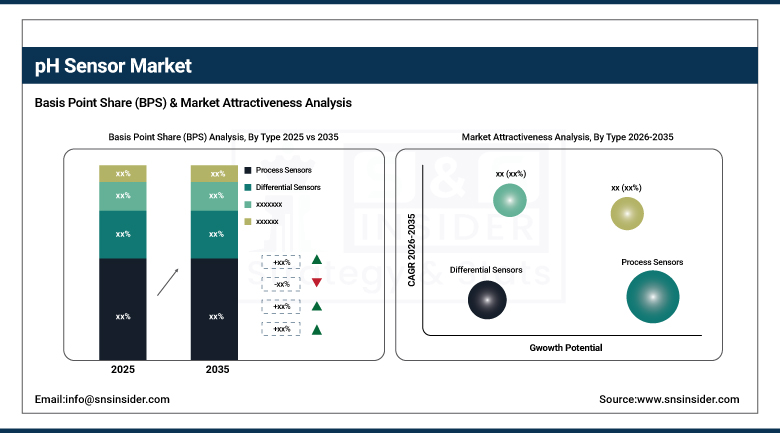
In 2025, the Process Sensors segment held the highest share of 42.90%, owing to industrial-scale deployment across manufacturing environments. These sensors are widely used in continuous applications including water treatment, chemical production, and food processing as a measure of pH. These are very suitable for automated industrial systems due to their strong design and capability to withstand extreme environments. To put some context around this, Endress+Hauser one of the leaders in process automation partnered with an original EXA-542 pH sensor to bring highly accurate inline pH to seamlessly integrate with the industrial control networks center to this trend. For large scale processing, they are the number 1 choice since they can deliver at continuous levels with industrial type robustness.
Combination pH sensors segment is expected to witness the fastest growth over the forecast period registering a CAGR of 7.02% from 2026 to 2035 due to its growing demand in lab and portable testing. These sensors integrate both measuring and reference electrodes into a single component, providing miniaturization and ease of use. Their straightforwardness makes them perfect for education, farming and ecological observing. Demand is also being buoyed by increasing uptake in low-resource settings. Thermo Fisher Scientific then also played a huge role in this growth trend with its inexpensive, user-friendly combo pH sensors used in the lab or field, making them widely accessible and reproducible in academia and small labs around the world.
By System Type
In 2025, benchtop pH sensors accounted for the largest revenue share of 47.50% owing to their accuracy coupled with the constant preference in lab-based quality control. This makes a system reliable and suitable for organizations like research organizations, pharma labs and food safety testing facilities. This means they are a mainstay in regulated environments where consistent readings over time tends to a foregone conclusion. The launch of advanced benchtop meters with multi-parameter capabilities and automated calibration by companies such as METTLER TOLEDO has further fortified this segment. They are reliable instruments for compliance testing and an essential part of high accuracy laboratory applications.
Portable pH sensors are expected to gain the fastest compound annual growth rate (CAGR) of 5.44% in the forecast timeframe from 2026 to 2035. These miniature sensors are light-weight, battery-powered and have digital interfaces that are a perfect match for agriculture, aquaculture and environmental monitoring application. They allow for real-time decision-making without depending on lab facilities. This segment is stimulated by the growing outdoor testing requirements in emerging economies. To encourage this growth further, companies such as Hanna Instruments are developing tough, waterproof portable pH meters with Bluetooth and smartphone compatibility that allows for safe and rapid analysis of samples in the field.
By Application
The Biotechnology Processes held the largest revenue share of 59.50% in 2025 and it is also anticipated to show the fastest growth with a CAGR of 6.15% between 2026 and 2035 owing to the worldwide expansion of biopharma, as pH monitoring is an integral part of bio-manufacturing processes. Compilation: Information of Altogen Labs, pH Control in Cell Culture, Impact of pH Control in Fermentation, Penna Vaccine Development, Precise pH Control in Cell Culture, Impact of pH Control in Fermentation a Penna Vaccine Development Altogen Labs is a scientifically advanced and research driven company specialized in developing biomedical products. It is a segment that thrives in an environment where the process needs to be bulletproof and regulate. This impact has been a major benefit to Hamilton Company, whose sensors developed for type of bioreactor and extracted grade environments allow biotechnology companies to keep their process at maximum levels of operation and confirm product potential.
pH Sensor Market Regional Analysis:
North America pH Sensor Market Trends:
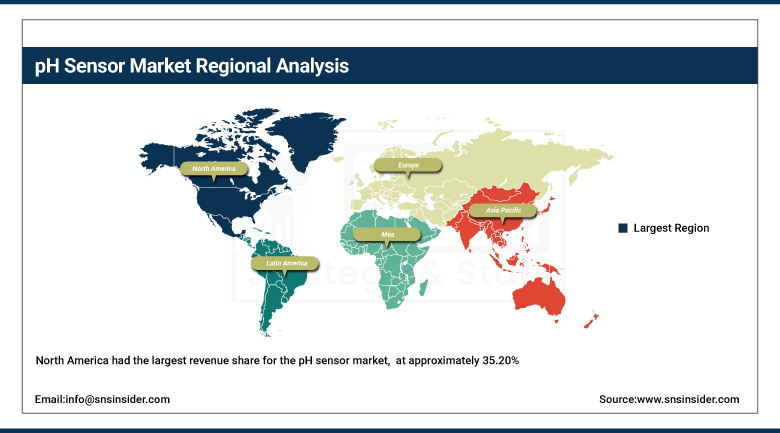
North America had the largest revenue share for the pH sensor market, at approximately 35.20%, due to its well-established industrial automation, advanced healthcare infrastructure, and robust enforcement of environmental regulations. The market here is well matured as high-precision sensors are used in pharmaceuticals, water treatment, and research institutions. Demand remains supported across sectors with government investments in infrastructure modernization and technological innovation.
The U.S. dominates the North American pH sensor market due to its advanced industrial base, strict environmental regulations, and strong presence of pharmaceutical and biotech sectors, coupled with significant investments in automation, process control, and sensor technology development.
Get Customized Report as Per Your Business Requirement - Enquiry Now
Asia-Pacific pH Sensor Market Trends:
Asia Pacific, forecasted to grow with the highest CAGR of around 6.63% between 2026 and 2035, is anticipated to be driven by increasing industrialization, stringent environmental regulations, and growing healthcare and food industries. Advanced Water Treatment and Process Monitoring Systems are being adopted in countries such as China, India, Southeast Asia to foster urbanization and sustainability. High Growth Markets are seeing continued localization of technology and strong investment to meet throughput with Cost Effective Performance Sensors.
China leads the Asia Pacific pH sensor market due to rapid industrialization, large-scale water treatment initiatives, expanding pharmaceutical and food industries, and strong government focus on environmental monitoring, supported by growing domestic manufacturing and increasing adoption of automation technologies across key sectors.
Europe pH Sensor Market Trends:
Europe accounts for a large portion of pH sensor global market share as a result of strict environmental regulations, high technology level of water treatment infrastructure, and strong pharmaceutical and chemical industrial sectors. Emerging trends such as smart process automation and quality control systems, increasing focus on sustainability, and precision manufacturing, in countries such as Germany, the UK, and France, is positively affecting the market growth of high performance pH sensors.
Germany dominates the European pH sensor market due to its advanced industrial infrastructure, strict environmental regulations, and strong presence in pharmaceuticals and chemicals, supported by high investment in automation, quality control technologies, and a mature ecosystem of sensor manufacturers and integrators.
Latin America and Middle East & Africa pH Sensor Market Trends:
Saudi Arabia dominates the Middle East & Africa pH sensor market due to extensive investments in water treatment, petrochemicals, and desalination projects. Brazil leads the way in Latin America with its robust agricultural sector, growing food processing operations and a rising interest in environmental monitoring and industrial automation technologies.
pH Sensor Market Competitive Landscape:
Honeywell International Inc. is a U.S. multinational conglomerate founded in 1906 that develops and manufactures a wide range of industrial automation products, control systems, sensors (including pH and other process sensors), aerospace systems, building automation, and safety solutions for global markets; with headquarters in Charlotte, North Carolina, the company serves aerospace, industrial, energy, and commercial sectors, leveraging over a century of innovation in automation and control technologies.
-
In June 2024, a comprehensive seawater testing study validated the durability and stability of Honeywell’s Durafet ISFET-based sensor, confirming its suitability for long-term environmental monitoring applications.
Thermo Fisher Scientific Inc. is a U.S.‑based global provider of scientific instruments, laboratory equipment, analytical tools, reagents and services, formed in 2006 through the merger of Thermo Electron and Fisher Scientific; headquartered in Waltham, Massachusetts, the company supports research, diagnostics and industrial applications across life sciences, healthcare, environmental and process industries with a broad portfolio of precision measurement and laboratory technologies.
-
In May 2025, Thermo Fisher released firmware and software enhancements for the Orion Star A211 benchtop pH meter, improving calibration control, data logging capacity (up to 2,000 points), and USB/RS232 connectivity.
pH Sensor Market Companies are:
-
Honeywell International Inc.
-
ABB Ltd.
-
Emerson Electric Co.
-
Yokogawa Electric Corporation
-
Hach Company (Danaher Corporation)
-
Hamilton Company
-
Xylem Inc.
-
Sensorex (A Halma Company)
-
Endress+Hauser Group
-
OMEGA Engineering Inc.
-
Metrohm AG
-
Jenco Instruments Inc.
-
Hanna Instruments
-
Cole-Parmer Instrument Company
-
Shimadzu Corporation
-
Siemens AG
-
E+H (Endress+Hauser subsidiary brands)
-
Blue-White Industries
| Report Attributes | Details |
|---|---|
| Market Size in 2025 | USD 1.16 Billion |
| Market Size by 2035 | USD 1.90 Billion |
| CAGR | CAGR of 5.07% From 2026 to 2035 |
| Base Year | 2025 |
| Forecast Period | 2026-2035 |
| Historical Data | 2022-2024 |
| Report Scope & Coverage | Market Size, Segments Analysis, Competitive Landscape, Regional Analysis, DROC & SWOT Analysis, Forecast Outlook |
| Key Segments | • By Type (Process Sensors, Differential Sensors, Combination pH, Laboratory Sensors), • By System Type (Benchtop, Portable), • By Application (Biotechnology Processes, Clinical Analysis), |
| Regional Analysis/Coverage | North America (US, Canada), Europe (Germany, UK, France, Italy, Spain, Russia, Poland, Rest of Europe), Asia Pacific (China, India, Japan, South Korea, Australia, ASEAN Countries, Rest of Asia Pacific), Middle East & Africa (UAE, Saudi Arabia, Qatar, South Africa, Rest of Middle East & Africa), Latin America (Brazil, Argentina, Mexico, Colombia, Rest of Latin America). |
| Company Profiles | Honeywell International Inc., ABB Ltd., Emerson Electric Co., Yokogawa Electric Corporation, Thermo Fisher Scientific Inc., Hach Company (Danaher Corporation), Hamilton Company, Xylem Inc., Sensorex (A Halma Company), Endress+Hauser Group, Mettler-Toledo International Inc., OMEGA Engineering Inc., Metrohm AG, Jenco Instruments Inc., Hanna Instruments, Cole-Parmer Instrument Company, Shimadzu Corporation, Siemens AG, E+H (Endress+Hauser subsidiary brands), Blue-White Industries. |
Frequently Asked Questions
Ans: North America dominated the pH Sensor Market in 2025.
Ans: Process Sensors segment dominated the pH Sensor Market.
Ans: Increasing demand for real-time water quality monitoring, industrial automation, and environmental compliance is the key driver for pH sensor market.
Ans: The pH Sensor Market size was valued at USD 1.16 Billion in 2025 and is expected to reach USD 1.90 Billion by 2035.
Ans: The pH Sensor Market is expected to grow at a CAGR of 5.07 % from 2026-2035.
Get in Touch
