HD Maps Market Report Scope & Overview:
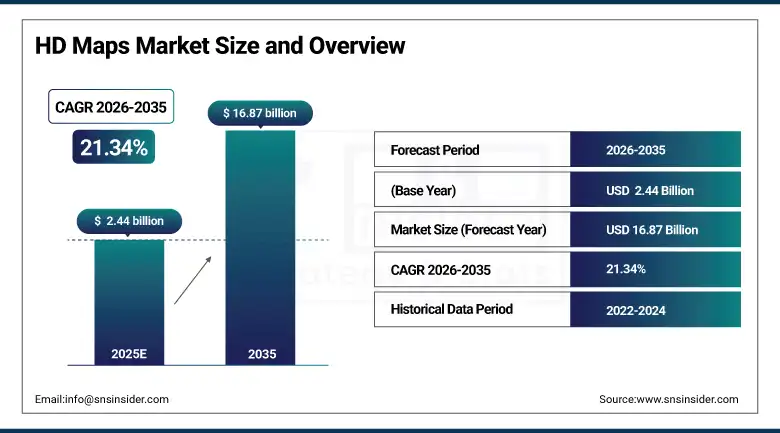
The HD Maps Market size is estimated at USD 2.44 billion in 2025 and is expected to reach USD 16.87 billion by 2035, growing at a CAGR of 21.34% over the forecast period of 2026–2035.
The global HD maps market trend is a growing demand for centimeter-level precision mapping solutions such as cloud-based HD map platforms, embedded mapping systems, and autonomous driving navigation tools as the growth of the market is driven by increasing deployment of ADAS-equipped vehicles, government mandates for autonomous vehicle testing, and automaker expectations for reliable lane-level localization data. This trend is also driven by a growing adoption of Level 2 and Level 3 semi-autonomous driving models and the growing focus on real-time map update infrastructure as automotive OEMs become more focused on improving vehicle safety outcomes and are more willing to invest in HD map data technologies, resulting in growth in the domestic and international market for cloud-based and embedded HD mapping solutions.
For instance, in March 2025, growing investments in autonomous vehicle programs and expanded LiDAR sensor deployment drove a 24% increase in HD map platform subscriptions for automotive OEMs in North America, boosting semi-autonomous driving feature adoption and real-time map update service demand.
HD Maps Market Size and Forecast:
-
Market Size in 2025: USD 2.44 billion
-
Market Size by 2035: USD 16.87 billion
-
CAGR: 21.34% from 2026 to 2035
-
Base Year: 2025
-
Forecast Period: 2026–2035
-
Historical Data: 2022–2024
To Get more information On HD Maps Market - Request Free Sample Report
HD Maps Market Trends
-
HD map solutions are being adopted because automotive OEMs demand precise lane-level localization, real-time road geometry updates, and accurate traffic sign recognition for ADAS and autonomous driving feature deployment.
-
Customized HD map data layers based on road type, traffic density, and geographic region to improve localization performance and path planning accuracy of autonomous and semi-autonomous vehicles.
-
The development of AI-powered map annotation pipelines, crowdsourced vehicle sensor data platforms, and open-format map standards to improve the accuracy of road network data and reduce manual mapping overhead.
-
Cloud-based map update delivery, embedded map processing modules, and over-the-air map refresh systems are all available to ensure continuous map data currency and vehicle localization reliability.
-
Increased demand for cloud-based deployment models, mobile map service interfaces, and self-update map architectures to support data access scalability and cybersecurity compliance.
-
Collaboration between automotive OEMs, HD map providers, and sensor hardware companies to develop integrated mapping systems and improve standards of geospatial data interoperability.
-
NHTSA, ONC, and EU transport regulators promoting standards for autonomous vehicle data safety, map data privacy, meaningful deployment requirements, and vehicle localization data access rights.
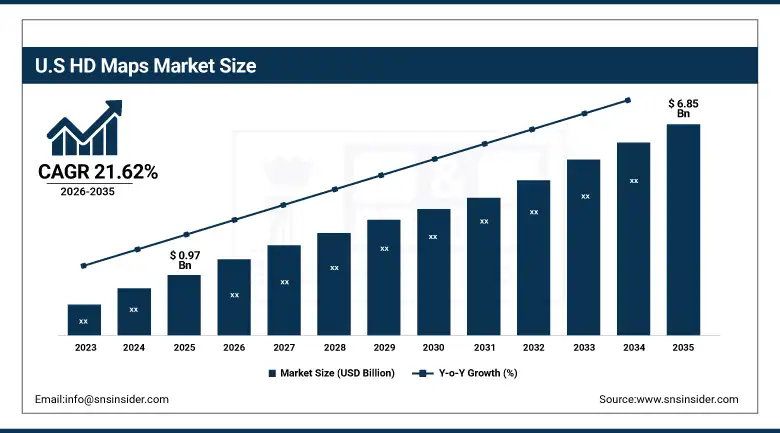
The U.S. HD Maps Market is estimated at USD 0.97 billion in 2025 and is expected to reach USD 6.85 billion by 2035, growing at a CAGR of 21.62% from 2026–2035. The United States represents the largest market for HD maps, primarily driven by the compulsory ADAS adoption in new vehicle platforms, federal programs facilitating autonomous vehicle testing, and well-developed automotive IT infrastructure. Government incentives, moderately high levels of autonomous vehicle investment, and increased OEM and technology company spending on mapping technology help to drive growth in the market. Also, the U.S. is the largest regional market in the world, due to the regulatory support and swift adoption of cloud- and embedded-based HD mapping solutions.
HD Maps Market Growth Drivers:
-
Government Mandates and Autonomous Vehicle Regulatory Support is Driving the HD Maps Market Growth
Government mandates and regulatory support take the center stage as a growth driver for the HD maps market share, and are driven by the implementation of autonomous vehicle testing frameworks, 21st Century Mobility Act requirements, and NHTSA regulations for increased vehicle localization data accessibility and transportation safety transparency. These solutions for automotive digitization and vehicle autonomy enablement are driving the base of the market, the penetration of cloud-based & embedded mapping markets, and adding to the overall market share globally.
For instance, in June 2024, cloud-based and integrated HD map platform solutions accounted for ~64% of the total U.S. automotive OEM technology investments in mapping and localization, reflecting growing institutional preference and expanding market share.
HD Maps Market Restraints:
-
High Data Acquisition and Map Maintenance Costs are Hampering the HD Maps Market Growth
High data acquisition & map maintenance costs of HD map platforms also restrict the HD maps market growth, as a large number of automotive OEMs and technology companies that have access to HD map subscriptions remain dependent on a limited number of providers or face difficulties scaling map coverage across all required road networks. This might lead to coverage gaps, limited geographic expansion, and reduced return on investment for automotive organizations. As a result, vehicle localization performance suffers, and market growth is stunted in regions where rural road coverage is limited and HD map data collection infrastructure is underdeveloped.
HD Maps Market Opportunities:
-
AI Integration and Crowdsourced Map Update Platforms Drive Future Growth Opportunities for the HD Maps Market
The opportunity in the AI integration and crowdsourced map update platforms in the HD maps market is in the form of automated road feature extraction, real-time map refresh from production vehicle sensor data, and personalized map layer recommendations. These solutions provide for early road change detection, individualized vehicle localization suggestions, and real-time HD map health monitoring. Through enhanced map coverage, autonomous driving system support, and operational efficiency, particularly in areas with high road network change frequency, these technologies may improve vehicle safety outcomes, decrease localization errors, and expand the market.
For instance, in April 2024, the ONC reported that 71% of U.S. automotive OEMs were offered access to HD map platforms by their mapping solution providers, highlighting rising platform availability and increasing demand for digital vehicle navigation engagement tools.
HD Maps Market Segmentation Analysis
-
By deployment mode, cloud-based held the largest share of around 62.45% in 2025, and the embedded segment is expected to register the highest growth with a CAGR of 22.18%.
-
By level of automation, the semi-autonomous segment dominated the market with approximately 61.32% share in 2025, while the autonomous segment is expected to register the highest growth with a CAGR of 23.56%.
-
By component, the software segment accounted for the leading share of nearly 48.67% in 2025, and is expected to register the highest growth with a CAGR of 22.43%.
-
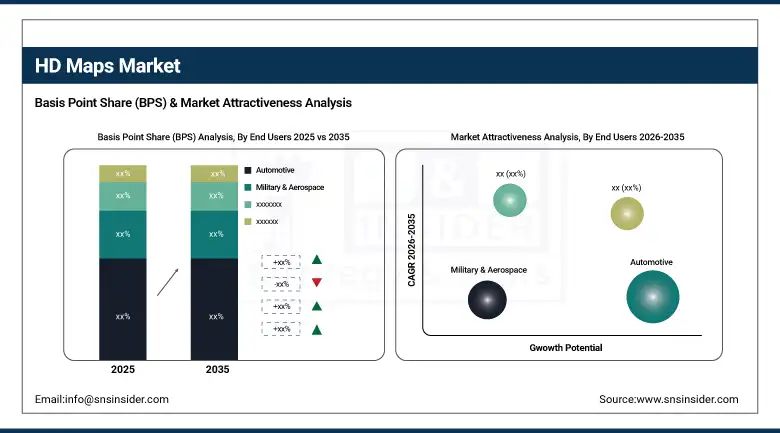
By end users, automotive accounted for the dominant share of approximately 58.24% in 2025, and is expected to register the highest growth with a CAGR of 21.89%.
By Deployment Mode, Cloud-Based Leads the Market, While Embedded Registers Fastest Growth
The cloud-based segment accounted for the highest revenue share of approximately 62.45% in 2025, owing to better scalability with existing OEM software stacks, the seamless map data exchange for comprehensive vehicle localization, and strong automotive provider preference for unified cloud platforms. Emerging trends, including increasing requirements for consolidated map update systems and regulatory emphasis on data continuity. In comparison, the embedded segment is anticipated to achieve the highest CAGR of nearly 22.18% during the 2026–2035 period, driven by the increasing demand from vehicle platforms requiring offline map access, lower cloud dependency costs, and flexibility in onboard map customization. Drivers include rising adoption among premium and commercial vehicle manufacturers, the preference for specialized autonomous driving localization features.
By Level of Automation, the Semi-Autonomous Segment Dominates, while the Autonomous Segment Shows Rapid Growth
By 2025, the semi-autonomous segment contributed the largest revenue share of 61.32% due to its widespread deployment across Level 2 and Level 3 ADAS vehicle platforms, reduced infrastructure integration costs, and automatic map update software compatibility. Growing adoption of Software-as-a-Service map models coupled with vehicle safety standards, OEMs are increasingly aware of cloud-hosted map data services. The autonomous segment is projected to grow at the highest CAGR of about 23.56% between 2026 and 2035 due to the growing need for full-stack localization platforms and multi-sensor HD map compatibility. Some of the reasons include better vehicle positioning accuracy across urban and highway interfaces, better access for Level 4 and Level 5 vehicle populations, and automotive organizations’ preference for autonomous platform-based solutions.
By End Users, Automotive Leads, and Registers Fastest Growth
The automotive segment accounted for the largest share of the HD maps market with about 58.24%, owing to their direct vehicle operation responsibilities, regulatory compliance requirements, and investment capacity for digital mapping infrastructure. Reasons driving the automotive segment include increasing vehicle volume management needs and safety reporting obligations. In addition, it is slated to grow at the fastest rate with a CAGR of around 21.89% throughout the forecast period of 2026–2035, as passenger car OEMs, commercial fleet operators, and autonomous vehicle developers seek comprehensive HD map engagement platforms, value-based mobility reimbursement models, and autonomous vehicle navigation capabilities. Increased focus on vehicle safety and map data coordination contribute to their adoption, while improved vehicle localization scores and reduced navigation error rates drive continued investment.
HD Maps Market Regional Highlights:
North America HD Maps Market Insights:
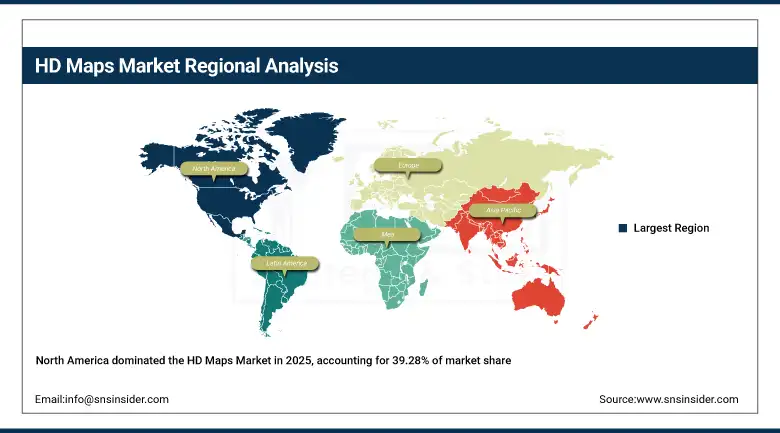
North America held the largest revenue share of over 39.28% in 2025 of the HD maps market due to an established automotive IT environment, stringent requirements for accessing vehicle localization data, and increased OEM awareness regarding the advantages of digital mapping. Drivers include ubiquitous use of ADAS platforms, an improved broadband network, growing autonomous vehicle testing penetration and greater acceptance of connected vehicle services stemming from what we learned from the pandemic. At the same time, various government incentives, meaningful deployment requirements, and enormous investments in mapping technology from automotive OEMs and technology payers are anchoring HD map software and services in the market, and ensuring multibillion dollar revenues around the world.
Get Customized Report as per Your Business Requirement - Enquiry Now
Asia Pacific HD Maps Market Insights:
Asia Pacific is the fastest-growing segment in the HD maps market with a CAGR of 23.17%, as the awareness about autonomous vehicle deployment, government automotive IT initiatives, and transport infrastructure modernization in developing nations is growing. Factors including rapid urbanization, rising middle-class population with ADAS-equipped vehicle ownership, and growing uptake of smartphone-based navigation applications are stimulating the market growth. Mobile mapping platforms and connected vehicle options have been instrumental in improving access to HD map coverage, especially in urban and semi-urban settings. Public-private partnerships and government programs also help in advancing vehicle digitization and autonomous driving deployment. Increase in demand in Asia Pacific region owing to rising automotive technology expenditure against historical spending levels and growing affordability and accessibility of cloud-based HD map engagement tools.
Europe HD Maps Market Insights:
The HD maps market in Europe is the second-dominating region after North America on account of an increase in the adoption of autonomous vehicle platforms, robust data protection regulations including GDPR, and increasing vehicle safety empowerment initiatives across automotive systems. Rising implementation of national vehicle information exchanges, advanced digital mobility strategies, favorable government funding for automotive IT projects, and cross-border vehicle navigation directives are also contributing to the sustained growth of the market in leading European countries.
Latin America (LATAM) and Middle East & Africa (MEA) HD Maps Market Insights:
In Latin America, and Middle East & Africa, the growing automotive digitization efforts and increase in internet connectivity with mobile device penetration support the HD maps market growth. The rising popularity of affordable cloud mapping solutions and multilingual platform capabilities, along with public awareness campaigns, will aid vehicle navigation accessibility and autonomous driving engagement. The increasing urban population and improving automotive infrastructure in these regions are continuing to encourage market growth.
HD Maps Market Competitive Landscape:
HERE Technologies (est. 1985) is a leading location intelligence and HD mapping platform provider that focuses on cloud-based high-definition map solutions for a connected vehicle care environment. It uses its comprehensive HD Live Map platform and OEM client relationships to produce cutting-edge HD map technology with seamless ADAS workflow integration.
-
In August 2025, it expanded its HD Live Map platform capabilities with AI-driven road feature extraction and automated map health assessments, aiming to improve OEM self-service map access and autonomous driving decision support across its automotive provider network.
TomTom International BV (est. 1991) is a well-known global navigation technology company focused on HD maps, real-time traffic data, and autonomous driving navigation solutions. It invests in interoperable HD map engagement platforms and connected vehicle map applications with the hopes of revolutionizing the driving experience with secure, accessible, and personalized digital mapping tools.
-
In January 2025, launched an enhanced cloud-based HD map platform featuring real-time map update scheduling and integrated autonomous driving capabilities across North American automotive OEM systems, enhancing vehicle access, convenience, and virtual map delivery.
Mobileye Global Inc. (est. 1999) is a leading autonomous driving technology provider in the fields of Road Experience Management, EyeQ processor development, and HD map engagement solutions. The company’s HD map product portfolio focuses on crowdsourced map update interfaces and sensor-first design, and features a strong commitment to regulatory compliance and continuous innovation to complement the strong market presence in both passenger and commercial vehicle segments.
-
In March 2025, introduced advanced HD map analytics and personalized road feature content delivery capabilities for its REM platform, strengthening map engagement capabilities and expanding adoption among small to mid-sized automotive OEM practices.
HD Maps Market Key Players:
-
HERE Technologies
-
TomTom International BV
-
Mobileye Global Inc. (Intel Corporation)
-
Baidu, Inc. (Apollo)
-
Waymo LLC
-
Dynamic Map Platform Co., Ltd.
-
NavInfo Co., Ltd.
-
AutoNavi (Alibaba Group)
-
Zenrin Co., Ltd.
-
Woven by Toyota, Inc.
-
Robert Bosch GmbH
-
Momenta Group
-
CE Info Systems Ltd. (MapmyIndia)
-
The Sanborn Map Company, Inc.
-
Hyundai Autoever Corp.
-
Swift Navigation, Inc.
-
Trimble Inc.
-
Telenav Inc.
| Report Attributes | Details |
|---|---|
| Market Size in 2025 | USD 2.44 Billion |
| Market Size by 2035 | USD 16.87 Billion |
| CAGR | CAGR of 21.34% From 2026 to 2035 |
| Base Year | 2025 |
| Forecast Period | 2026-2035 |
| Historical Data | 2022-2024 |
| Report Scope & Coverage | Market Size, Segments Analysis, Competitive Landscape, Regional Analysis, DROC & SWOT Analysis, Forecast Outlook |
| Key Segments | • By Deployment Mode (Cloud-Based, Embedded) • By Level of Automation (Semi-Autonomous, Autonomous) • By Component (Hardware, Software, Service) • By End Users (Automotive, Military & Aerospace, Internet Service Providers, Others) |
| Regional Analysis/Coverage | North America (US, Canada, Mexico), Europe (Germany, France, UK, Italy, Spain, Poland, Turkey, Rest of Europe), Asia Pacific (China, India, Japan, South Korea, Singapore, Australia, Rest of Asia Pacific), Middle East & Africa (UAE, Saudi Arabia, Qatar, South Africa, Rest of Middle East & Africa), Latin America (Brazil, Argentina, Rest of Latin America) |
| Company Profiles | HERE Technologies, TomTom International BV, Mobileye Global Inc. (Intel Corporation), NVIDIA Corporation, Baidu, Inc. (Apollo), Waymo LLC, Dynamic Map Platform Co., Ltd., NavInfo Co., Ltd., AutoNavi (Alibaba Group), Zenrin Co., Ltd., Woven by Toyota, Inc., Robert Bosch GmbH, Luminar Technologies, Inc., Momenta Group, CE Info Systems Ltd. (MapmyIndia), The Sanborn Map Company, Inc., Hyundai Autoever Corp., Swift Navigation, Inc., Trimble Inc., Telenav Inc., and Others. |
Frequently Asked Questions
North America dominated the HD Maps Market in 2025, accounting for a 39.28% market share. This dominance is attributed to its advanced automotive industry, early adoption of autonomous technologies, and significant R&D investments by major players like Google, HERE Technologies, and Civil Maps.
The cloud-based deployment mode dominated the HD Maps Market by type in 2025, with a 62.45% revenue share. This is due to the growing need for real-time updates and OTA (over-the-air) map data in autonomous vehicle applications.
The major growth factor driving the HD Maps Market is the increasing integration of HD maps with autonomous driving systems, which enhances vehicle navigation, localization, and real-time decision-making capabilities.
The HD Maps Market reached USD 2.44 billion in 2025 due to growing autonomous vehicle adoption.
The market is projected to grow at 21.34% CAGR, driven by smart mobility and AV technologies.
Get in Touch
