Connected Toys Market Key Insights:
To Get More Information on Connected Toys Market - Request Sample Report
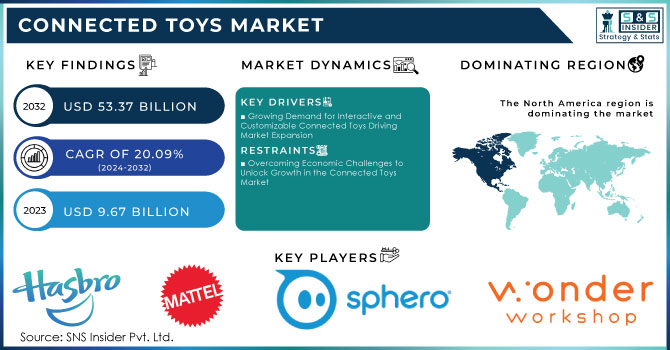
The Connected Toys Market Size was valued at USD 9.67 Billion in 2023, and is expected to reach USD 53.37 Billion by 2032, and grow at a CAGR of 20.09% over the forecast period 2024-2032.
The Connected Toys market is undergoing a significant transformation, primarily driven by an increasing demand for sustainability and eco-friendly products. Approximately a 2024 toy market survey by IndexBox noted that 45% of consumers are now prioritizing eco-friendly toys, prompting manufacturers to focus on creating products made from sustainable materials that are safe for children and environmentally responsible. Notably, brands like LEGO have reported a 15% increase in sales despite broader toy market challenges, underscoring the effectiveness of sustainable practices in attracting consumers. A survey conducted by Whole Foods Market revealed that 64% of Gen Z consumers value transparency in food sustainability, reflecting a broader trend toward ethical consumption that extends to the toy industry. Innovative companies such as Shumee, which emphasize sustainability in their production processes, are gaining traction in the market. This aligns with global efforts to foster a circular economy, as highlighted by various reports advocating for reducing waste and promoting recycling in toy design. A report by the Toy Association highlights that 88% of parents consider educational value in toys as an essential criterion for purchase decisions. As Connected Toys increasingly incorporate technology, such as programmable features and app connectivity, they are appealing to tech-savvy consumers looking for interactive and educational play experiences. The Connected Toys market is well-positioned for substantial expansion, fueled by sustainability trends, technological advancements, and evolving consumer preferences toward eco-friendly products. With continuous innovation and a commitment to responsible practices, the sector is ready to meet the changing demands of today’s environmentally conscious consumers.
Market Dynamics
Drivers
- Growing Demand for Interactive and Customizable Connected Toys Driving Market Expansion
A key driver in the Connected Toys market is the rising demand for toys that promote active engagement, creativity, and educational value. There is a significant consumer focus on toys that offer customization and hands-on interaction, reflecting a clear shift toward more interactive and developmental play experiences.
Toys that combine traditional physical play with digital interactivity—such as augmented reality (AR) features and capacitive sensing technology—are becoming increasingly popular. These innovations enhance engagement, allowing children to interact with toys in dynamic and educational ways while developing cognitive and motor skills. Furthermore, capacitive sensing technology is transforming everyday materials into interactive surfaces, adding a layer of tech-driven engagement to physical toys. Consumer research shows that 56% of parents look for toys that encourage physical creativity and customization, positioning personalized and customizable toys as a central part of the market's growth. This trend is pushing manufacturers to design toys that not only entertain but also foster long-term engagement, learning, and skill development. The shift toward interactive, customizable, and tech-enhanced Connected Toys is a significant driver of market expansion, catering to the modern consumer's desire for toys that blend creativity, learning, and technological innovation.
Restraints
- Overcoming Economic Challenges to Unlock Growth in the Connected Toys Market
While the demand for interactive and tech-enhanced toys is increasing in developed markets, developing countries often struggle with lower disposable incomes and limited access to advanced technologies. This economic disparity creates barriers for manufacturers trying to penetrate these markets, resulting in missed opportunities for growth. For instance, many families in these regions prioritize necessities over toys, leading to a gap in market penetration. Additionally, the lack of infrastructure to support advanced toy technologies further hinders adoption, as parents may be unaware of the benefits of these interactive toys. Manufacturers must navigate these challenges to expand their presence in emerging markets. To succeed, they may need to tailor their products to meet local preferences and price points, thereby making Connected Toys more accessible. Addressing these market restraints is crucial for companies looking to capitalize on the growing interest in interactive play experiences globally. By understanding and overcoming these barriers, manufacturers can better position themselves in the competitive landscape of the Connected Toys market.
Segment Analysis
By Age Group
In 2023, the Connected Toys Market saw substantial engagement from the 9-12 years age group, capturing approximately 40% of total revenue share. This segment's prominence can be attributed to several factors. At this critical developmental stage, children are honing complex thinking and problem-solving skills, making Connected Toys that facilitate intricate assembly and customization particularly beneficial for fostering creativity and STEM skills. These toys promote collaborative play, appealing to peer interactions. Additionally, this age group exhibits a growing interest in technology and interactive play; many contemporary Connected Toys feature digital elements such as augmented reality (AR) and app connectivity, resonating with their tech-savvy nature. Effective marketing strategies targeting this demographic, including social media campaigns and influencer partnerships, further enhance interest and sales, especially for brands that highlight the educational and enjoyable aspects of their products. The variety of product lines, ranging from construction sets to themed kits inspired by popular media, offers children numerous choices, encouraging repeat purchases. Moreover, Connected Toys foster social interaction and group play, aligning with parents’ recognition of the importance of social play in child development. The toy Market is experiencing a significant trend known as "kidulting," where companies like Mattel are catering to adult buyers. This shift has led to a broader market for toys, as evidenced by a remarkable 37% increase in Mattel’s sales in the last quarter, largely due to products designed for both children and adult collectors. The adult toy market has seen a 10% rise in sales, highlighting this growing consumer segment. Additionally, organizations like the UNHCR emphasize the importance of educational materials tailored for the 9-12 age group, promoting social awareness and empathy regarding global issues such as the refugee crisis. Overall, the 9-12 years age group emerges as a key driver in the Connected Toys Market, driven by their developmental needs, technological interests, and the allure of customizable play experiences.
By Interfacing Device
In 2023, the Connected Toys Market saw smartphones capture approximately 50% of the total revenue share, driven by several key factors that resonate with today's tech-savvy consumers. The widespread adoption of smartphones among children and their families has established a strong connection with Connected Toys, making them more appealing as kids are introduced to these devices from an early age. Many Connected Toys now incorporate augmented reality (AR) and interactive apps, enhancing the play experience and fostering creativity and learning. This technology allows children to visualize their creations digitally and access complementary educational content. Furthermore, parents increasingly use smartphones to monitor and engage in their children's play, enhancing the educational value of these toys and encouraging parental investment. Marketing strategies for smartphone-compatible Connected Toys often target both children and parents through digital platforms, highlighting the benefits of interactive play. Additionally, the growing demand for educational toys, particularly in the post-pandemic era, aligns with parents’ desires for products that promote cognitive development. The popularity of mobile gaming accessories, such as the Backbone One mobile controller, exemplifies this trend. Moreover, the appeal of budget-friendly VR headsets and the availability of 60% of the best stocking stuffer ideas for 2024 indicate a significant shift towards integrating advanced technology into everyday play experiences. Consequently, the smartphone segment is poised to remain a significant driver of growth in the Connected Toys Market as manufacturers continue to innovate and integrate smartphone capabilities into their offerings.
Regional Analysis
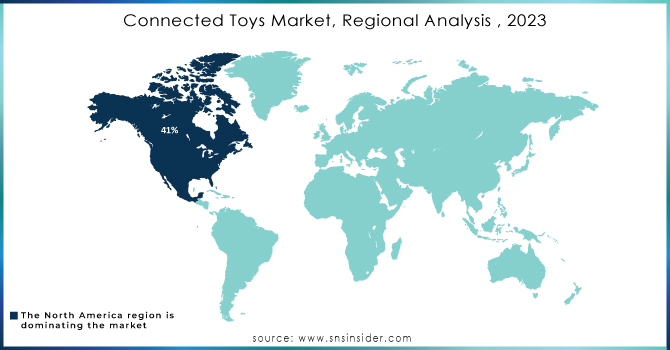
In 2023, North America dominates its position as the leading region in the Connected Toys Market, accounting for approximately 41% of total revenue. This dominance is underpinned by various factors that highlight the region's favorable economic conditions and consumer trends. The robust economy and high disposable incomes have fostered a strong appetite for innovative and educational toys, as parents increasingly recognize the significance of play in cognitive development. This demand is further amplified by the “kidulting” trend, wherein adult consumers seek nostalgic and collectible toys, driving sales. Technological integration, such as augmented reality (AR) features and mobile app connectivity enhances the play experience, appealing to both children and parents. North American manufacturers provide a diverse range of Connected Toys that cater to various age groups and interests, encouraging repeat purchases. Effective marketing strategies, including social media and influencer partnerships, resonate well with target demographics by highlighting the educational benefits of these toys. Additionally, a competitive landscape characterized by continuous innovation ensures that established brands and startups alike meet evolving consumer preferences. Overall, North America's substantial market share is a result of strong demand, technological advancements, and effective marketing, positioning it for sustained growth in the Connected Toys sector.
In 2023, the Asia Pacific region emerged as the fastest-growing market for Connected Toys, driven by demographic trends, rising disposable incomes, and a growing interest in educational and interactive play. The region's youthful population, particularly among children aged 0-12, creates a substantial customer base for Connected Toys, with families increasingly prioritizing products that foster creativity and cognitive development. Economic growth in urban areas has led to higher disposable incomes, encouraging parents to invest in quality toys that offer educational benefits, especially among the expanding middle class. Technological integration in Connected Toys resonates with the tech-savvy consumer base. Many products now feature digital components like augmented reality (AR) and app connectivity, enhancing play through interactive experiences that appeal to both children and parents. Notable companies are actively launching innovative products; for instance, LEGO has introduced Connected Toys with AR capabilities, while Bandai Namco has launched construction toys that blend traditional play with mobile app integration. Cultural influences, including social media and popular trends, further boost the visibility and desirability of these toys.
Do You Need any Customization Research on Connected Toys Market - Inquire Now
Key Players
Some of the major key Players in the Connected Toys Market with their product:
-
Hasbro (CONNECT 4)
-
Mattel (Magical Mermaid Connector Set)
-
Sony Corporation (PlayStation Shapes Collection)
-
Sphero, Inc. (Sphero Mini)
-
Spin Master (Kinetic Sand)
-
The LEGO Group (LEGO Technic)
-
UBTECH ROBOTICS CORP LTD (Jimu Robot)
-
VTech Electronics North America, LLC (Switch & Go Dinos)
-
Wonder Workshop, Inc. (Dash Robot)
-
WowWee Group Limited (MiP Robot)
-
Fisher-Price (Bright Beats Dance & Move BeatBo)
-
Educational Insights (Design & Drill Activity Center)
-
K'NEX (K'NEX Thrill Rides Roller Coaster Building Set)
-
Playmobil (Playmobil 1.2.3 Connector Sets)
-
GoldieBlox (GoldieBlox and the Builder’s Survival Kit)
-
ZURU (Bunch O Balloons)
-
Tinkercad (Tinkercad Connectors)
-
GUND (Disney x GUND Plush Toys)
-
Playmates Toys Limited (POWER RANGERS Connector Figures)
-
LittleBits (LittleBits Electronics Kits)
List of suppliers specifically focusing on Connected Toys that involve devices and technology:
-
Sphero, Inc.
-
UBTECH ROBOTICS CORP LTD
-
Wonder Workshop, Inc.
-
VTech Electronics North America, LLC
-
LittleBits
-
Playmates Toys Limited
-
WowWee Group Limited
-
K'NEX
-
Fisher-Price
-
SmartGurlz
Recent Developments
-
In September 2024, GUND, a Spin Master company, partnered with Disney to launch a new collection featuring iconic Disney characters, merging GUND's design with Disney imagery for a unique plush toy experience.
-
In July 2024, Sony Interactive Entertainment Europe collaborated with Spin Master to unveil The Shapes Collection, showcasing collectibles based on popular PlayStation titles like God of War Ragnarök and Horizon Forbidden West.
-
In April 2024, Hasbro announced a licensing agreement with Playmates Toys Limited to produce and distribute POWER RANGERS products, focusing on the iconic MIGHTY MORPHIN POWER RANGERS series for children, set to launch in 2025.
| Report Attributes | Details |
|---|---|
| Market Size in 2023 | USD 9.67 Billion |
| Market Size by 2032 | USD 53.37 Billion |
| CAGR | CAGR of 20.09% From 2024 to 2032 |
| Base Year | 2023 |
| Forecast Period | 2024-2032 |
| Historical Data | 2020-2022 |
| Report Scope & Coverage | Market Size, Segments Analysis, Competitive Landscape, Regional Analysis, DROC & SWOT Analysis, Forecast Outlook |
| Key Segments | • By Age Group (1-5 years 6-8 years, 9-12 years, 13-19 years) • By Interfacing Device (Smartphones, Tablet, PCs, Laptop) • By Application (Education, Entertainment) • By Distribution Channel (Online Stores, Supermarket, Hypermarket, Specialty Toy Shops, Other Shops) |
| Regional Analysis/Coverage | North America (US, Canada, Mexico), Europe (Eastern Europe [Poland, Romania, Hungary, Turkey, Rest of Eastern Europe] Western Europe] Germany, France, UK, Italy, Spain, Netherlands, Switzerland, Austria, Rest of Western Europe]), Asia-Pacific (China, India, Japan, South Korea, Vietnam, Singapore, Australia, Rest of Asia-Pacific), Middle East & Africa (Middle East [UAE, Egypt, Saudi Arabia, Qatar, Rest of Middle East], Africa [Nigeria, South Africa, Rest of Africa], Latin America (Brazil, Argentina, Colombia, Rest of Latin America) |
| Company Profiles | Hasbro, Mattel, Sony Corporation, Sphero, Inc., Spin Master, The LEGO Group, UBTECH ROBOTICS CORP LTD, VTech Electronics North America, LLC, Wonder Workshop, Inc., WowWee Group Limited, Fisher-Price, Educational Insights, K'NEX, Playmobil, GoldieBlox, ZURU, Tinkercad, GUND, Playmates Toys Limited, and LittleBits are all key players in the connector toys market. |
| Key Drivers | • Growing Demand for Interactive and Customizable Connected Toys Driving Market Expansion |
| RESTRAINTS | • Overcoming Economic Challenges to Unlock Growth in the Connected Toys Market |
Frequently Asked Questions
Ans: North America dominated the Connected Toys Market in 2023.
Ans: The 9-12 segment dominated the Connected Toys Market.
Ans: The major growth factor of the Connected Toys Market is the increasing integration of advanced technologies like AI and IoT to enhance interactive and educational play experiences.
Ans: The Connected Toys Market Size was valued at USD 9.67 Billion in 2023, and is expected to reach USD 53.37 Billion by 2032, and grow at a CAGR of 20.09% over the forecast period 2024-2032.
Ans: The Connected Toys Market grow at a CAGR of 20.09% over the forecast period of 2024-2032.
Get in Touch
