Healthcare Business Intelligence (BI) Market Report Scope & Overview:
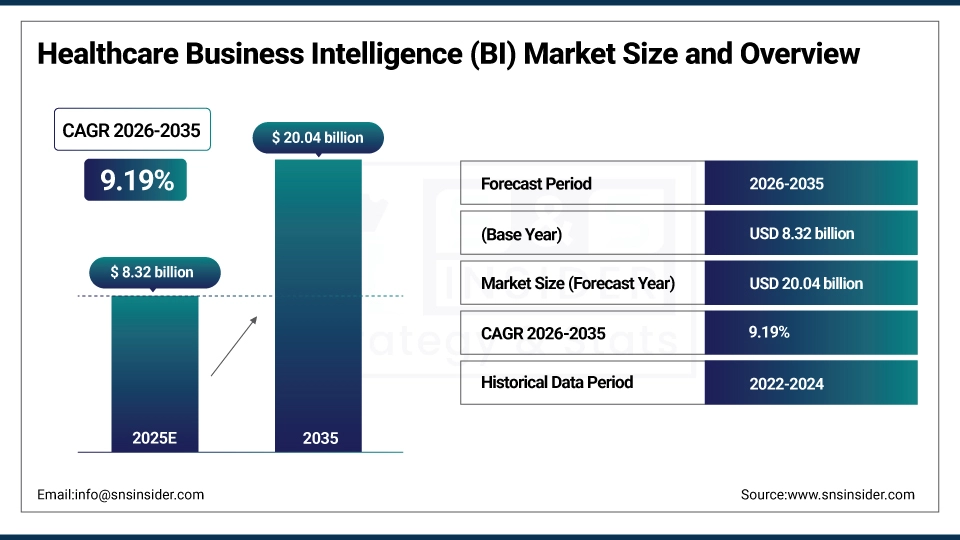
The Healthcare Business Intelligence (BI) Market size is estimated at USD 8.32 billion in 2025 and is expected to reach USD 20.04 billion by 2035, growing at a CAGR of 9.19% over the forecast period of 2026-2035.
The global healthcare business intelligence market trend is a growing demand for data analytics solutions such as predictive analytics platforms, clinical decision support systems, and performance management tools as the growth of the market is driven by increasing healthcare data volume, regulatory requirements for quality reporting, and healthcare organization focus on operational efficiency improvement. This trend is also driven by a growing adoption of value-based care models and the growing focus on data-driven decision making as healthcare providers become more focused on improving patient outcomes and are more willing to invest in advanced analytics technologies, resulting in growth in the domestic and international market for cloud-based and on-premise business intelligence solutions.
For instance, in March 2024, growing awareness and improved data infrastructure drove a 29% increase in healthcare BI platform adoption for hospital systems in North America, boosting clinical analytics and financial performance monitoring capabilities.
Healthcare Business Intelligence (BI) Market Size and Forecast:
-
Market Size in 2025: USD 8.32 billion
-
Market Size by 2035: USD 20.04 billion
-
CAGR: 9.19% from 2026 to 2035
-
Base Year: 2025
-
Forecast Period: 2026–2035
-
Historical Data: 2022–2024
To Get more information On Healthcare Business Intelligence (BI) Market - Request Free Sample Report
Healthcare Business Intelligence (BI) Market Trends
-
Healthcare BI solutions are being adopted because healthcare organizations demand real-time data visualization, predictive analytics capabilities, and integrated reporting dashboards for strategic planning.
-
Customized analytics platforms based on specialty areas, organizational size, and regulatory compliance needs to improve healthcare delivery outcomes.
-
The development of AI-powered analytics engines, machine learning algorithms, and natural language processing to improve the accuracy of clinical insights and reduce manual data analysis burden.
-
Advanced data integration capabilities, population health management tools, and real-time performance monitoring are all available to ensure continuous quality improvement and operational excellence.
-
Increased demand for cloud-based BI platforms, mobile analytics applications and self-service analytics tools to help data accessibility and collaborative decision-making.
-
Collaboration between healthcare providers, technology vendors and EHR system developers to develop integrated BI platforms and improve data interoperability standards.
-
CMS, ONC and HHS promoting standards for quality reporting, MACRA compliance, value-based payment models, and patient outcome measurement requirements.
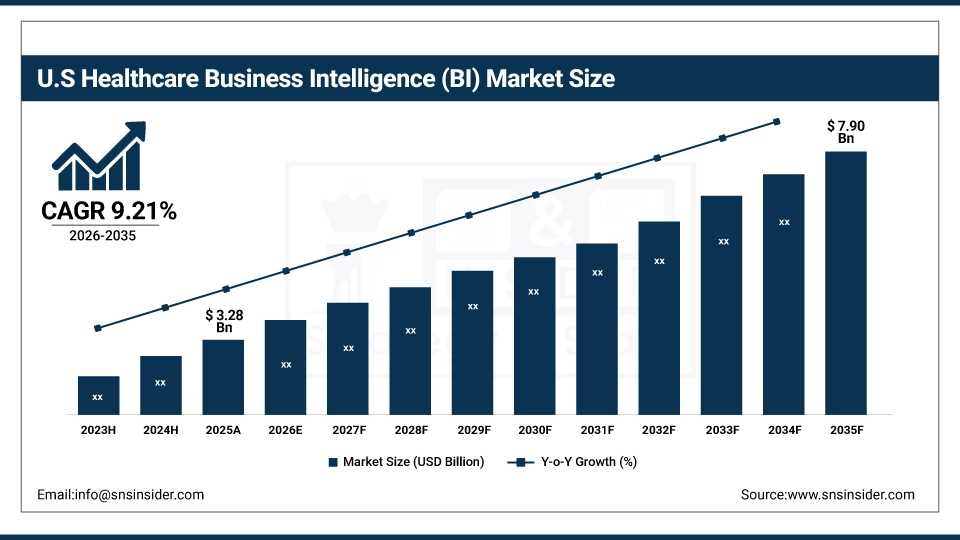
The U.S. Healthcare Business Intelligence Market is estimated at USD 3.28 billion in 2025 and is expected to reach USD 7.90 billion by 2035, growing at a CAGR of 9.21% from 2026-2035. The United States represents the largest market for healthcare business intelligence, primarily driven by the mandatory quality reporting requirements, federal regulations for healthcare analytics, and well-developed healthcare IT infrastructure. Government incentives, high levels of healthcare technology investment, and increased provider and payer spending on data analytics help to drive growth in the market. Also, the U.S. is the largest regional market in the world, due to the regulatory support and swift adoption of cloud-based and predictive analytics solutions.
Healthcare Business Intelligence (BI) Market Growth Drivers:
-
Value-Based Care Adoption and Quality Reporting Requirements are Driving the Healthcare Business Intelligence Market Growth
Value-based care adoption and quality reporting requirements take the center stage as a growth driver for the healthcare business intelligence market share, and are driven by the implementation of MACRA guidelines, MIPS reporting standards, and CMS quality payment programs for increased performance measurement and outcome-based reimbursement. These solutions for healthcare quality improvement and cost optimization are driving the base of the market, the penetration of cloud-based & on-premise markets, and adding to the overall market share globally.
For instance, in June 2024, cloud-based and AI-powered healthcare BI solutions accounted for ~71% of the total U.S. healthcare analytics technology investments, reflecting growing institutional preference and expanding market share.
Healthcare Business Intelligence (BI) Market Restraints:
-
Data Integration Complexity and Interoperability Challenges are Hampering the Healthcare Business Intelligence Market Growth
Data integration complexity & interoperability challenges of healthcare BI systems also restrict the healthcare business intelligence market growth, as a large number of healthcare organizations face difficulties connecting disparate data sources, legacy systems, and incompatible data formats. This might lead to incomplete analytics, limited data accuracy, and reduced return on investment for healthcare technology implementations. As a result, decision-making quality suffers, and market growth is stunted in regions where healthcare IT infrastructure maturity is limited and data standardization efforts are insufficient.
Healthcare Business Intelligence (BI) Market Opportunities:
-
AI Integration and Predictive Analytics Drive Future Growth Opportunities for the Healthcare Business Intelligence Market
The opportunity in the AI integration and predictive analytics in healthcare business intelligence market is in the form of automated patient risk stratification, clinical outcome prediction, and resource utilization forecasting. These solutions provide for early disease detection, individualized treatment pathway recommendations, and real-time operational efficiency monitoring. Through enhanced clinical decision support, population health management, and cost containment strategies, particularly in areas with chronic disease management needs, these technologies may improve patient outcomes, decrease hospital readmissions, and expand the market.
For instance, in April 2024, the Healthcare Information and Management Systems Society reported that 76% of U.S. healthcare organizations implemented advanced BI platforms, highlighting rising technology adoption and increasing demand for data-driven decision support tools.
Healthcare Business Intelligence (BI) Market Segment Analysis
-
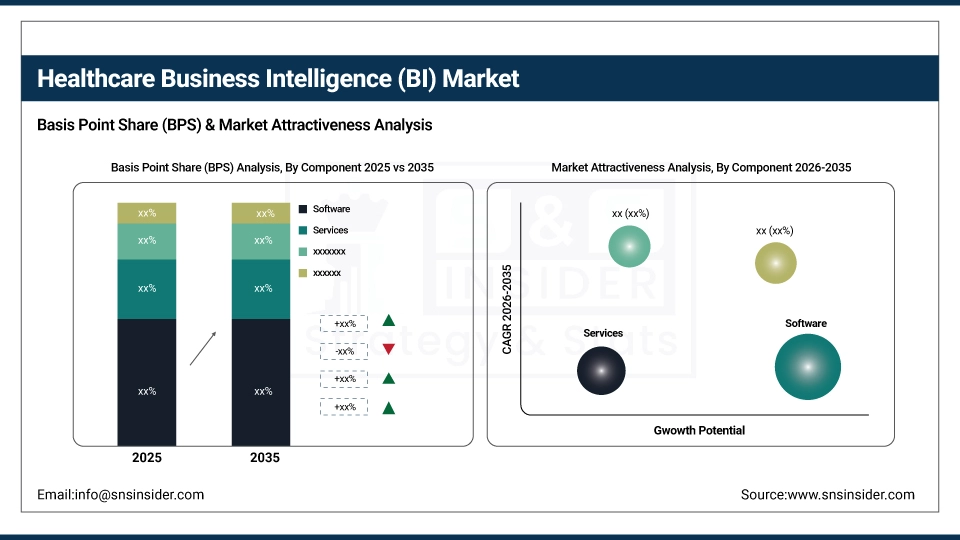
By component, software held the largest share of around 59.47% in 2025E, and the services segment is expected to register the highest growth with a CAGR of 9.68%.
-
By mode of delivery, the cloud-based segment dominated the market with approximately 54.82% share in 2025E, while the hybrid is expected to register the highest growth with a CAGR of 10.34%.
-
By end user, providers accounted for the leading share of nearly 48.73% in 2025E, and is expected to register the highest growth with a CAGR of 9.43%.
By Component, Software Leads the Market, While Services Registers Fastest Growth
The software segment accounted for the highest revenue share of approximately 59.47% in 2025, owing to comprehensive analytics capabilities, customizable dashboard features, and essential data visualization functionality for healthcare organizations. Emerging trends, including increasing requirements for integrated analytics platforms and regulatory emphasis on quality measurement tools. In comparison, the services segment is anticipated to achieve the highest CAGR of nearly 9.68% during the 2026–2035 period, driven by the increasing demand for implementation support, data migration services, and ongoing system optimization. Drivers include rising complexity of BI deployments, the preference for professional consulting expertise, and training requirements.
By Mode of Delivery, the Cloud-Based Segment dominates, while the Hybrid Segment Shows Rapid Growth
By 2025, the cloud-based segment contributed the largest revenue share of 54.82% due to its scalability, reduced infrastructure costs and automatic software updates. Growing adoption of Software-as-a-Service models coupled with data accessibility requirements, healthcare organizations are increasingly implementing cloud-hosting services. The hybrid segment is projected to grow at the highest CAGR of about 10.34% between 2026 and 2035 due to the growing need for balancing data security with cloud flexibility and compliance requirements management. Some of the reasons include sensitive data protection concerns, better control over critical information, and large healthcare systems' preference for mixed deployment architectures.
By End User, Providers Lead, and Registers Fastest Growth
The providers segment accounted for the largest share of the healthcare business intelligence market with about 48.73%, owing to their direct patient care responsibilities, quality reporting obligations, and operational efficiency improvement needs. Reasons driving the healthcare provider segment include increasing patient volume management requirements and clinical outcome measurement mandates. In addition, it is slated to grow at the fastest rate with a CAGR of around 9.43% throughout the forecast period of 2026–2035, as hospitals, clinics, and physician practices seek comprehensive analytics platforms, value-based reimbursement optimization tools, and population health management capabilities. Increased focus on care coordination and patient satisfaction improvement contribute to their adoption, while improved financial performance and reduced operational costs drive continued investment.
Healthcare Business Intelligence (BI) Market Regional Highlights:
North America Healthcare Business Intelligence Market Insights:
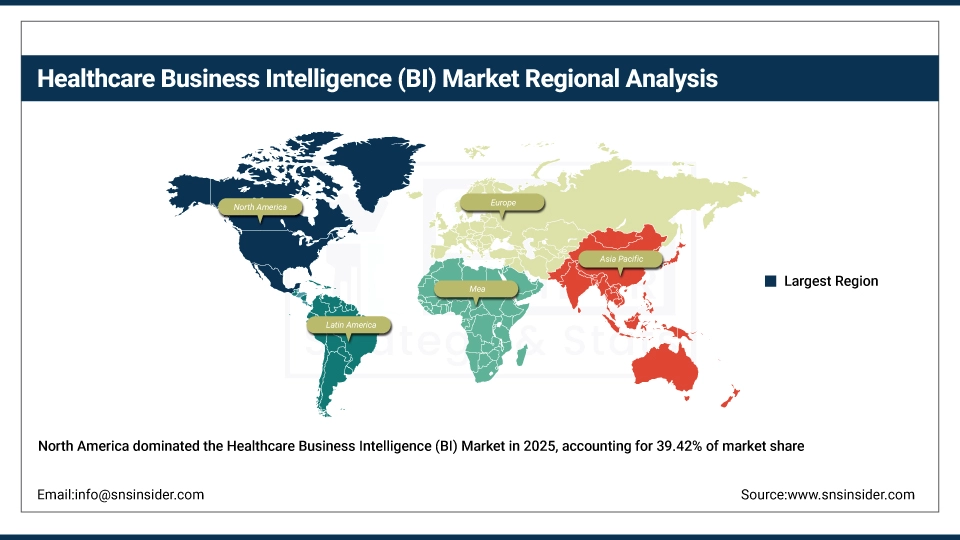
North America held the largest revenue share of over 39.42% in 2025 of the healthcare business intelligence market due to an established healthcare analytics ecosystem, stringent quality reporting requirements, and increased healthcare provider awareness regarding the benefits of data-driven decision making. Drivers include ubiquitous use of electronic health records, an advanced healthcare IT environment, growing healthcare data volume and greater acceptance of predictive analytics stemming from value-based care implementation. At the same time, various government initiatives, MIPS reporting requirements and enormous investments in healthcare analytics from providers and payers are anchoring healthcare BI software and services in the market, and ensuring multibillion dollar revenues around the world.
Get Customized Report as per Your Business Requirement - Enquiry Now
Asia Pacific Healthcare Business Intelligence Market Insights:
Asia Pacific is the fastest-growing segment in the healthcare business intelligence market with a CAGR of 10.87%, as the awareness about data-driven healthcare management, government digital health initiatives, and healthcare infrastructure modernization in developing nations is growing. Factors including rapid healthcare digitization, rising medical tourism with quality reporting needs, and growing adoption of international healthcare standards are stimulating the market growth. Cloud technology implementation and mobile health analytics have been instrumental in improving healthcare delivery efficiency, especially in countries with expanding healthcare systems. Public-private partnerships and government healthcare reforms also help in advancing data analytics capabilities and digital transformation. Increase in demand in Asia Pacific region owing to rising healthcare expenditure against historical spending levels and growing affordability and accessibility of cloud-based analytics platforms.
Europe Healthcare Business Intelligence Market Insights:
The healthcare business intelligence market in Europe is the second-dominating region after North America on account of an increase in the adoption of integrated care models, robust data protection regulations including GDPR, and increasing healthcare quality improvement initiatives across national health systems. Rising implementation of digital health strategies, advanced clinical analytics adoption, favorable government funding for health informatics projects, and cross-border healthcare data exchange directives are also contributing to the sustained growth of the market in leading European countries.
Latin America (LATAM) and Middle East & Africa (MEA) Healthcare Business Intelligence Market Insights:
In Latin America, and Middle East & Africa, the growing healthcare sector modernization and increase in healthcare IT infrastructure investment with quality improvement initiatives support the healthcare business intelligence market growth. The rising popularity of affordable cloud-based analytics solutions and regional data analytics capabilities, along with international healthcare provider expansion, will aid healthcare efficiency and clinical decision support. The increasing healthcare quality awareness and improving technology adoption in these regions are continuing to encourage market growth.
Healthcare Business Intelligence (BI) Market Competitive Landscape:
IBM Corporation (est. 1911) is a leading technology and consulting company that focuses on integrated healthcare analytics solutions for clinical and operational excellence. It uses its comprehensive Watson Health platform and advanced AI capabilities to produce cutting-edge business intelligence technology with seamless healthcare workflow integration.
-
In February 2025, it expanded its healthcare BI platform capabilities with AI-driven predictive analytics and population health management tools, aiming to improve clinical decision support and operational efficiency across its healthcare provider network.
Oracle Corporation (est. 1977) is a well-known global enterprise software company focused on database management, healthcare information technology, and analytics solutions. It invests in comprehensive BI platforms and cloud-based healthcare analytics with the hopes of revolutionizing healthcare data management with secure, scalable, and integrated business intelligence tools.
-
In May 2024, launched an enhanced cloud-based healthcare BI solution featuring real-time clinical analytics and integrated financial performance dashboards across global healthcare markets, enhancing data accessibility, strategic planning, and quality measurement capabilities.
Microsoft Corporation (est. 1975) is a leading technology provider in the fields of cloud computing, enterprise software, and healthcare solutions. The company's healthcare BI product portfolio focuses on Power BI integration and Azure cloud capabilities, and features a strong commitment to data security and continuous innovation to complement the strong market presence in both hospital and health system settings.
-
In September 2024, introduced advanced healthcare analytics and machine learning-based predictive modeling features for its Microsoft Cloud for Healthcare platform, strengthening clinical intelligence capabilities and expanding adoption among large hospital networks.
Healthcare Business Intelligence (BI) Market Key Players:
-
IBM Corporation
-
Oracle Corporation
-
Microsoft Corporation
-
SAP SE
-
SAS Institute Inc.
-
Tableau Software (Salesforce)
-
Qlik Technologies Inc.
-
MicroStrategy Incorporated
-
Sisense Inc.
-
TIBCO Software Inc.
-
Information Builders (ILOG)
-
Infor, Inc.
-
Yellowfin International Pty Ltd.
-
Domo, Inc.
-
Dimensional Insight, Inc.
-
Health Catalyst
-
Definitive Healthcare
-
Optum (UnitedHealth Group)
-
Cerner Corporation (Oracle Health)
-
Epic Systems Corporation
-
Allscripts Healthcare Solutions
-
IQVIA Holdings Inc.
-
Alteryx, Inc.
-
Board International
-
Jedox AG
| Report Attributes | Details |
|---|---|
| Market Size in 2025 | USD 8.32 Billion |
| Market Size by 2035 | USD 20.04 Billion |
| CAGR | CAGR of 9.19% From 2026 to 2035 |
| Base Year | 2025 |
| Forecast Period | 2026-2035 |
| Historical Data | 2022-2024 |
| Report Scope & Coverage | Market Size, Segments Analysis, Competitive Landscape, Regional Analysis, DROC & SWOT Analysis, Forecast Outlook |
| Key Segments | •By Component (Software, Services) •By Mode of Delivery (On-premise, Cloud-based, Hybrid) •By Application (Financial Analysis, Operational Analysis, Clinical Analysis, Patient Care) •By End-use (Payers, Providers, Healthcare Manufacturers) |
| Regional Analysis/Coverage | North America (US, Canada, Mexico), Europe (Eastern Europe [Poland, Romania, Hungary, Turkey, Rest of Eastern Europe] Western Europe] Germany, France, UK, Italy, Spain, Netherlands, Switzerland, Austria, Rest of Western Europe]), Asia Pacific (China, India, Japan, South Korea, Vietnam, Singapore, Australia, Rest of Asia Pacific), Middle East & Africa (Middle East [UAE, Egypt, Saudi Arabia, Qatar, Rest of Middle East], Africa [Nigeria, South Africa, Rest of Africa], Latin America (Brazil, Argentina, Colombia, Rest of Latin America) |
| Company Profiles | IBM Corporation, Oracle Corporation, Microsoft Corporation, SAP SE, SAS Institute Inc., Tableau Software (Salesforce), Qlik Technologies Inc., MicroStrategy Incorporated, Sisense Inc., TIBCO Software Inc., Information Builders (ILOG), Infor, Inc., Yellowfin International Pty Ltd., Domo, Inc., Dimensional Insight, Inc., Health Catalyst, Definitive Healthcare, Optum (UnitedHealth Group), Cerner Corporation (Oracle Health), Epic Systems Corporation, Allscripts Healthcare Solutions, IQVIA Holdings Inc., Alteryx, Inc., Board International, Jedox AG |
Frequently Asked Questions
Ans: The Healthcare Business Intelligence (BI) Market is expected to grow at a CAGR of 9.19% over the forecast period.
Ans: The Healthcare Business Intelligence (BI) Market size was USD 8.32 billion in 2025 and is expected to reach USD 20.04 billion by 2035.
Ans: Value-Based Care Adoption and Quality Reporting Requirements are Driving the Healthcare Business Intelligence Market Growth.
Ans: The U.S. Healthcare Business Intelligence Market is estimated at USD 3.28 billion in 2025 and is expected to reach USD 7.90 billion by 2035.
Ans: North America dominated the Healthcare Business Intelligence (BI) Market in 2025.
Get in Touch
