Hydration Containers Market Report Scope And Overview:
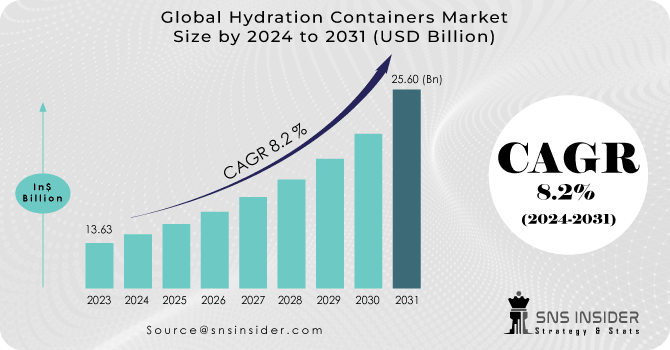
The Hydration Containers Market Size was valued at USD 13.63 billion in 2023 and is expected to reach USD 25.60 billion by 2031 and grow at a CAGR of 8.2 % over the forecast period 2024-2031.
The growth of the hydration containers market in the upcoming years is expected to be driven by manufacturers focusing on providing packaging alternatives that avoid single-use plastics. Government directives limiting plastic-based products are also anticipated to contribute to market growth. The increasing prevalence of sporting events and outdoor activities is predicted to further boost the demand for hydration containers. However, the market might face challenges due to rising manufacturing costs for certain types of containers.
Get More Information on Hydration Containers Market - Request Sample Report
Despite this, the market is likely to benefit from consumer acceptance of lightweight and user-friendly liquid packaging solutions, creating new opportunities for expansion. Concerns about the use of low-quality materials in container production for increased profit margins could present challenges in the future. Key industry drivers include the growing popularity of outdoor activities and effective manufacturer promotional strategies such as targeted marketing, product design, and increased shelf space for leading retail brands.
MARKET DYNAMICS
KEY DRIVERS:
-
Market growth stimulated by growing awareness and user friendly packaging solutions
The shift away from single-use plastic bottles towards more sustainable and reusable hydration containers is a significant driver. This change is fuelled by heightened environmental awareness and regulatory actions aimed at reducing plastic waste.
-
Increased disposable income has led consumers to allocate more funds towards convenience products.
RESTRAIN:
-
Low-quality alternatives being readily accessible pose a challenge in the market.
-
The increased price might discourage certain customers from buying hydration containers.
OPPORTUNITY:
-
Advancements in innovation and continuous product development are driving forces behind the evolution of industries.
-
Environmental considerations have impacted market demand.
Increasing environmental awareness is driving a transition towards reusable hydration containers, as consumers seek sustainable alternatives to single-use plastic bottles. Sustainability is becoming a priority for many, shaping their choices in hydration products. Environmental concerns are playing a significant role in shaping consumer preferences and impacting the hydration containers market. With a growing understanding of the environmental consequences of single-use plastics and a rising emphasis on sustainable living, there is a rising demand for eco-friendly hydration solutions.
CHALLENGES:
-
Rapid shifts in consumer preferences and trends can pose a challenge for companies to keep up with in terms of product design and features.
Impact of Russia Ukraine War
The Russia-Ukraine war has introduced significant challenges to the Hydration Containers Market. The conflict has the potential to disrupt supply chains, leading to increased costs for raw materials and logistical difficulties. The geopolitical tensions may also contribute to fluctuations in currency exchange rates, impacting global trade dynamics within the hydration container market. These disruptions pose challenges for manufacturers and distributors, affecting the industry's supply chain stability and potentially influencing pricing structures. Overall, the war has introduced uncertainties and complexities that can impact various aspects of the hydration container market.
Impact of Economic Slowdown
Economic uncertainties can influence consumer spending behaviour, leading to a potential decrease in discretionary purchases, including premium hydration containers. The slowdown may result in reduced consumer confidence and willingness to invest in non-essential products. Additionally, the economic downturn could affect production costs and supply chain dynamics for hydration container manufacturers, potentially leading to challenges in maintaining competitive pricing. Overall, the economic slowdown poses challenges in terms of consumer demand, production costs, and market competitiveness within the hydration container industry.
KEY MARKET SEGMENTS
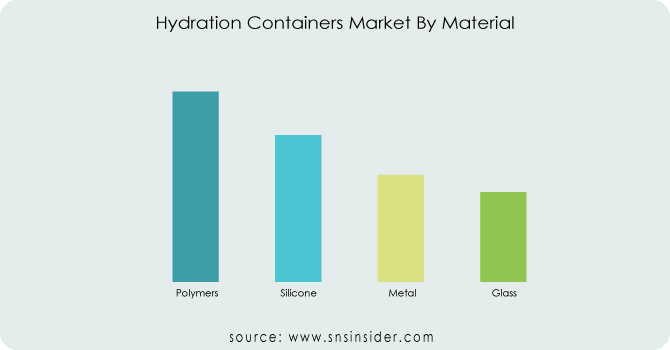
By Material
-
Polymers
-
Silicone
-
Metal
-
Glass
Polymer remains dominant in the hydration container market due to its affordability and convenience, with lightweight designs favoured for everyday use. Metal options like stainless steel offer durability, while glass appeals to eco-conscious consumers. Silicone bottles gain popularity for flexibility and safety. Market growth is bolstered by rising awareness and health concerns, driving industry adoption of alternative materials.
Get Customized Report as per Your Business Requirement - Request For Customized Report
By Product Type
-
Water Bottles
-
Cans
-
Shakers
-
Tumblers
-
Mason Jars
-
Others
Hydration containers, designed for water and beverage storage on-the-go, are gaining popularity thanks to rising health awareness and the demand for sustainable alternatives to disposable plastic bottles. This trend is driving revenue growth in the Hydration Containers Market.
By Capacity
-
Up to 20 oz
-
21-40 oz
-
41-60 oz
-
Above 60 oz
The up to 20 oz segment is popular in the hydration container market, favored for its small, lightweight design suitable for daily use and activities like commuting and exercising. It also includes kid-friendly options with colorful designs. On the other hand, the above 60 oz segment appeals to consumers needing larger water capacity for activities like hiking and camping, as well as group events. However, the 21-40 oz and 41-60 oz segments are less popular.
By Distribution Channel
-
Online
-
Direct Sales
-
Retailers
The retailers sector remains pivotal in the hydration container market, spanning specialty stores, department stores, supermarkets/hypermarkets, and outdoor retailers. These outlets provide consumers with a wide range of hydration containers, allowing them to compare and select products based on their preferences. Seasonal discounts, bundle deals, and promotions offered by retailers attract price-sensitive consumers. This sector's substantial market share is attributed to its ability to cater to consumers who prefer in-person shopping experiences.
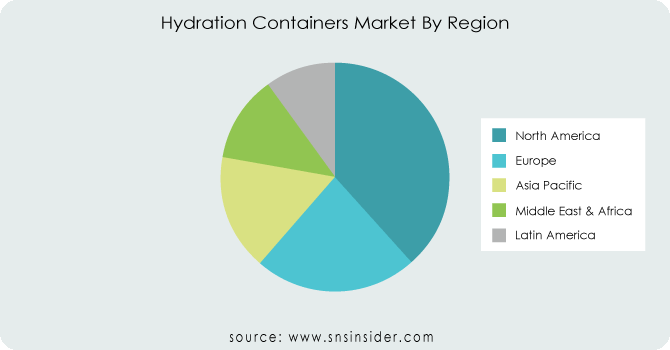
REGIONAL ANALYSIS
North America leads the Hydration Containers market due to heightened health awareness and active lifestyles. The region's demand is driven by specialized containers for athletes and outdoor enthusiasts, favored for their convenience. North Americans value on-the-go solutions, making portable hydration containers popular. Additionally, rising environmental consciousness fuels the adoption of reusable options, reducing reliance on single-use plastics.
Europe ranks second in the Hydration Containers market, driven by a focus on health, outdoor activities, and sports. Established brands and manufacturers bolster market growth, with the UK, Germany, and France leading in market share. Meanwhile, the Asia-Pacific region emerges as the fastest-growing market, fueled by urbanization, rising incomes, and a growing interest in health and outdoor pursuits. China leads in market share, with India showing rapid growth.
REGIONAL COVERAGE:
North America
-
US
-
Canada
-
Mexico
Europe
-
Eastern Europe
-
Poland
-
Romania
-
Hungary
-
Turkey
-
Rest of Eastern Europe
-
-
Western Europe
-
Germany
-
France
-
UK
-
Italy
-
Spain
-
Netherlands
-
Switzerland
-
Austria
-
Rest of Western Europe
-
Asia Pacific
-
China
-
India
-
Japan
-
South Korea
-
Vietnam
-
Singapore
-
Australia
-
Rest of Asia Pacific
Middle East & Africa
-
Middle East
-
UAE
-
Egypt
-
Saudi Arabia
-
Qatar
-
Rest of Middle East
-
-
Africa
-
Nigeria
-
South Africa
-
Rest of Africa
-
Latin America
-
Brazil
-
Argentina
-
Colombia
-
Rest of Latin America
Key players
Some of the major players in the Hydration Containers Market are CamelBak Products, Brita GmbH, Klean Kanteen, Tupperware Brands Corporation, Contigo, Aquasana, Nathan Sports, Nalgen Nunc International, Cascade Designs, HydraPak and other players.
CamelBak Products -Company Financial Analysis
RECENT TRENDS
-
In November 2022, Nalgene launched a fresh series of reusable water bottles crafted from plant-derived materials such as sugarcane and corn. These BPA-free bottles are engineered to offer durability and longevity.
-
In July 2022, Hydro Flask revealed its collaboration with the National Park Foundation to introduce a special collection of water bottles showcasing designs inspired by national parks. A percentage of sales from each bottle will go towards supporting the National Park Foundation.
-
In March 2022, Brita launched a fresh range of water bottles equipped with built-in filters capable of eliminating chlorine, odors, and other impurities found in tap water. Available in different sizes and colors, these bottles are specifically designed for convenient hydration on the go.
| Report Attributes | Details |
|---|---|
| Market Size in 2023 | US$ 13.63 Billion |
| Market Size by 2031 | US$ 25.60 Billion |
| CAGR | CAGR of 8.2 % From 2024 to 2031 |
| Base Year | 2023 |
| Forecast Period | 2024-2031 |
| Historical Data | 2020-2022 |
| Report Scope & Coverage | Market Size, Segments Analysis, Competitive Landscape, Regional Analysis, DROC & SWOT Analysis, Forecast Outlook |
| Key Segments | • By Material (Polymers, Silicone, Metal, Glass) • By Product Type (Water Bottles, Cans, Shakers, Tumblers, Mason Jars, Others) • By Capacity (Up To 20 Oz, 21-40 Oz, 41-60 Oz, Above 60 Oz) • By Distribution Channel (Online, Direct Sales, Retailers) |
| Regional Analysis/Coverage | North America (US, Canada, Mexico), Europe (Eastern Europe [Poland, Romania, Hungary, Turkey, Rest of Eastern Europe] Western Europe] Germany, France, UK, Italy, Spain, Netherlands, Switzerland, Austria, Rest of Western Europe]), Asia Pacific (China, India, Japan, South Korea, Vietnam, Singapore, Australia, Rest of Asia Pacific), Middle East & Africa (Middle East [UAE, Egypt, Saudi Arabia, Qatar, Rest of Middle East], Africa [Nigeria, South Africa, Rest of Africa], Latin America (Brazil, Argentina, Colombia, Rest of Latin America) |
| Company Profiles | CamelBak Products, Brita GmbH, Klean Kanteen, Tupperware Brands Corporation, Contigo, Aquasana, Nathan Sports, Nalgen Nunc International, Cascade Designs, HydraPak |
| Key Drivers | • Market growth stimulated by growing awareness and user friendly packaging solutions • Increased disposable income has led consumers to allocate more funds towards convenience products. |
| Challenges | • Rapid shifts in consumer preferences and trends can pose a challenge for companies to keep up with in terms of product design and features. |
Frequently Asked Questions
The North America region held the largest market share and will continue to dominate the market.
Low-quality alternatives being readily accessible pose a challenge in the market.
Market growth stimulated by growing awareness and user friendly packaging solutions.
The Hydration Containers Market size was USD 13.63 billion in 2023 and is expected to Reach USD 25.60 billion by 2031.
The Hydration Containers Market is expected to grow at a CAGR of 8.2%.
Get in Touch
