Hydraulic Workover Unit Market Report Scope & Overview:
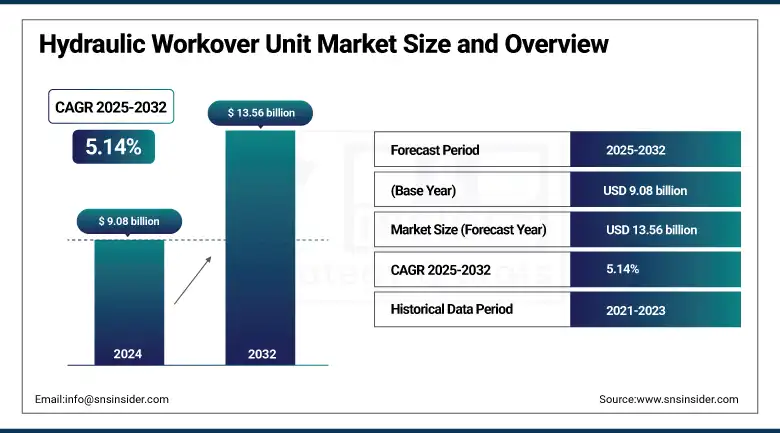
The Hydraulic Workover Unit Market size was valued at USD 9.08 billion in 2024 and is expected to reach USD 13.56 billion by 2032, growing at a CAGR of 5.14% over the forecast period of 2025-2032.
The Global Hydraulic Workover Unit Market is growing at a steady rate and is estimated to grow at a moderate CAGR during the forecast period, owing to the rising requirement for efficient well intervention and maintenance operations in onshore and offshore oilfields. Hydraulic workover units (HWUs) are agile, inexpensive alternatives to traditional drilling rigs that have been used for decades for many types of well servicing, completions, and plug and abandonment operations. The flexibility of these units, combined with their relatively small footprint, makes HWUs especially valuable for use in mature oilfields, where space is limited and cost efficiency is essential. Apart from the basic requirement of keeping the operational activity of newly discovered shale and tight oil reserves, making a perennial requirement of well maintenance, the hydraulic workover unit industry has seen the energy demand due to the upturn in recent years.
To Get more information On Hydraulic Workover Unit Market - Request Free Sample Report
The Hydraulic Workover Unit Market Trends include increasing demand for trailer-mounted and skid-mounted units for enhanced mobility and operational flexibility, increasing demand for automated and remote-controlled systems for improved safety and efficiency. Rising use of digital support integration along with increasing technological advanced capabilities are assisting in the large expansion of Hydraulic Workover Unit Market Trends in high-pressure, high-temperature (HPHT) environments. Most of the top Hydraulic Workover Unit Companies also mentioned that the company has been focusing on R&D and strategic alliances to extend its portfolio and global footprint. To sum up, the hydraulic workover unit market growth is driven by demand for sustainable oil recovery, economically focused innovations, and safety-driven products.
In June 2025, Wellbore Integrity Solutions (WIS) successfully performed a 13.375 casing section milling job in Spain using a Hydraulic Workover Unit. The operation covered 200 ft in a single trip without safety incidents or non-productive time. WIS’s TruEdge inserts showed only 40% wear, highlighting efficiency and durability.
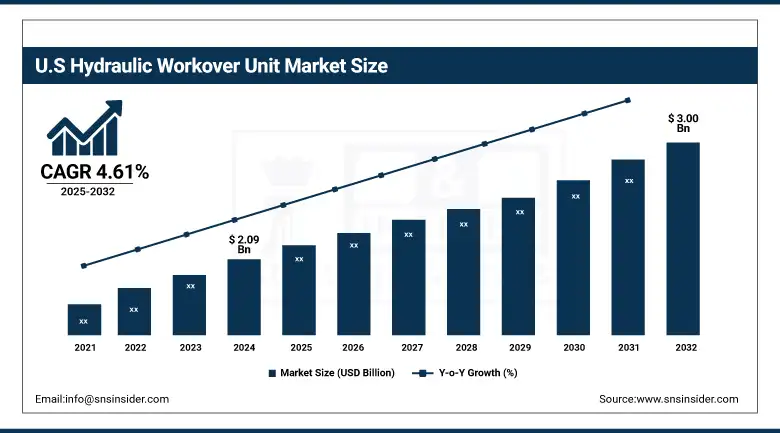
The U.S. Hydraulic Workover Unit market is expected to grow from USD 2.09 billion in 2024 to USD 3.00 billion by 2032, at a CAGR of 4.61%. Growth is driven by increased shale gas production, well maintenance activities, and the adoption of advanced intervention technologies. The U.S. remains the largest contributor in North America due to its vast upstream oil and gas operations.
Hydraulic Workover Unit Market Dynamics:
Drivers:
-
Surging Global Energy Demand Fuels Hydraulic Workover Unit Adoption Across Oil & Gas Operations
Rising global energy demand, driven by rapid urbanization, industrialization, and population growth, especially in developing economies, is significantly propelling the need for oil and gas resources. This increase is boosting exploration and production activity, leading to high demand for Hydraulic Workover Units (HWUs) used in well maintenance, intervention, and optimization. HWUs are an economical and versatile tool for restoring and improving hydrocarbon recovery from both new and aging wells and are therefore indispensable. In addition, the rapid development of shale gas and tight oil reserves (e.g., in US, Canada, China, and Argentina) is fuelling the growing adoption of HWUs in onshore applications. These units will complement the wave of broader energy security initiatives by ensuring fast, safe, and efficient interventions.
In June 2025, Argentina’s Vaca Muerta shale formation boosted national oil output by 26% and dry gas by 16% in Q1 2025, strengthening its path toward energy self-sufficiency. Pipeline expansions are set to further unlock production. LNG projects by YPF, Shell, and Southern Energy aim to position Argentina as a major exporter by the late 2020s. Investor confidence also grew, with Equinor reversing its exit.
Restraints:
-
Cost Barriers and Oil Price Volatility Challenge Hydraulic Workover Unit Market Growth
High upfront and operational costs remain a significant restraint in the Hydraulic Workover Unit (HWU) market. The initial capital required for acquiring and deploying HWUs is substantial, often making it difficult for small and independent operators to invest. The additional costs associated with developing the necessary infrastructure, hiring qualified staff, and maintaining this infrastructure make it even more costly to operate. Another serious challenge is the fluctuation of global oil prices. Oil and gas companies often procrastinate or put on hold intervention and maintenance initiatives when oil prices remain low for prolonged periods to preserve capital. Such cost barriers can hinder the adoption of HWUs, especially in price-sensitive or economically uncertain circumstances, and ultimately restrict market growth and expansion opportunities.
In May 2025, the U.S. oilfield service giants including SLB, Halliburton, and Baker Hughes warned of a slowdown due to falling oil prices, which dropped from USD 78 to the mid-USD 50s per barrel. This decline has led producers to cut spending, delay maintenance, and reduce rig activity. The industry faces pressure from high operational costs and weakened demand, impacting investments in equipment including Hydraulic Workover Units.
Hydraulic Workover Unit Market Segmentation Analysis:
By Service
The Workover segment dominated the market and accounted for 79% of the Hydraulic Workover Unit Market share. The dominance is due to its importance in improving and recovering well productivity, particularly in aging and mature oilfields. Tubing replacement, sand cleanouts, and other boost functions that get a well back into production are the bread and butter for workover units. Their main benefit is that we can intervene without killing the well, they are very cost and time-beneficial. They further capitalize on their versatility and use onshore and offshore. As the world continues to focus on producing maximum volume from existing wells, workover services remain the staple behind hydraulic workover unit operations throughout all major oil-producing regions.
Snubbing services are emerging as the fastest-growing segment within the Hydraulic Workover Unit Market. Due to the need that wellbore pressure be kept owing to possible formation damage or blowouts in such operations, snubbing is always the method of choice for high-pressure, high-temperature wells. These services improve safety and reduce downtime from live well interventions by eliminating the need to kill the well. The increased trend in deepwater drilling and unconventional exploration specifically in hostile environments, has further advanced the adoption of snubbing. Snubbing services are favoured solutions for well intervention strategies as the oil and gas industry moves further toward new high-efficiency and pressure-controlled designs.
By Installation
Skid-mounted hydraulic workover units led the market with 62% share in 2024, representing a stable structure with high operational reliability that can be used for permanent or semi-permanent onshore applications. They are preferred in old oilfields, where the workover is long-term. They are also compact and modular, which aids customization and transportation in restricted areas on land.
Trailer-mounted units are the fastest-growing in this segment, attributed to their superior mobility and time-saving deployment features. These units are now more widely used for remote and multi-well pad operations, especially when shuttling between pads quickly is necessary. With the proliferation of shale and other unconventional plays, trailer-mounted setups are becoming increasingly popular owing to their logistical flexibility and relative speed of deployment.
By Application
In 2024, onshore operations held a dominant 66% share in the hydraulic workover unit market. Much of it is simply driven by the fact that onshore oilfields are found globally, but especially in the Middle East, North America, and Asia, and also given their relatively lower capital and operational costs compared to offshore. If the sites are onshore, they will be easier to access, which can make it easier to deliver hydraulic workover equipment.
Offshore applications are the fastest-growing due to a surge in deepwater and ultra-deepwater exploration activities. Intervention challenges for these properties are sophisticated, offshore assets require special high and low pressure, multiple intervention solutions, and as such, pressure-controlled wells are where hydraulic workover units shine best for well interventions. With E&P companies looking to maximise offshore asset production, the need for offshore-capable HWUs that are compact, mobile, and efficient is growing steadily.
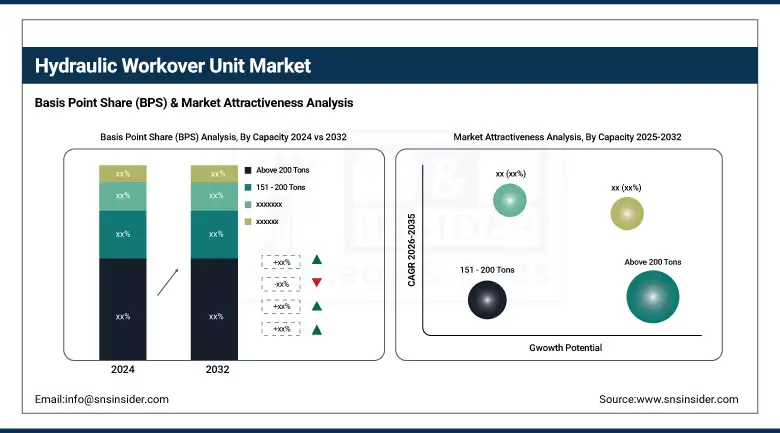
By Capacity
Hydraulic workover units with above 200 tons dominated the market in 2024, securing around 59% of the share. These are rugged units which are critical for deep and high-pressure wells where high lifting capacity is needed. With the capacity to service large tubulars, heavy BOPs, and extended-reach wells, they are frequently the rig of choice for many complex workover and snubbing operations both offshore and in deep onshore roots.
The below 15 tons segment is the fastest-growing, particularly in shallow wells and marginal fields. These CMUs represent an attractive option for lightweight campaigns and are well-suited for small or early-phase field developments. Operators, particularly small and mid-sized ones, are adopting them for their compactness, ease of deployment, and low maintenance requirements.
Hydraulic Workover Unit Market Regional Outlook:
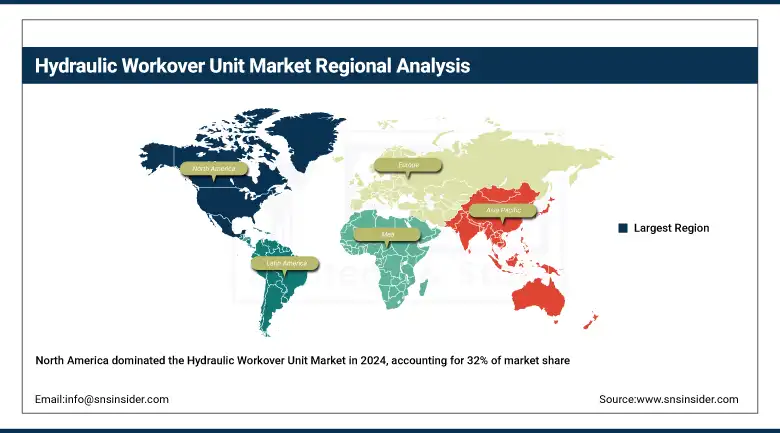
North America held the dominant share of the Hydraulic Workover Unit Market in 2024, accounting for approximately 32%. This is supported by an established oil & gas infrastructure in the region, the further maturation of a large percentage of the industry, and broader demand for well intervention services. Particularly, the U.S. and Canada continue re-investing in the aging fields and production efficiency, which increases the demand for workover services. Furthermore, growing innovations and experienced laborers assist the market in extending as well. Further, the North American market is maturing and is in the profitability phase of market growth in hydraulic workover services, with the presence of a few key workover companies.
Get Customized Report as per Your Business Requirement - Enquiry Now
Asia Pacific is emerging as the fastest-growing region in the Hydraulic Workover Unit Market, due to population growth, increasing energy demand, exploration and production activities, and investment in upstream infrastructure. As nations including China, India, and Indonesia grow their production, and more focus on bringing old wells back online, the need for hydraulic workover operations multiply. Further rise in market growth is propagated by growing government regulation, local content policies, and an increase in regional service providers. It is expected that Asia Pacific to be a fast-growing region with a higher CAGR as compared to other regions due to industrialization and urbanization.
China dominates the Hydraulic Workover Unit Market due to the presence of a large number of mature oilfields and extensive government investments in upstream activities. Workover services are in high demand as the country is focusing on boosting domestic oil production and rejuvenating wells that are in decline. This is further complemented by the presence of large state-owned oil companies, enhancing volume in the market.
Europe holds a significant share in the Hydraulic Workover Unit Market due to ongoing efforts to maintain production levels in mature offshore and onshore fields. Countries like the U.K., Norway, and the Netherlands have well-developed regulatory environments and focus on maximising resource recovery, which drives continuous hydraulic workover demand. While not witnessing the largest growth, the region is characterized by high safety standards, technological know-how, and a well-established service infrastructure. Sustainable energy extraction and EOR methods then help in making workover units applicable for sophisticated well environments. Europe, while steady, is still likely to edge up slowly as its increasingly mature fields will need continued work.
Hydraulic Workover Unit Companies are:
Halliburton, National Oilwell Varco, Precision Drilling Corporation, Superior Energy Services, Archer, Cudd Energy Services, Velesto Energy, High Arctic Energy Services Inc., Uzma Berhad, and PT Elnusa Tbk.
Recent Developments:
In April 2025, Precision Drilling reported Q1 2025 results with CAD 35 million net earnings and CAD 63 million in operating cash flow. The company reduced its capital spending target to CAD 200 million and repurchased CAD 31 million in shares. Canadian rig activity remained steady, while the U.S. and international operations saw slight declines. Precision remains focused on debt reduction and shareholder returns.
In December 2024, Uzma Engineering Sdn Bhd, a subsidiary of Uzma Bhd, secured a contract from EnQuest Petroleum for the provision of a Hydraulic Workover Unit (HWU) for the Raya A offshore campaign. The contract commenced on November 12, 2024, and will run until project completion. It is expected to contribute positively to Uzma’s earnings for FY2025.
| Report Attributes | Details |
|---|---|
| Market Size in 2024 | USD 9.08 Billion |
| Market Size by 2032 | USD 13.56 Billion |
| CAGR | CAGR of 5.14% From 2025 to 2032 |
| Base Year | 2024 |
| Forecast Period | 2025-2032 |
| Historical Data | 2021-2023 |
| Report Scope & Coverage | Market Size, Segments Analysis, Competitive Landscape, Regional Analysis, DROC & SWOT Analysis, Forecast Outlook |
| Key Segments | • By Service (Workover, Snubbing) • By Installation (Skid Mounted, Trailer Mounted) • By Application (Onshore, Offshore) • By Capacity (Below 15 Tons, 151 - 200 Tons, Above 200 Tons) |
| Regional Analysis/Coverage | North America (US, Canada, Mexico), Europe (Germany, France, UK, Italy, Spain, Poland, Turkey, Rest of Europe), Asia Pacific (China, India, Japan, South Korea, Singapore, Australia, Rest of Asia Pacific), Middle East & Africa (UAE, Saudi Arabia, Qatar, South Africa, Rest of Middle East & Africa), Latin America (Brazil, Argentina, Rest of Latin America) |
| Company Profiles | Halliburton, National Oilwell Varco, Precision Drilling Corporation, Superior Energy Services, Archer, Cudd Energy Services, Velesto Energy, High Arctic Energy Services Inc., Uzma Berhad, PT Elnusa Tbk. |
Frequently Asked Questions
Ans: The North America region dominated the Hydraulic Workover Unit market in 2024.
Ans: The “Workover” segment dominated the Hydraulic Workover Unit market.
Ans: Surging Global Energy Demand Fuels Hydraulic Workover Unit Adoption Across Oil & Gas Operations
Ans: The Hydraulic Workover Unit market was USD 9.08 billion in 2024 and is expected to reach USD 13.56 billion by 2032.
Ans: The Hydraulic Workover Unit market is expected to grow at a CAGR of 5.14% from 2025-2032.
Get in Touch
