Shale Gas Market Report Scope & Overview:
Get more information on Shale Gas Market - Request Sample Report
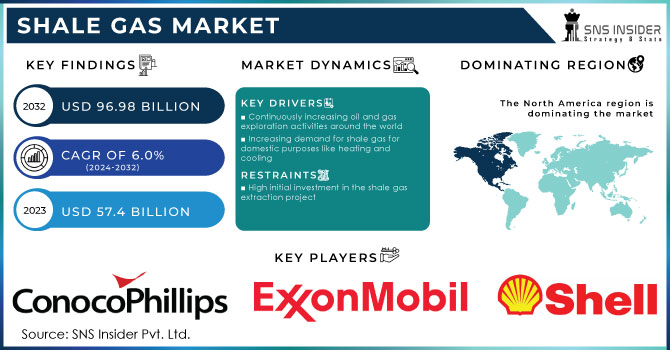
The Shale Gas Market size is valued at USD 57.4 billion in 2023. It is estimated to be USD 96.98 billion by 2032 and is likely to expand CAGR of 6.0% over the forecast period 2024-2032.
Shales are sedimentary rocks that are rich in natural gas and petroleum sources. Shale gas refers to the natural gas that is found in the deposits of shale. Microscopic or submicroscopic pores of shale trap the shale gas. Methane is the main hydrocarbon in the shale gas. 70-90 percent of CH4 is present in shale gas. Shale gas is used for electricity generation and domestic cooling and heating purposes.
Shale gas is referred to as unconventional natural gas because it is found in shale which is a less permeable rock than siltstone, limestone, or sandstone in which conventional gas is found. Due to this natural gas does not flow easily through the shales. Large volumes of shale gas are produced by the combination of horizontal drilling and hydraulic fracturing technology which was previously uneconomical to produce.
During the extraction of shale gas from shale there is an additional energy input need during extraction which causes higher emission of Greenhouse Gas than conventional natural gas.
Market Dynamics
Drivers
-
Continuously increasing oil and gas exploration activities around the world
-
Increasing demand for shale gas for domestic purposes like heating and cooling
-
Decrease in the natural gas prices
-
Increasing awareness about the benefits of natural gas among the people
-
Abundant sources of shale gas
The abundant shale gas sources which are easily available and the reduced natural gas prices which increase the demand for natural gas across the globe propel the shale gas market. In addition, various applications of shale gas in different industries have driven the market of shale gas. shale gas is also used as feedstock for the fertilizer industry to produce ammonia. It is also used in the power industry in place of coal due to which many regions are replacing their coal-fired power plant with gas-fired power plants to protect the environment by reducing carbon emissions.
Restrain
-
High initial investment in the shale gas extraction project
Opportunities
-
Technological advancement and innovation regarding the extraction of shale gas
Challenges
-
Increasing environmental concern about shale gas production
-
Harmful effect of shale gas production techniques on the surroundings
The shale gas extraction techniques such as fracking leaks million tons of methane- a greenhouse gas that is more potent than CO2. Along with methane, other airborne hydrocarbons are also extracted due to fracking which causes respiratory and health problems. It uses a large amount of water, which also affects the local groundwater quantity and quality. These factors can create a challenge for the shale gas market.
Impact of COVID-19
The COVID-19 pandemic had a very bad impact on various industries. The global shale market is one of the markets which is negatively impacted by this outbreak of COVID-19. Due to the lockdowns various restrictions are imposed by the government on the industries as well which results in the closure of various manufacturing units, including shale gas. The stringent social distancing regulation had limited the spread of coronavirus but also limit the production capacity of various industries. Moreover, import-export activities were impacted significantly due to this pandemic, which further severely impacted the industries that use shale gas and thereby hampered the global shale gas market.
Impact of Russia-Ukraine War:
The Russia-Ukraine war has had a bad impact on the global energy sector including the shale gas market. The shale gas industry has been growing rapidly in recent years, with the United States leading the way in production. However, the Russia-Ukraine conflict has caused a shift in the market, with Europe looking to reduce its dependence on Russian gas and turn to alternative sources, such as shale gas. The war has also affected the production and transportation of shale gas in Ukraine. The country has significant shale gas reserves, but the conflict has made it difficult to extract and transport the gas. This has led to a decrease in production and a delay in the development of the industry. Furthermore, the conflict has caused uncertainty in the global energy market, leading to fluctuations in prices and investments. Investors are hesitant to invest in the shale gas industry in Ukraine due to the instability of the region.
Impact of Recession:
The recession has had a significant impact on the shale gas market. As the economy has slowed down, demand for energy has decreased, leading to a decrease in the price of natural gas. This has made it more difficult for shale gas producers to compete with traditional gas producers. Furthermore, the recession has made it more difficult for shale gas producers to secure financing for their operations.
Key Market segmentation
On the basis of technology, the Shale Gas Market is further segmented into Vertical Fracking, Horizontal Fracking, and Rotary Fracking.
Fracking: Fracking also called Hydraulic fracturing is a technique of extracting shale gas and oil from shale rock. In this technique, drilling into the earth is involved which direct the high-pressure mixture of water, chemicals, and sand at shale layers to release the oil and gas inside.
On the basis of Application, the Shale Gas Market is further bifurcated into Industrial, Power Generation, Residential, Commercial, and Transportation
By Technology
-
Vertical Fracking
-
Horizontal Fracking
-
Rotary Fracking
By Application
-
Industrial
-
Power Generation
-
Residential
-
Commercial
-
Transportation
Regional Analysis
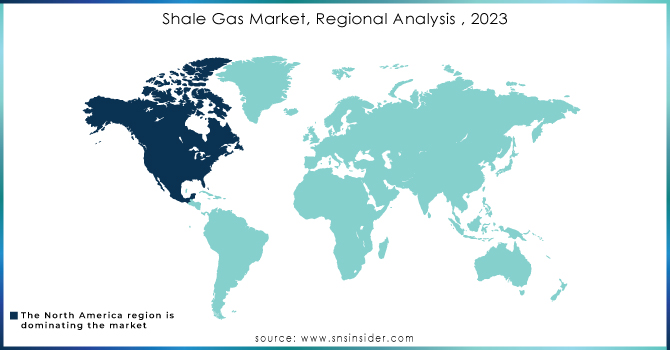
North America region is anticipated to hold the largest market share of the shale gas market and rise with a significant growth rate during the forecast period. This is owing to the availability of abundant resources of shale gas present in this region.
The U.S. is the main contributor to this growth due to the deployment of hydraulic fracturing with horizontal drilling for extracting the shale gas present in the ultra-hard shale which is present in the deep underground reserves across the country. The lack of infrastructure and ongoing political, environmental, and social debate have restrained the growth of other regions. It is one of the reasons that the U.S. predominantly supplies shale gas across the globe.
The Asia-Pacific region will show remarkable growth in the shale gas market in the future due to the increase in demand for shale gas in this region.
Get Customized Report as per your Business Requirement - Request For Customized Report
REGIONAL COVERAGE:
-
North America
-
USA
-
Canada
-
Mexico
-
-
Europe
-
Germany
-
UK
-
France
-
Italy
-
Spain
-
The Netherlands
-
Rest of Europe
-
-
Asia-Pacific
-
Japan
-
south Korea
-
China
-
India
-
Australia
-
Rest of Asia-Pacific
-
-
The Middle East & Africa
-
Israel
-
UAE
-
South Africa
-
Rest of the Middle East & Africa
-
-
Latin America
-
Brazil
-
Argentina
-
Rest of Latin America
-
Key Players
The major players are Royal Dutch Shell PLC, ConocoPhillips, PetroChina Company Limited, Exxon Mobil Corporation, Chevron Corporation, Chesapeake Energy Corporation, and other players
Key Market Trends:
The key market trend which contributes to the growth of the shale gas market is the increase in the adoption of the green fracking method. Energy technology providers have discovered some green fracking methods which do not harm the environment as much the hydraulic fracturing to reduce the negative impact on the surroundings. To reduce the environmental impact of hydraulic fracturing some companies are trying really hard. To reduce the environmental hazards and decrease hydraulic fracturing eco-friendly methods are expected to be in use for the extraction of shale gas, which further propels the market growth.
| Report Attributes | Details |
| Market Size in 2023 | US$ 57.4 Bn |
| Market Size by 2032 | US$ 96.98 Bn |
| CAGR | CAGR of 6.0% From 2024 to 2032 |
| Base Year | 2023 |
| Forecast Period | 2024-2032 |
| Historical Data | 2020-2022 |
| Report Scope & Coverage | Market Size, Segments Analysis, Competitive Landscape, Regional Analysis, DROC & SWOT Analysis, Forecast Outlook |
| Key Segments | • By Technology (Vertical Fracking, Horizontal Fracking, and Rotary Fracking) • By Application (Industrial, Power Generation, Residential, Commercial, and Transportation) |
| Regional Analysis/Coverage | North America (USA, Canada, Mexico), Europe (Germany, UK, France, Italy, Spain, Netherlands, Rest of Europe), Asia-Pacific (Japan, South Korea, China, India, Australia, Rest of Asia-Pacific), The Middle East & Africa (Israel, UAE, South Africa, Rest of Middle East & Africa), Latin America (Brazil, Argentina, Rest of Latin America) |
| Company Profiles | Royal Dutch Shell PLC; ConocoPhillips; PetroChina Company Limited; Exxon Mobil Corporation; Chevron Corporation; Chesapeake Energy Corporation |
| Key Drivers | • Rising oil and gas exploration activities across the globe • Increasing demand for shale gas for domestic purposes like heating and cooling |
| Market Opportunities | • Technological advancement and innovation regarding the extraction of shale gas |
Frequently Asked Questions
The increasing oil and gas exploration activities across the world, Increasing demand for shale gas for domestic purposes like heating and cooling, Decrease in the prices of natural gas, Increasing awareness about the benefits of natural gas among the people, and Abundant sources of shale gas are some key factors which drives the shale gas market globally.
United States contributes major to the Shale Gas Market.
The major key players are Royal Dutch Shell PLC; ConocoPhillips; PetroChina Company Limited; Exxon Mobil Corporation; Chevron Corporation; Chesapeake Energy Corporation
The expected CAGR of the global Shale Gas Market during the forecast period is 6.0%
The expected market size of the Shale Gas Market is 96.98 USD billion in 2032.
Get in Touch
