Hyper-Automation Market Report Scope & Overview:
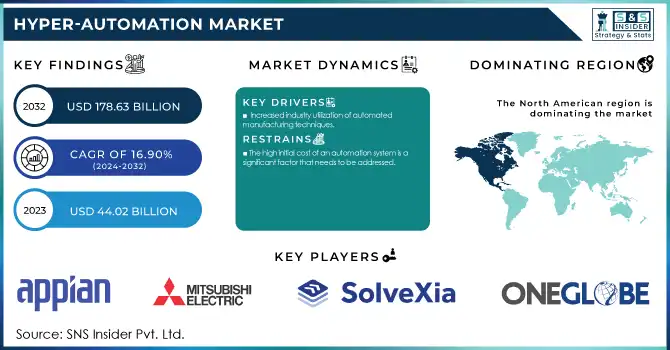
Hyper-Automation Market was valued at USD 44.38 billion in 2023 and is expected to reach USD 179.96 billion by 2032, growing at a CAGR of 16.89% from 2024-2032. This report contains an analysis of adoption rates of emerging technologies, investment trends, regulatory impact and compliance trends, and customer experience & engagement metrics. This market is growing with the need for operational efficiency, cost reduction, and innovation across industries in Finance & Accounting and IT & Telecommunication. Adoption of AI, machine learning, and robotic process automation are further driving growth in the market.
To Get More Information on Hyper-Automation Market - Request Sample Report
Market Dynamics
Drivers
-
Increased Demand for Operational Efficiency Drives Adoption of Hyper-Automation Solutions to Streamline Processes and Reduce Costs
Organizations in all industries are looking to automate repetitive tasks to optimize operations. With automation technologies, businesses look to simplify complex processes, minimize human error, and significantly reduce operational costs. This growing focus on efficiency frees up resources to be used in higher-value activities and innovation. Automation tools not only speed up operations but also allow for better accuracy and consistency. As pressures grow on businesses to stay competitive but control costs, the need for hyper-automation solutions that combine AI, machine learning, and more is increasing. The demand goes up as the solution proffers greater scalability and flexibility: it enables companies to adjust fast and efficiently to changes in business environments and market conditions.
Restraints
-
High Initial Implementation Costs Limit Widespread Adoption of Hyper-Automation Technologies, Especially for Small and Medium-Sized Businesses
There will also be large upfront costs as many solutions deploy hyper-automated systems such as AI, machine learning, and robotic process automation. Most of these advanced technologies can have expensive integrations, particularly with small and medium-sized enterprises operating under leaner budgets. An individual bot would cost in a range between USD 5,000 to USD 15,000 dollars, making them quite a fiscal burden. This does not even account for the maintenance cost, training, and support, which would further add to the costs. In some cases, it may require a specialized kind of infrastructure and expertise for the implementation and management of such solutions in their operations, creating further headaches in businesses that want to use automation on a bigger scale. It thus turns out to be a significant barrier which might hinder or delay businesses from utilizing hyper-automation's full potential.
Opportunities
-
Rising Digital Transformation Drives Increased Adoption of Hyper-Automation Technologies to Accelerate Modernization and Boost Efficiency
As businesses put more emphasis on digital transformation, hyper-automation is a prime solution to drive the streamlining of operations and productivity through the integration of AI, machine learning, and RPA. The organizations can now reduce manual efforts, enhance accuracy, and improve efficiency, hence accelerating their journey to digitalization. In 2024, UiPath reported that 40% of automation professionals had already integrated AI functionalities into their projects, and another 50% were planning to do so, thus showing the growing influence of AI in automation. Honeywell also partnered with Qualcomm to create an AI-enabled Multi-Modal Intelligent Agent to make interactions in distribution centers and retail more efficient, thus driving hyper-automation adoption. As industries modernize, the demand for hyper-automation technologies will rise, helping businesses stay competitive in a digital world.
Challenges
-
Integration of Hyper-Automation Tools with Legacy Systems Presents Complex Challenges, Increasing Effort and Cost for Businesses
Most hyper-automation tools are difficult to integrate with legacy systems. Most organizations operate on legacy infrastructures that were not designed to work with modern automation technologies, like AI, machine learning, and robotic process automation. This often causes compatibility problems and demands much customization and technical knowledge to make things work. Other integration challenges that may be experienced by organizations include data synchronization. The older systems may store data in formats that are incompatible with the modern automation platforms. The integration process may disrupt ongoing operations and requires significant downtime, which complicates implementation. Such integration complexities increase the costs and effort involved in adopting hyper-automation, slowing down its widespread use. For businesses, this means overcoming such hurdles requires careful planning, skilled resources, and sometimes a complete overhaul of their technological infrastructure, which can be a major barrier to efficient implementation.
Segment Analysis
By Technology
In 2023, the Robotic Process Automation segment led the Hyper-Automation Market, capturing about 37% of the revenue share, driven by its ability to automate repetitive tasks, cut costs, and improve efficiency. In contrast, the Computer Vision segment is expected to grow at the fastest CAGR of 20.07% from 2024 to 2032, fueled by advancements in AI and machine learning. This growth is particularly prominent in industries like healthcare, automotive, and manufacturing, where automation enhances decision-making and quality control.
By Component
In 2023, the Hardware segment led the Hyper-Automation Market with a 45% revenue share, driven by the increasing demand for advanced components like sensors, robots, and IoT devices essential for automation. Meanwhile, the Software segment is expected to grow at the fastest CAGR of 18.20% from 2024 to 2032, fueled by advancements in AI, machine learning, and analytics platforms. As organizations seek to optimize processes and integrate intelligent systems, the demand for scalable software solutions is set to rise significantly.
By Function
In 2023, the Finance & Accounting segment dominated the Hyper-Automation Market with a 34% revenue share, driven by the growing need to automate financial processes, reduce errors, and lower operational costs. Meanwhile, the Marketing & Sales segment is projected to grow at the fastest CAGR of 19.17% from 2024 to 2032, fueled by the increasing demand for data-driven strategies and personalized customer experiences. Automation technologies are becoming vital for optimizing campaigns, managing leads, and enhancing customer engagement.
By End Use
In 2023, the IT & Telecommunication segment led the Hyper-Automation Market with a 27% revenue share, driven by the growing need for automation in network management, data processing, and system monitoring to improve efficiency and scalability. Meanwhile, the Manufacturing segment is expected to grow at the fastest CAGR of 18.65% from 2024 to 2032, fueled by the demand for smart manufacturing solutions that optimize production, reduce downtime, and ensure quality in a rapidly evolving market.
By Deployment
In 2023, the Cloud segment dominated the Hyper-Automation Market with a 51% revenue share, driven by its scalability, flexibility, and cost-effectiveness in supporting automation. Cloud solutions enable businesses to manage data, integrate tools, and scale operations efficiently. Conversely, the On-premise segment is expected to grow at the fastest CAGR of 17.89% from 2024 to 2032, fueled by the need for enhanced data security and control in industries with strict compliance requirements, such as banking and healthcare.
Regional Analysis
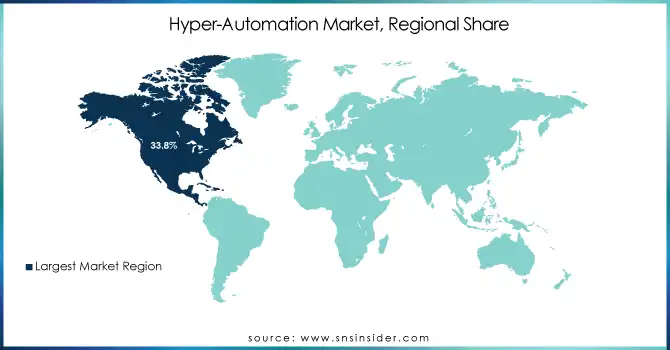
In 2023, North America dominated the Hyper-Automation Market, capturing the largest revenue share of about 39%. This dominance is driven by the region's strong adoption of advanced technologies and the presence of key players in the automation industry. Businesses across sectors such as IT, finance, and healthcare are increasingly leveraging automation to optimize processes, enhance productivity, and stay competitive, making North America a leader in the market.
On the other hand, the Asia Pacific region is expected to grow at the fastest CAGR of 19.16% from 2024 to 2032. This rapid growth can be attributed to the region's expanding industrial base, increasing investments in digital transformation, and government initiatives promoting automation technologies. Countries like China, India, and Japan are prioritizing automation to enhance manufacturing efficiency, improve supply chain management, and boost overall productivity, leading to significant market growth in this region.
Do You Need any Customization Research on Hyper-Automation Market - Enquire Now
Key Players
-
UiPath (UiPath Studio, UiPath Orchestrator)
-
Wipro Ltd. (Wipro HOLMES, Wipro AiCore)
-
Tata Consultancy Services Ltd. (TCS Intelligent Process Automation, TCS Cognitive Business Operations)
-
Mitsubishi Electric Corporation (MELSEC iQ-R, MELFA Assista)
-
OneGlobe LLC (OneGlobe RPA, OneGlobe AI Automation)
-
SolveXia (SolveXia RPA, SolveXia Analytics)
-
Appian (Appian RPA, Appian AI)
-
Automation Anywhere Inc. (Automation Anywhere A2019, Automation Anywhere IQ Bot)
-
Allerin Tech Pvt. Ltd. (Allerin RPA, Allerin AI)
-
PagerDuty, Inc. (PagerDuty Incident Response, PagerDuty Event Intelligence)
-
Honeywell International Inc. (Honeywell Forge, Honeywell Process Solutions)
-
Alteryx (Alteryx Designer, Alteryx Server)
-
Catalytic Inc. (Catalytic Automation Platform, Catalytic AI Workflow)
-
akaBot (akaBot RPA, akaBot Insights)
-
Rocketbot (Rocketbot RPA, Rocketbot AI)
-
AutomationEdge (AutomationEdge IT Automation, AutomationEdge RPA)
-
Kofax (Kofax RPA, Kofax Intelligent Automation)
-
WorkFusion (WorkFusion Smart RPA, WorkFusion Intelligent Automation Cloud)
-
Pega Systems (Pega Robotic Automation, Pega AI)
-
ABBYY (ABBYY FlexiCapture, ABBYY Timeline)
-
IBM (IBM Robotic Process Automation, IBM Watson Orchestrate)
Recent Developments:
-
In 2025, Wipro enhanced its AI and Automation services, leveraging its Wipro HOLMES platform to help clients hyper-automate processes, transform operations, and reimagine customer experiences.
-
In July 2024, UiPath launched Autopilot, an AI-driven companion designed to automate tasks across diverse platforms and applications, significantly boosting productivity and operational efficiency.
-
In 2024, Honeywell launched a new generation of AI-capable handheld devices, including the CT37, CK67, and CK62, designed to optimize workflows in challenging environments like warehouses and retail floors.
| Report Attributes | Details |
|---|---|
| Market Size in 2023 | USD 44.38 Billion |
| Market Size by 2032 | USD 179.96 Billion |
| CAGR | CAGR of 16.89% From 2024 to 2032 |
| Base Year | 2023 |
| Forecast Period | 2024-2032 |
| Historical Data | 2020-2022 |
| Report Scope & Coverage | Market Size, Segments Analysis, Competitive Landscape, Regional Analysis, DROC & SWOT Analysis, Forecast Outlook |
| Key Segments | • By Component (Hardware, Software, Services) • By Technology (Robotic Process Automation, Machine Learning, Biometrics, Chatbots, Context Aware Computing, Natural Language Generation, Computer Vision) • By Deployment (On-premise, Cloud) • By Function (Marketing & Sales, Finance & Accounting, Human Resources, Operations & Supply Chain, Information Technology) • By End Use (Manufacturing, Automotive, BFSI, Healthcare, IT & Telecommunication, Retail, Transportation & Logistics, Others) |
| Regional Analysis/Coverage | North America (US, Canada, Mexico), Europe (Eastern Europe [Poland, Romania, Hungary, Turkey, Rest of Eastern Europe] Western Europe] Germany, France, UK, Italy, Spain, Netherlands, Switzerland, Austria, Rest of Western Europe]), Asia Pacific (China, India, Japan, South Korea, Vietnam, Singapore, Australia, Rest of Asia Pacific), Middle East & Africa (Middle East [UAE, Egypt, Saudi Arabia, Qatar, Rest of Middle East], Africa [Nigeria, South Africa, Rest of Africa], Latin America (Brazil, Argentina, Colombia, Rest of Latin America) |
| Company Profiles | UiPath, Wipro Ltd., Tata Consultancy Services Ltd., Mitsubishi Electric Corporation, OneGlobe LLC, SolveXia, Appian, Automation Anywhere Inc., Allerin Tech Pvt. Ltd., PagerDuty, Inc., Honeywell International Inc., Alteryx, Catalytic Inc., akaBot, Rocketbot, AutomationEdge, Kofax, WorkFusion, Pega Systems, ABBYY, IBM. |
Get in Touch
