Industrial Oil Water Separators Market Report Scope & Overview:
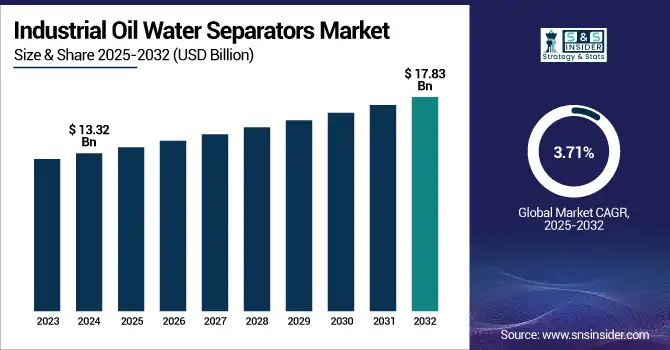
The Industrial Oil Water Separators Market size was valued at USD 13.32 billion in 2024 and is expected to reach USD 17.83 billion by 2032, growing at a CAGR of 3.71% over the forecast period of 2025-2032.
Industrial oil water separators market growth is driven by increasing role of these separators in wastewater management, environmental compliance, and resource recovery in industrial sectors such as manufacturing, oil & gas, chemical, and marine. They are effective in delinking oil from water to minimize contamination and to enable safe disposal or re-use of water. Modern separator systems feature advanced oil-water separation technology at their core to improve separation efficiency for the separation of oil from wastewater while lowering both wear & tear and maintenance costs and satisfying stricter environmental regulations. The market is complemented by a growing need to search for affordable, defined oil water treatment. Many industrial sectors tend to be concerned about their particular performance-related liability and eco-friendly performance report.
Market Size and Forecast:
-
Market Size in 2024: USD 13.32 Billion
-
Market Size by 2032: USD 17.83 Billion
-
CAGR: 3.71% from 2025 to 2032
-
Base Year: 2024
-
Forecast Period: 2025–2032
-
Historical Data: 2021–2023
To Get more information on Industrial Oil Water Separators Market - Request Free Sample Report
Prominent industrial oil water separators market trends are smart monitoring controls, modular & compact structure, and use of anti-corrosion materials introduced in the manufacturing. Increasing the efficiency of oil-water separation technology is another area of interest with innovations in membrane filtration and coalescing technologies. This creates a large opportunity for green technologies in growing industrialization in developing economy regions, retrofitting of aging infrastructure in developed economy regions and targeting ESG-aligned goals. The global industrial separators market has the potential to grow steadily and over the long term, as the tightening of Environmental regulations worldwide has led to the increased demand for efficient oily water treatment systems.
In February 2025 – Halliburton Labs teamed up with Oregon-based startup Espiku to enhance water recycling in the oilfield sector. Espiku’s modular system uses a three-step process: density separation, non-fouling evaporation, and condensation, to treat and reuse produced water while recovering valuable minerals, improving efficiency in Oil-water Separation Technology.
Industrial Oil Water Separators Market Trends:
-
Increasing environmental regulations on industrial wastewater discharge are driving adoption of advanced oil-water separation technologies.
-
Rising industrialization across emerging economies is boosting demand for efficient water treatment infrastructure.
-
Growing focus on sustainability and water reuse initiatives is encouraging industries to implement separation systems.
-
Expansion of oil & gas, manufacturing, marine, and power generation sectors is increasing installation of high-capacity separators.
-
Technological advancements such as coalescing plate separators, centrifugal systems, and automated monitoring are enhancing operational efficiency.
-
Government investments in wastewater treatment projects and compliance enforcement are strengthening market growth opportunities.
Industrial Oil Water Separators Market Drivers
-
Strict Environmental Regulations Drive Global Adoption of Advanced Industrial Oil-Water Separators
Stringent environmental regulations are having a significant impact on the adoption of industrial oil-water separators in the global market. Amidst these developments, governments across the globe are imposing stringent norms to curb water pollution, pushing industries to adopt efficient separation solutions. In this case, the U.S. EPA establishes the maximum allowed concentration of oil in the effluent discharges of surface vessels with oil-water separators (15 ppm, 40 CFR § 1700.36). Failure to meet this requirement could expose companies to significant penalties, fines up to USD 100,000 per day for known violations. Globally, MARPOL Annex I of the International Maritime Organization prohibits oil discharges above a limit of 15 ppm, and special sea areas have been established where this restriction applies everywhere (2). Such regulations compel industries to adopt oil-water separation technologies that are compliant and help to limit the environmental impact of oil release and legal contact owing to oil discharge in the water bodies.
In May 2025, a study from Chennai’s Institute of Mathematical Sciences and National Centre for Coastal Research revealed that oil spills and industrial waste severely harm India’s rivers and coastal life. Toxic petroleum hydrocarbons, especially harmful PAHs like fluoranthene and naphthalene, affect aquatic species and accumulate in marine ecosystems. Four high-risk pollution sites were identified, and contaminated seafood poses serious health risks to humans, including cancer and developmental issues.
Industrial Oil Water Separators Market Restraint
-
Impact of Capital and Operational Expenses on Oil-Water Separator Implementation in SMEs
Industrial oil-water separators can be expensive to purchase and maintain, and this is seen as a major hurdle, especially for small and medium-sized enterprises (SMEs). In excessive systems like coalescing plate separators and centrifugal units’ budgetary cost is relatively high as it needs to be procured, put in, and integrated into existing processes.
For instance, the capital expenditure to use ceramic membranes is approximately USD 7.33 million for every 55.1 million barrels of produced water treated per year, totalling about USD 48.5 million for 5 years.
In addition, operational and maintenance costs such as energy, regular maintenance, spare parts, and specialized labor significantly increase the total cost of ownership. This cost may discourage SMEs from adopting such technologies, forcing them to utilize less efficient, cheap solutions, which are neither eco-compliant nor do they save water.
Industrial Oil Water Separators Market Segmentation Analysis
By Type
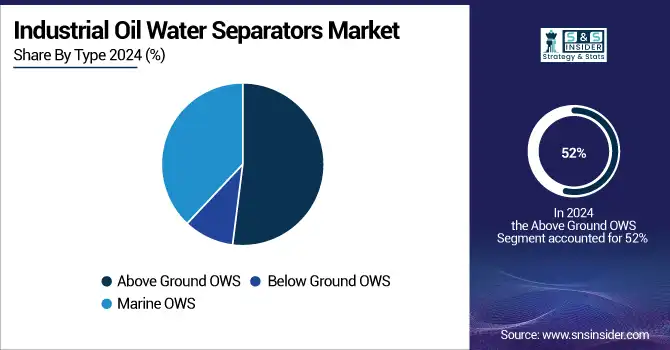
The Above-Ground Oil Water Separators (OWS) segment dominated the market and accounted for 52% of the industrial oil water separators market share. The high share of this segment can be attributed to the ease of installation, maintenance, and flexibility, as well as a wide range of industrial applications available compared to other types. OWS systems, which are above ground, are cost-effective and suitable for sites where underground installation is difficult or impossible. They are extensively used in sectors like manufacturing, oil & gas, and wastewater treatment, which greatly enhances their size in the market. As industries focus on efficient and accessible separation solutions, this dominance is predicted to remain for the long run.
The Marine Oil Water Separators (OWS) segment is currently the fastest growing within the Industrial Oil Water Separators market. This fast growth is mostly motivated by increasing maritime activities and stringent environmental regulations to minimize water pollution through oil discharge from ships. The need of the hour for marine vessels is an efficient OWS system, with the growing international standards such as MARPOL, attracting manufacturers to come up with advanced and reliable separators. Moreover, the increasing focus on marine ecosystem protection and capital investments for cleaner technologies is creating new opportunities for marine OWS solutions.
By End-Use
The Oil & Gas segment dominated the industrial oil water separators market, accounting for 34% of the market share in 2024. The large demand for separation technology to manage large volumes of wastewater produced during exploration, drilling, and refinement processes is driving this domination by the sector. Rival environmental regulations and new emphasis on sustainability drive oil and gas corporations to monitor efficient oil and water separators to reduce their environmental impact. Furthermore, this is compounded by the high operating costs of discharged untreated wastewater, which will further drive the use of these separators and consequently the market dominance of the Oil & Gas industry.
The Chemical segment is the fastest growing in the industrial oil water separators market. The growth of this segment is attributed to the increased demand for effective wastewater treatment and oil removal for chemical manufacturing processes. The mandates of stringent environmental regulations and high awareness about sustainable practices are inducing companies to adopt state-of-the-art oil-water separation technologies. Since chemical effluents contain dangerous oils and chemicals, a specific separation system needs to be implemented.
Industrial Oil Water Separators Market Regional Outlook
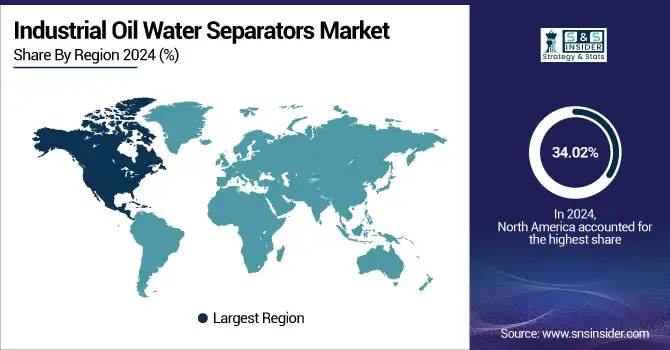
North America dominated the industrial oil water separators market, holding a significant 34.02% share in 2024. The combination of both supporting factors of its strong industrial base, strict environmental policies as well as a developed technology ecosystem helps drive this leadership. However, the presence of major manufacturing hubs coupled with continuous investment in sustainable practices is expected to help the growth of the market. Moreover, the rising focus on the elimination of water pollution and efficient oil-water separation processes in multiple industries like automotive, oil & gas, and manufacturing sectors also provides the drive for strong demand for efficient oil-water separation processes across North America.
The U.S. industrial oil water separators market is projected to grow from USD 3.40 billion in 2024 to USD 4.40 billion by 2032, registering a CAGR of 3.28%. This growth is fueled by stricter environmental regulations, increased focus on water treatment, and rising demand from key industries like manufacturing and oil & gas. As sustainability becomes a top priority, the adoption of efficient oil-water separation technologies is set to rise.
The Asia-Pacific region is the fastest-growing market for Industrial Oil Water Separators, due to the high pace of industrialization and the increase in manufacturing hubs in this region. For instance, growing demand from industrial wastewater effluent treatment companies in China, India, and Southeast Asian countries is demanding efficient oil-water separators to meet the stringent environmental regulations. The increasing awareness regarding environmental sustainability around the world, along with government initiatives, is expected to drive the demand for cleaner production processes, which in turn is anticipated to boost the market for advanced separator technologies.
As of 2024, China leads the Asia-Pacific industrial oil water separators market due to rapid industrial growth in oil and gas, petrochemicals, and automotive sectors. With stringent environmental regulations such as the aforementioned Water Pollution Prevention and Control Action Plan getting implemented, advanced separation technology is expected to be widely adopted. Additionally, heavy investments in infrastructure and the growth of the industrial sector only serve to boost demand, making China the most indispensable market leader in the region.
Europe holds a significant share in the Industrial Oil Water Separators market, largely due to the stringent environmental policies and regulations to mitigate industrial pollution as well as to preserve water resources in this region. Due to the stringent regulations regarding minimizing oil contamination from industries in this region, there is an urgent requirement for efficient methods of oil-water separation. Also, Europe provides innovative separation systems featuring a high grade of technology, driving performance, with minimizing operational costs.
Germany is the leading country in the Industrial Oil Water Separators market. The high demand of the oil-water separation market is driven by Germany's strong industrial base, stringent environmental regulation, and high focus on green sustainable practices. Moreover, Germany's already massive manufacturing sector, and repeated innovation in various fields of environmental engineering, also fortify its lead in this market throughout Europe.
Get Customized Report as per Your Business Requirement - Enquiry Now
Key players in Industrial Oil Water Separators Market:
Industrial Oil Water Separators Companies are Alfa Laval, Donaldson, Clarcor, Andritz, WesTech Engineering, Wartsila, Compass Water Solutions, Filtration, Parker-Hannifin, Recovered Energy
Recent Development
-
In July 2023, ANDRITZ launched upgraded three-phase decanter centrifuges for tough industrial oil recovery tasks. These machines, suitable for ATEX Zone 1 and 2, efficiently separate oil and water from contaminated sources like crude oil sludge. Features include explosion-proof seals, erosion-resistant parts, and energy-saving TurboJet weir plates for improved separation and reduced power use.
| Report Attributes | Details |
|---|---|
| Market Size in 2024 | USD 13.32 Billion |
| Market Size by 2032 | USD 17.83 Billion |
| CAGR | CAGR of 3.71% From 2025 to 2032 |
| Base Year | 2024 |
| Forecast Period | 2025-2032 |
| Historical Data | 2021-2023 |
| Report Scope & Coverage | Market Size, Segments Analysis, Competitive Landscape, Regional Analysis, DROC & SWOT Analysis, Forecast Outlook |
| Key Segments | • By Type (Above Ground OWS, Below Ground OWS, Marine OWS) • By End Use (Oil & Gas, Chemical, Food & Beverage, Power Generation, Water & Wastewater Treatment, Marine, Mining, Others) |
| Regional Analysis/Coverage | North America (US, Canada, Mexico), Europe (Germany, France, UK, Italy, Spain, Poland, Turkey, Rest of Europe), Asia Pacific (China, India, Japan, South Korea, Singapore, Australia, Rest of Asia Pacific), Middle East & Africa (UAE, Saudi Arabia, Qatar, South Africa, Rest of Middle East & Africa), Latin America (Brazil, Argentina, Rest of Latin America) |
| Company Profiles | Siemens AG, Recovered Energy, Compass Water Solutions, Clarcor, Donaldson, GEA, Containment Solutions, Alfa Laval, ZCL, WesTech Engineering |
Frequently Asked Questions
The North America region dominated the Industrial Oil Water Separators Market in 2024.
Strict Environmental Regulations Drive Global Adoption of Advanced Industrial Oil-Water Separators
The Industrial Oil Water Separators Market was USD 13.32 billion in 2024 and is expected to reach USD 17.83 billion by 2032.
The “Above-Ground Oil Water Separators (OWS)” segment dominated the Industrial Oil Water Separators Market.
The Industrial Oil Water Separators Market is expected to grow at a CAGR of 3.71% from 2025-2032.
Get in Touch
