Industrial Vehicles Market Report Scope & Overview:
Get E-PDF Sample Report on Industrial Vehicles Market - Request Sample Report
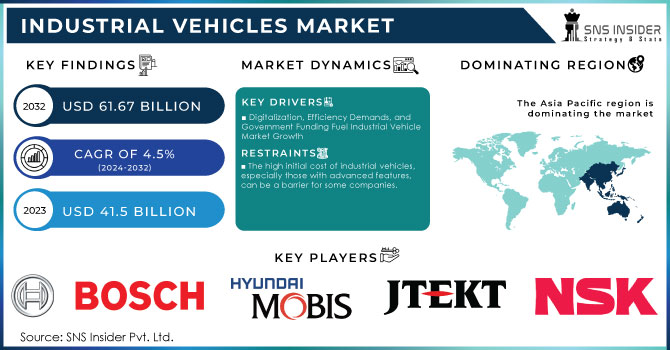
The Industrial Vehicles Market size was valued at USD 41.5 billion in 2023 and is expected to reach USD 61.67 billion by 2032 and grow at a CAGR of 4.5% over the forecast period 2024-2032.
The industrial vehicles market encompasses a diverse range of specialized vehicles designed to streamline operations within factories, warehouses, construction sites, and more. These workhorses, like forklifts, tow tractors, and container handlers, are engineered to tackle specific tasks, contributing significantly to efficiency, productivity, and safety across various sectors. The market thrives on the growing demand for efficient material handling and transportation solutions. The e-commerce rise has fueled the need for reliable vehicles in warehouses to manage the influx of goods. The advancements in automation are leading to the integration of autonomous vehicles for tasks like pallet movement and picking, further optimizing workflows. The rising adoption of electric and hybrid vehicles, driven by environmental concerns, presents a significant growth prospect. The integration of advanced technologies like artificial intelligence and sensor fusion holds immense potential for enhancing safety, precision, and overall operational efficiency.
Technological advancement, regulatory issues due to environmental policies, and changes in consumer preferences are major drivers of the Industrial Vehicles Market. The trend is now towards electric industrial and hybrid industrial vehicles, as till 2023 they already accounted for about 25% of new sales, marking the direction towards more sustainable and reduced-emission technologies. Automation and telematics have enhanced the operational efficiency of industrial vehicles. Already, 30% of fleet operators are using automation and telematics to enhance productivity while reducing safety risks. There is also a growing demand for warehouse equipment, including forklifts, automated guided vehicles, and other material handling appliances, with up to 15% indicating higher usage of AGVs for warehouse automation. Increased focus on digitalization in logistics and supply chain management has pushed the adoption of connected vehicles, as 40% of industrial vehicle manufacturers are investing in IoT solutions.
MARKET DYNAMICS:
KEY DRIVERS:
-
Digitalization, Efficiency Demands, and Government Funding Fuel Industrial Vehicle Market Growth
With the market constantly advancing and industries becoming more competitive, companies are now emphasizing productivity and profitability using innovative solutions. Demand for industrial vehicles with sophisticated automation and connectivity features is rising sharply, as the new technologies allow the organization to work in the most streamlined manner and reduce costs. According to a study, 35% of industrial vehicles sold in 2023 are equipped with integrated telematics systems providing real-time information on vehicle performance and operational efficiency.
The most significant change is likely to occur in sectors like logistics, warehousing, and manufacturing, as the number of automated guided vehicles (AGVs) implemented has increased by about 15% in the last year. These vehicles help to optimize workflows, minimize manual labour, and improve various safety regulations, thereby reducing the operations' downtime. Companies are implementing IoT solutions to easily connect between vehicles and management systems with real-time monitoring and predictive maintenance capabilities. So, companies would rather be proactive and prevent the trouble before it starts. By being proactive about prevention, the operational disruptions are reduced by 20%.
RESTRAINTS:
-
The high initial cost of industrial vehicles, especially those with advanced features, can be a barrier for some companies.
-
Maintenance and repair costs for complex industrial vehicles can be substantial, adding to operational expenses.
OPPORTUNITIES:
-
The ever-growing e-commerce industry demands efficient warehouse solutions, creating opportunities for automation and high-capacity vehicles.
-
Sustainability concerns are driving a shift towards electric and alternative-fuel industrial vehicles.
CHALLENGES:
-
Limited R&D and consumer knowledge of advanced features could slow semi-autonomous vehicle market growth.
The semi-autonomous vehicle market faces the problems that could slow its growth. Limited research and development facilities restrict innovation and the production of advanced features. The lack of consumer understanding regarding these features creates hesitation in adopting this technology. This knowledge gap can be bridged through the educational initiatives and consumer awareness campaigns, paving the way for wider acceptance of semi-autonomous vehicles.
KEY MARKET SEGMENTS:
By Vehicle Type & Capacity:
Forklifts is the dominating sub-segment in the Industrial Vehicles Market by vehicle type & capacity holding around 65% of market share due to their adaptability. They handle various loads across industries like manufacturing, warehousing, and freight. The 5-10 ton capacity range reigns supreme because it can handle standard pallets, making it ideal for general applications. However, for heavy-duty tasks in specific industries like mining or steel mills, higher capacity forklifts (>36 tons) are crucial.
By Drive Type:
Leader in the market, Combustion Engine vehicles take on a share of nearly 60% due to technology familiarity and high power output, mostly for heavy-duty uses like construction and logistics. Increasing pressure, however, faces this industry with environmental rules and the quest for greener alternatives. Meanwhile, the battery driven forklifts are gaining ground and are estimated to capture nearly 25% of the market since improving battery driven technologies improve efficiency and reduce charging time. Indoor operations, like those in warehouses, are specially sensitive toward a decrease in emissions and noise. Meanwhile, gas-using industrial vehicles, which currently command 15%, will better counter power and envirotechnology for the appeal of industries wanting to get away from diesel. Balancing power with environmental concern, the gas-powered segment is also expanding as natural gas infrastructures and urgencies on sustainability calls grow. This segmentation shines in the light of turning events in the Industrial Vehicles Market as companies are growing increasingly fastidious about efficiency, sustainability, and even cost-effectiveness within their overall strategies.
By Application:
Warehousing is the dominating sub-segment in the Industrial Vehicles Market by application holding around 45% of market share. The e-commerce growth has fueled the demand for efficient material handling solutions in warehouses. This segment leads the pack, driven by the extensive use of forklifts, AGVs (automated guided vehicles), and tow tractors for tasks like stocking, picking, and order fulfilment.
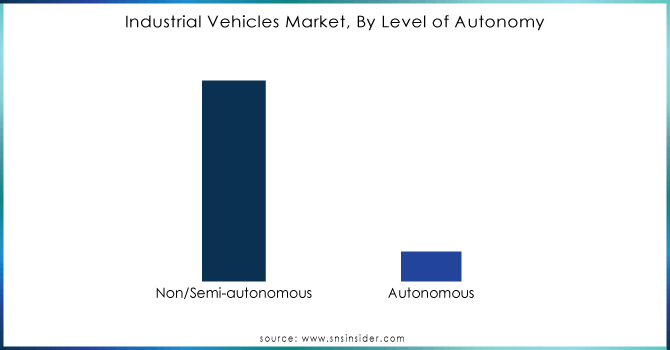
By Level of Autonomy:
Non-autonomous vehicles is the dominating sub-segment in the Industrial Vehicles Market by level of autonomy holding around 90% of market share due to affordability. Complex autonomous tech makes them pricier. Additionally, established functionalities and readily available operator training make these familiar workhorses a reliable choice. Their versatility, with options ranging from basic forklifts to semi-autonomous models, caters to diverse needs.
Get Customized Report as Per Your Business Requirement - Request For Customized Report
REGIONAL ANALYSES
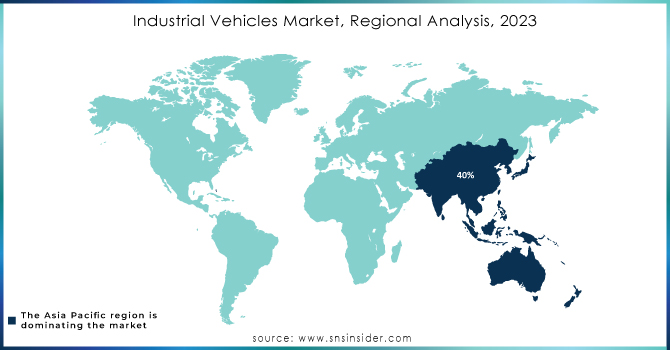
Asia Pacific dominates the Industrial Vehicles Market by holding approximately 40%. It's mainly due to the booming automobile industry in this region, which had gained considerable momentum with high demand for efficient transportation solutions and robust manufacturing capabilities. With significant investments in infrastructure development coupled with rapid urbanization, the region has a fertile environment for industrial vehicle applications in expansion. Rising demand for versatile and reliable industrial vehicles as cities expand and industrial activities increase further stamps leadership status on Asia Pacific's share.
The Europe region, after the Asia Pacific region, is the second largest industrial vehicles market, holding approximately 25-30% of the share. This region is bestowed with robust, high-profiled manufacturers, who are known and innovative. Europe, whose focus is automation and also sustainability due to the governments' increasing strictness on environmental parameters, needs manufacturers who build innovative industrial vehicles that carry state-of-the-art technologies. The pressure for greener solutions has accelerated the adoption of electric and hybrid vehicles in several industrial sectors, which is following promises made by the region to reduce carbon emissions.
North America is now the fastest-growing region in the Industrial Vehicles Market. The share in the range is between 20-25%. Some of the key contributors for the growth are massive construction sectors where infrastructural projects and investments have continually gone underway. High technology integration of IoT and automation systems into industrial vehicles has further resulted in high efficiency and productivity during the operation.
KEY PLAYERS
The major industrial vehicles market players are:
-
Robert Bosch Automotive Steering GmbH - Electric Power Steering Systems, Hydraulic Steering Systems
-
Hyundai Mobis Co., Ltd. - Advanced Driver Assistance Systems (ADAS), Electric Power Steering (EPS) Systems, Integrated Vehicle Control Systems
-
JTEKT Corporation - Electric Power Steering (EPS), Hydraulic Power Steering (HPS), Steering Columns and Gearboxes
-
ZF TRW Automotive Holdings Corp. - Electric Power Steering, Active Steering Systems, Hydraulic Steering Systems
-
NSK Ltd. - Electric Power Steering Systems, Steering Columns and Mechanisms, Steering Gearboxes
-
Nexteer Automotive Group Limited - Electric Power Steering (EPS), Hydraulic Power Steering (HPS), Steering Control Systems
-
Mando Corporation - Electric Power Steering Systems, Hydraulic Power Steering Systems, Steering Columns
-
ThyssenKrupp AG - Electric and Hydraulic Steering Systems, Steering Gear Systems, Vehicle Control Solutions
-
Showa Corporation - Hydraulic Steering Systems, Electric Power Steering Systems, Suspension and Chassis Components
-
China Automotive System - Power Steering Gear and Pumps, Electric Power Steering Systems, Steering Components and Assemblies
-
Dana Incorporated - Electric Drive Systems, Axles, Transmission Systems
-
BorgWarner Inc. - Electric Vehicle (EV) Motors, Propulsion Systems
-
Continental AG - Advanced Steering Systems, Tires for Industrial Use, Safety Technologies
-
Thyssenkrupp Presta AG - Precision Steering Systems, Gear Mechanisms
-
Parker Hannifin Corporation - Hydraulic Systems, Steering Controls, Pumps
RECENT DEVELOPMENT
-
In March 2024: Chinese forklift manufacturer, EP Equipment, has secured a deal with German building material supplier, Boendgen Baustoffe. Boendgen Baustoffe is upgrading its fleet with EP's electric EFL forklift series.
-
In Jan. 2024: Hyster-Yale (US) introduced the J32-40UTTL, a new 1.4-1.8 ton electric forklift truck. This launch expands their zero-emission industrial vehicle options.
| Report Attributes | Details |
|---|---|
| Market Size in 2023 | US$ 41.5 Billion |
| Market Size by 2032 | US$ 61.67 Billion |
| CAGR | CAGR of 4.5% From 2024 to 2032 |
| Base Year | 2023 |
| Forecast Period | 2024-2032 |
| Historical Data | 2020-2022 |
| Report Scope & Coverage | Market Size, Segments Analysis, Competitive Landscape, Regional Analysis, DROC & SWOT Analysis, Forecast Outlook |
| Key Segments | • By Vehicle Type & Capacity (Forklifts (<5 ton, 5-10 ton, 11-36 ton, >36 ton), Aisle Trucks (<1 ton, 1-2 ton, >2 ton), Tow Tractors (<5 ton, 5-10 ton, 11-30 ton, >30 ton), Container Handlers (<30 ton, 30-40 ton, >40 ton), Automated Guided Vehicles, Personnel Carriers) • By Drive Type (Internal Combustion Engine Industrial Vehicles, Battery-operated Industrial Vehicles, Gas-powered Industrial Vehicles) • By Application (Manufacturing (Chemical, Food & Beverages, Mining, Automotive, Metals & Heavy Machinery, Others), Warehousing, Freight & Logistics, Others) • By Level of Autonomy (Non/Semi-autonomous, Autonomous) |
| Regional Analysis/Coverage | North America (USA, Canada, Mexico), Europe (North America (US, Canada, Mexico), Europe (Eastern Europe [Poland, Romania, Hungary, Turkey, Rest of Eastern Europe] Western Europe] Germany, France, UK, Italy, Spain, Netherlands, Switzerland, Austria, Rest of Western Europe]), Asia Pacific (China, India, Japan, South Korea, Vietnam, Singapore, Australia, Rest of Asia Pacific), Middle East & Africa (Middle East [UAE, Egypt, Saudi Arabia, Qatar, Rest of Middle East], Africa [Nigeria, South Africa, Rest of Africa], Latin America (Brazil, Argentina, Colombia, Rest of Latin America) |
| Company Profiles | Robert Bosch Automotive Steering GmbH, Hyundai Mobis Co., Ltd., Electric Steering JTEKT Corporation, ZF TRW Automotive Holdings Corp., NSK Ltd., Nexteer Automotive Group Limited, Mando Corporation, ThyssenKrupp Ag, Showa Corporation, China Automotive System |
| Key Drivers | • Digitalization, Efficiency Demands, and Government Funding Fuel Industrial Vehicle Market Growth |
| Restraints | • The high initial cost of industrial vehicles, especially those with advanced features, can be a barrier for some companies. • Maintenance and repair costs for complex industrial vehicles can be substantial, adding to operational expenses. |
Frequently Asked Questions
Ans: Parts shortages and production delays due to the Russia-Ukraine war.
Ans: Asia Pacific (40% share) due to its growing automotive industry and urbanization.
Ans: 5-10 tons for handling standard pallets.
Ans: The Industrial Vehicles Market was valued at USD 41.5 billion in 2023.
Ans: The expected CAGR of the global Industrial Vehicles Market during the forecast period is 4.5%.
Get in Touch
