Data Monetization Market Size & Overview:
Get more information on Data Monetization Market - Request Sample Report
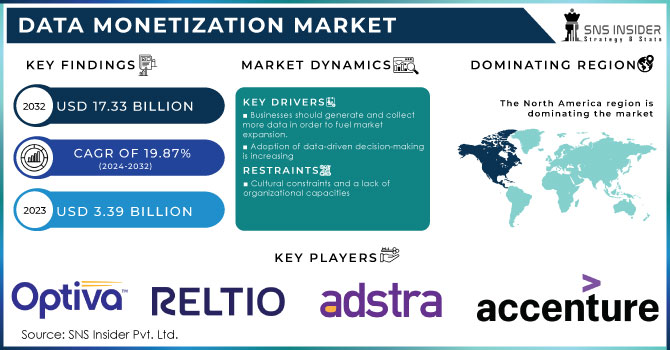
Data Monetization Market Size was valued at USD 3.39 Billion in 2023 and is expected to reach USD 17.33 Billion by 2032, growing at a CAGR of 19.87% over the forecast period 2024-2032.
The data monetization market analysis highlights government policies are driving the data monetization market growth globally as governments recognize the value of data as a strategic asset. For instance, the U.S. government has established the Federal Data Strategy aimed at facilitating the efficient use of data assets by both public and private sectors. This data monetization market trend is explained by the focus of government on stimulating innovation and improving economic opportunities through useful data points. The U.S. National Institute of Standards and Technology states that the U.S. government has already developed and is to implement multiple programs aimed at promoting proper data management and monetization.
Besides, the European Commission adopted the Data Governance Act in 2021, which creates a single market for data to allow companies to share and monetize data across the EU’s borders more efficiently. Funds for the support of data-driven technologies are allocated within the framework of the National Data Strategy of 2021 by the U.K. Government. It is estimated that by 2025 improved data usage will add £241 billion to the U.K. economy. Therefore, it is possible to conclude that as government policies promote the use of data monetization solutions through the provision of both the regulatory framework and financial support, the market’s growth will be further accelerated in 2024 and later.
Data Monetization Market Dynamics:
Drivers:
- Businesses Should Generate and Collect More Data in Order to Fuel Market Expansion
- Adoption of Data-driven Decision-making is Driving Market Growth
The growth of the market is driven by the gradual transfer to data-driven decision-making. With the increasing amount of information generated and collected by companies, the value of using these data for obtaining insights and boosting operational efficiency has also grown. According to the International Data Corporation (IDC), global data creation will reach 180 zettabytes in 2024, which is more than double the global datasphere’s 79 zettabytes in 2021. At this, businesses implement tools to collect and analyze this huge information flow to support and implement improvements to their strategy.
Moreover, the government also promotes such transition, as the European Union’s Digital Strategy encourages the use of data-driven technologies to support and promote the emergence of data-driven decision-making both in the public and private sectors. In the U.S., the Federal Data Strategy suggests that the government should upgrade data use in decision-making, as responsible and resourceful use of data is considered to be vital for economic development and growth, such as increased efficiency of services in the energy sector. As a result of the above, businesses increasingly invest in advanced data platforms and analytics software, hoping to make a profit from a vast amount of data and rely on data-driven decision-making processes. These factors contributed to the growth of the data monetization market and stimulated the demand for these solutions.
Restraints:
- Cultural Constraints and a Lack of Organizational Capacities Hamper Market Expansion
The biggest obstacles to utilizing big data in an organization are organizational competencies and culture. Implementing data Monetization tools is anticipated to be hampered by obstacles like insufficient roles and responsibilities, ineffective organizational processes, a lack of management focus and support, and a lack of procedures and quality measurements. An appropriate culture that can adequately support the development of new offers is necessary for data Monetization. This culture must also include a certain set of processes, resources, and capabilities.
Since data Monetization is all about developing a new line of business, having a clear business strategy, a capable team, and a strong business unit leader are urgently needed. Giving staff the appropriate data set and useful tools is insufficient. Additionally, it's important to inform them of the organizational culture, structure, necessary skills, procedures, and behaviors to support the chosen data Monetization business model.
Data Monetization Market Segmentation Analysis:
By Method
In 2023, the analytics-enabled platform as a service segment has accounted for the largest revenue share, of about 36%. The growth can be driven by the increase in demand for real-time analytics and the provision of advanced machine learning and artificial intelligence capabilities through data platforms. Governments of various countries are also projected to encourage organizations to procure cloud-based analytics solutions to make data processing more streamlined and efficient.
According to the U.S. Bureau of Economic Analysis, demand for cloud-based platforms increased by about 18% in 2022, as various industries are purchasing analytics platforms to glean actionable insights from the organization of large local datasets.0 The embedded analytics are expected to grow at a significant CAGR recorded over the period of 2024-2032 because various sectors are requiring real-time decision-making solutions. The applications of embedded analytics in healthcare and manufacturing are generating swift, actionable insights. The U.K. Government’s Office for National Statistics stated that industries that introduced embedded analytics reported a 12% productivity improvement, as observed in 2023., further stipulating the popularization of implementing embedded analytics in multiple sectors in the future.
By Organization Size
Analysis of the data monetization market in 2023 indicated that large enterprises were the leading source of revenue for the data monetization industry, with a 68% data monetization market share. In general, large organizations tend to require larger, more organized, and well-established efforts in processing and analyzing data for monetization. Government sources confirm this trend, as the U.S. Census Bureau reported that overall data-driven decision-making processes doubled in large corporations with more than 500 employees from 2021 to 2023.
Moreover, large enterprises would be more likely to adopt high-end data monetization platforms, as they would have more sophisticated datasets to combine from several business units. In the European Union, 58% of large enterprises used big data and analytics tools in 2023, compared to 26% of small and medium-sized enterprises. As large organizations have the necessary scale of operation, employees, and infrastructure to promote data monetization tools effectively, they should remain the main factor and the main source of revenue for the market in the future.
By Vertical
The BFSI segment had the largest revenue share of 20.3% in 2023. This growth attributed to the growing need for financial organizations to utilize data in order to gain precise customer insights, accurately detect fraud, and manage risks. According to the report by the Financial Stability Board, financial institutions worldwide are spending robustly on data monetization platforms that contribute to better regulatory compliance and customer personalization. According to a recent report, 78% of banks across the globe have implemented data monetization strategies that allow them to analyze customer behavior better, and finance the most suitable products in 2023.
Moreover, the Reserve Bank of India also reports a 15% increase in the adoption of AI-based data monetization platforms by Indian financial organizations in 2023. The primary purpose is to improve financial inclusion and fraud detection. In other words, the BFSI’s growth in the accepted use of data platforms for risks and compliance provided by regulatory authorities firmly establishes its supreme position in the industry.
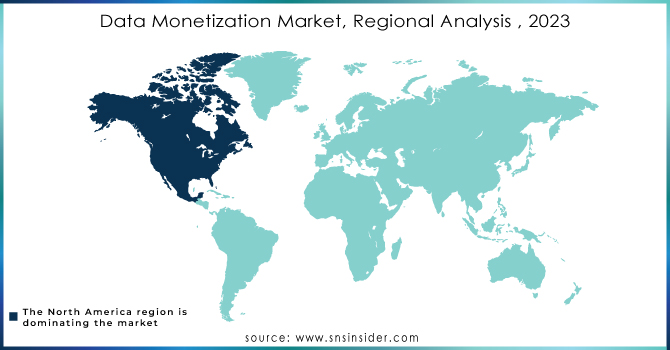
Regional Analysis:
In 2023, North America dominated the data monetization market, accounting for 33% of the global revenue share. The region’s growth is attributed to the region’s advanced technological infrastructure, increased use of cloud computing, and the government’s effort to drive data monetization across different sectors. The government of the U.S. continues to invest in data infrastructures, and it recently launched the Data.gov platform, which provides over 230,000 available datasets. This has driven the use of data in industries, such as healthcare, retail, and manufacturing. Specifically, the U.S. Department of Commerce reports that the data economy contributed about USD 203 billion to the U.S. GDP in 2023.
Canada is also a significant contributor due to the government’s efforts to support businesses in responsibly monetizing their data with the launch of the Digital Charter. Therefore, with sufficient government support and the presence of the right infrastructure, North America is projected to lead the data monetization market. Companies operating in the U.S. and Canada are investing in and quickly implementing cutting-edge technology, such as analytics, big data, and cloud computing. As a result, North America gained the upper hand.
The Asia Pacific region's market expansion is anticipated to be further fuelled throughout the forecast year by the region's expanding usage of cloud, IoT, and big data solutions. The rapid growth of e-commerce, rising manufacturing, the expansion of the automobile industry, and increased regulatory requirements have all had a favorable impact on regional growth.
Need any customization research/ data on Data Monetization Market - Enquiry Now
Key Players:
The major data monetization companies are:
- IBM Corporation (IBM Cloud Pak for Data, IBM InfoSphere)
- Microsoft Corporation (Azure Synapse Analytics, Power BI)
- Google LLC (Google BigQuery, Google Cloud Dataflow)
- Amazon Web Services (AWS) (Amazon Redshift, AWS Data Exchange)
- Oracle Corporation (Oracle Cloud Infrastructure Data Science, Oracle Analytics Cloud)
- SAP SE (SAP HANA, SAP Data Intelligence)
- Salesforce.com, Inc. (Salesforce Einstein Analytics, MuleSoft)
- Snowflake Inc. (Snowflake Data Marketplace, Snowflake Data Cloud)
- Cloudera, Inc. (Cloudera Data Platform, Cloudera Altus)
- SAS Institute Inc. (SAS Data Management, SAS Viya)
- Teradata Corporation (Teradata Vantage, Teradata IntelliCloud)
- Informatica LLC (Informatica Cloud Data Integration, Informatica Axon)
- Domo, Inc. (Domo Business Cloud, Domo Data Experience)
- TIBCO Software Inc. (TIBCO Data Virtualization, TIBCO Spotfire)
- Qlik Technologies Inc. (Qlik Sense, Qlik Data Integration)
- Alteryx, Inc. (Alteryx Designer, Alteryx Analytics Hub)
- Cognizant Technology Solutions (Cognizant Digital Systems & Technology, Cognizant Data Intelligence)
- Accenture Plc (Accenture Data Monetization Platform, Accenture AI-powered Analytics)
- Cisco Systems, Inc. (Cisco Kinetic, Cisco Data Center Network Manager)
- Hewlett Packard Enterprise (HPE) (HPE Ezmeral Data Fabric, HPE GreenLake) and others
Recent Market News:
April 2024: Data exchange platform of Revelate is now available at the Amazon Web Services Marketplace to simplify data discovery, monetization, and sharing for organizations.
October 2023: Narrative I/O partnered with Snowflake to unite data across The Trade Desk through Snowflake Marketplace and drive data-driven digital media campaigns for less cost.
March 2023: Revelate joined forces with Matillion to facilitate the way for companies to commercialize their data, allowing organizations to monetize previously unattainable datasets, combining the Revelate Data Marketplace with Matillion’s Data Integration Platform.
July 2024: The U.S. Department of Commerce partnered with the major cloud service providers to employ more data-sharing practices and drive data monetization across a range of industries, such as manufacturing, and healthcare, improving accessibility of data-driven insights for SMEs.
| Report Attributes | Details |
| Market Size in 2023 | USD 3.39 Billion |
| Market Size by 2032 | USD 17.33 Billion |
| CAGR | CAGR of 19.87 % From 2024 to 2032 |
| Base Year | 2023 |
| Forecast Period | 2024-2032 |
| Historical Data | 2020-2022 |
| Report Scope & Coverage | Market Size, Segments Analysis, Competitive Landscape, Regional Analysis, DROC & SWOT Analysis, Forecast Outlook |
| Key Segments | • By Method (Data as a Service, Insight as a Service, Analytics-enabled Platform as a Service, Embedded Analytics) • By Organization Size (Large Enterprises, SMEs) • By Component (Consulting, Implementation & Integration, Services, Supporting and Maintenance, Tools) • By Application (Customer Service, Sales & Marketing, Finance, Others) • By Vertical (BFSI, E-commerce & Retail, Telecommunications & IT, Manufacturing, Healthcare, Energy & Utilities, Others) |
| Regional Analysis/Coverage | North America (USA, Canada, Mexico), Europe (Germany, UK, France, Italy, Spain, Netherlands, Rest of Europe), Asia-Pacific (Japan, South Korea, China, India, Australia, Rest of Asia-Pacific), The Middle East & Africa (Israel, UAE, South Africa, Rest of Middle East & Africa), Latin America (Brazil, Argentina, Rest of Latin America) |
| Company Profiles |
IBM Corporation, Microsoft Corporation, Google LLC, Amazon Web Services (AWS), Oracle Corporation, SAP SE, Salesforce.com, Inc., Snowflake Inc., Cloudera, Inc., SAS Institute Inc., Teradata Corporation, Informatica LLC |
| Key Drivers | • Businesses should generate and collect more data in order to fuel market expansion. • Adoption of data-driven decision-making is increasing |
| Market Opportunitie | •Increasing the use of AI in data processing |
Get in Touch
