Remote Home Monitoring Systems Market Report Scope & Overview:

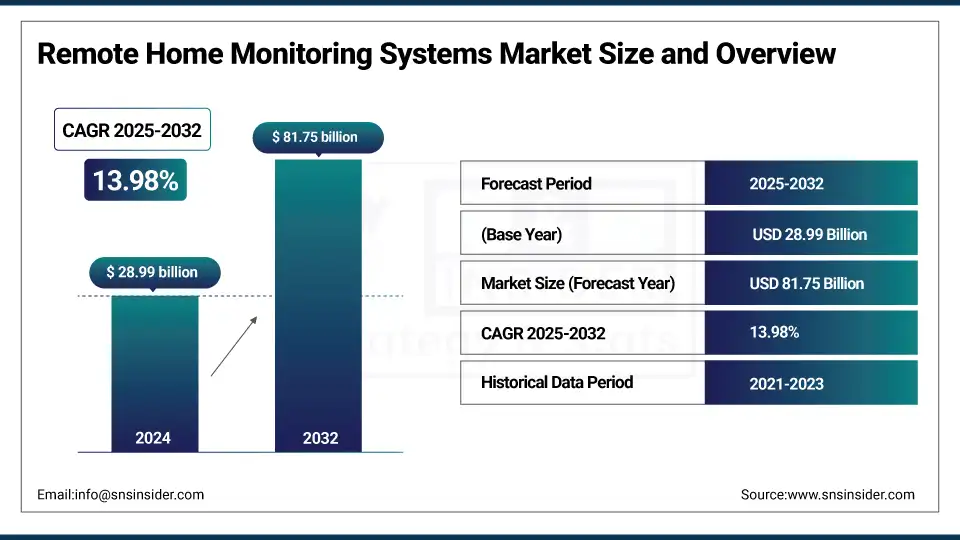
Remote Home Monitoring Systems Market was valued at USD 28.99 billion in 2024 and is expected to reach USD 81.75 billion by 2032, growing at a CAGR of 13.98% from 2025-2032. 

The Remote Home Monitoring Systems Market is witnessing rapid growth due to increasing consumer demand for enhanced home security and automation solutions. Rising adoption of smart home devices, including sensors, alarms, and cameras, coupled with growing awareness about property and personal safety, is driving market expansion. A study published in the National Library of Medicine found that 68% of respondents reported using smart home devices, highlighting widespread consumer adoption.

Integration of advanced technologies such as AI, IoT, and cloud-based monitoring enables real-time surveillance, remote control, and predictive alerts, enhancing user convenience. Additionally, urbanization and smart city initiatives are fueling market adoption across residential and commercial sectors.

For instance, the U.S.-China Economic and Security Review Commission reported that Chinese government officials are leveraging smart cities technologies including IoT, mobile internet, cloud computing, and big data to expand, improve, and automate information collection and analysis, further demonstrating the push for integrated, technology-driven monitoring solutions. Rising disposable incomes and the need for energy-efficient, automated home management solutions are accelerating revenue growth globally.

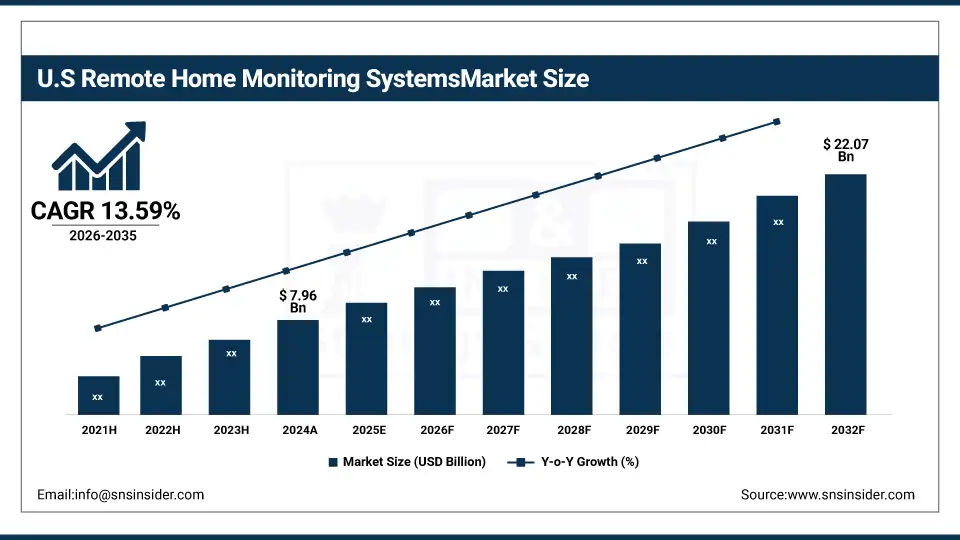
U.S. Remote Home Monitoring Systems Market was valued at USD 7.96 billion in 2024 and is expected to reach USD 22.07 billion by 2032, growing at a CAGR of 13.59% from 2025-2032. 

The U.S. Remote Home Monitoring Systems Market is growing due to increasing demand for smart home security, adoption of IoT and AI-enabled devices, and rising awareness of property and personal safety. Convenience, real-time monitoring, and integration with mobile platforms are further driving widespread adoption across residential and commercial sectors.

Market Dynamics

Drivers

  • Growing demand for continuous health monitoring driven by aging populations and rising chronic disease prevalence worldwide

The increasing global elderly population and rising cases of chronic illnesses such as diabetes, cardiovascular disorders, and respiratory conditions are fueling the adoption of remote home monitoring systems. In the United States, approximately 60% of adults have at least one chronic condition, and 40% have two or more, with chronic diseases accounting for about 90% of the nation’s USD 4.1 trillion in annual healthcare expenditures.

These technologies enable healthcare providers to track patients’ vital signs and health data in real time, ensuring timely interventions and reducing hospital readmissions. With healthcare systems under pressure to manage growing patient loads efficiently, remote monitoring provides a cost-effective solution that enhances patient outcomes. The growing focus on preventive care, early diagnosis, and long-term management of chronic diseases further accelerates demand for these systems across developed and emerging markets alike.

Restraints

  • Data privacy concerns and regulatory compliance complexities affecting system adoption across multiple markets

Remote home monitoring systems handle sensitive patient health data, making them vulnerable to cybersecurity threats, unauthorized access, and potential misuse. Stringent data protection regulations such as HIPAA in the U.S. and GDPR in Europe require strict compliance, adding operational complexity for providers. The challenge of ensuring secure transmission, storage, and sharing of data is compounded by varying regulatory requirements across regions. Healthcare providers must invest in robust encryption, authentication, and compliance measures, which increases operational costs. Persistent concerns about data breaches and patient confidentiality slow down user trust and widespread adoption, particularly among older or less tech-savvy populations.

Opportunities

  • Expanding adoption of AI-driven predictive analytics to improve health outcomes and personalize patient care plans

The integration of artificial intelligence into remote monitoring platforms is unlocking advanced capabilities for predictive health analytics and personalized care delivery. AI algorithms can analyze large volumes of real-time patient data to detect early signs of deterioration, predict potential health risks, and recommend timely interventions.

For instance, the U.S. Department of Veterans Affairs has collaborated with DeepMind to develop AI software that predicts acute kidney injury (AKI) in patients, utilizing 700,000 medical records to train AI algorithms on predicting AKI, a sudden kidney failure often linked with surgeries or infections. This enables proactive treatment strategies, reducing hospitalizations and improving patient outcomes. Personalized health plans based on continuous monitoring also enhance patient engagement and adherence. As AI technology matures, healthcare providers and payers increasingly see its potential to optimize care pathways, making it a key driver of market expansion in the coming years.

Challenges

  • Limited digital literacy among elderly patients and rural populations hindering effective system utilization and engagement

Many potential users of remote home monitoring systems, particularly elderly individuals and residents of rural areas, face difficulties in using digital health technologies. Limited familiarity with smartphones, wearable devices, and telemedicine applications reduces system effectiveness. Training programs and user-friendly designs are essential, but they require additional resources from healthcare providers. In rural regions, inconsistent internet connectivity further hampers adoption. These barriers can lead to poor compliance with monitoring protocols, reducing the accuracy of health data and diminishing the potential benefits of the system. Bridging this digital skills gap is critical for maximizing market growth potential.

Segment Analysis

By Product

Security cameras dominated the market in 2024 with a 30% revenue share due to their effectiveness in real-time surveillance, crime deterrence, and evidence collection. Enhanced by AI-based analytics, remote access, and high-resolution imaging, they remain a primary choice for homeowners. Increasing affordability, easy installation, and integration with other home monitoring devices further boost demand, making them a critical component of comprehensive residential and commercial security systems globally.

Electronic and smart locks are projected to grow at an exceptional CAGR of 15.93% from 2025 to 2032, driven by rising adoption of keyless entry, mobile app-based control, and integration with broader smart home ecosystems. The increasing need for convenience, enhanced safety, and real-time access monitoring in residential and commercial spaces supports their rapid uptake. Growing IoT adoption and rising consumer preference for advanced, connected security solutions further accelerate their global market expansion.
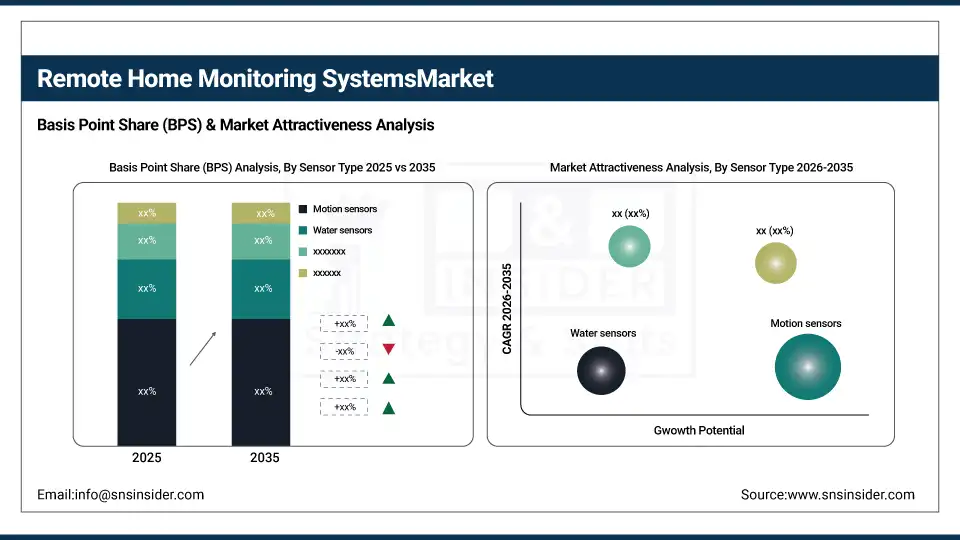
By Sensor Type

Motion sensors led the market in 2024 with a 29% share owing to their vital role in detecting unauthorized movement and triggering alarms or camera activation. Their affordability, ease of integration, and reliability make them essential in modern security setups. Advancements in sensor accuracy, wireless technology, and energy efficiency have further solidified their adoption. Rising consumer demand for proactive intrusion detection drives their strong position in home monitoring solutions.

Environmental sensors are set to grow at the fastest CAGR of 16.84% between 2025 and 2032, fueled by rising awareness of hazards such as smoke, gas leaks, flooding, and poor air quality. Their ability to provide early alerts enhances safety in homes and businesses. Increasing integration with connected systems, combined with growing health and environmental safety concerns, is spurring adoption across residential, industrial, and commercial applications worldwide.

By Operating System

Android dominated the market in 2024 with a 53% revenue share, benefiting from its global smartphone leadership, affordability, and compatibility with diverse remote monitoring applications and IoT devices. Its open-source nature facilitates rapid innovation and integration with multiple hardware systems. Strong penetration in emerging and developed markets, combined with a wide range of cost-effective devices, continues to make Android the preferred platform for home monitoring solutions worldwide.

iOS is expected to grow at the fastest CAGR of 14.96% from 2025 to 2032 due to rising adoption of Apple’s smart home ecosystem, strong brand loyalty, and premium device performance. Seamless interoperability with HomeKit-enabled security devices and high data security standards attract affluent consumers. Increasing use of advanced monitoring apps optimized for iOS, coupled with growing smart home penetration in high-income households, supports robust growth in the coming years.

By Platform

The mobile segment dominated in 2024 with a 69% revenue share and is projected to grow at the fastest CAGR of 14.77% from 2025 to 2032 due to its central role in enabling real-time access, control, and monitoring of home security systems through smartphones and tablets. Increasing smartphone penetration, user-friendly mobile applications, and seamless integration with IoT-enabled devices drive adoption. The convenience of remote alerts, live video feeds, and instant notifications enhances user engagement, while continuous app innovations and 5G connectivity further accelerate demand across both developed and emerging markets.
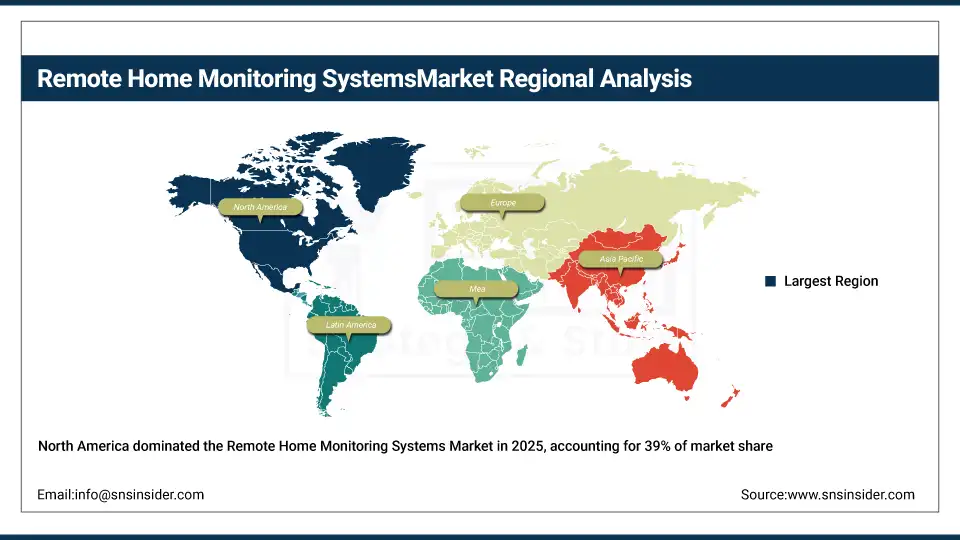
Regional Analysis

North America dominated the market in 2024 with a 39% revenue share due to advanced smart home adoption, strong presence of leading technology providers, and high consumer awareness regarding security solutions. Widespread broadband connectivity, robust IoT infrastructure, and supportive government initiatives for smart city development further strengthened regional growth. High disposable incomes and early adoption of innovative home monitoring technologies have made North America a key hub for market leadership.

The United States is dominating the Remote Home Monitoring Systems Market, driven by high smart home adoption, advanced IoT infrastructure, and strong consumer security awareness.

Asia Pacific is expected to grow at the fastest CAGR of 16.45% from 2025 to 2032 driven by rapid urbanization, rising disposable incomes, and increasing adoption of smart home technologies in emerging economies like China and India. Expanding internet penetration, government-led digital infrastructure projects, and growing safety concerns in densely populated cities are fueling demand. The presence of cost-effective device manufacturers and expanding e-commerce channels further accelerates market growth in the region.

China is dominating the Remote Home Monitoring Systems Market in Asia Pacific, driven by rapid urbanization, strong manufacturing capabilities, and widespread adoption of smart home technologies.

Europe’s Remote Home Monitoring Systems Market is driven by growing smart home adoption, stringent security regulations, and advanced IoT infrastructure. Rising consumer focus on safety, energy efficiency, and integration of AI-powered monitoring solutions further supports strong market expansion across the region.

The United Kingdom is dominating the Remote Home Monitoring Systems Market in Europe, supported by strong smart home adoption, advanced connectivity, and high consumer investment in security technologies.

The Middle East & Africa market is growing due to increasing urbanization, rising security concerns, and expanding smart infrastructure projects. Latin America is witnessing growth driven by improving internet penetration, affordable device availability, and rising adoption of connected home security solutions.

Key Players

Honeywell International Inc., Ooma, Inc., IBM Corporation, SimpliSafe, Inc., General Electric Company, Bosch Security Systems, Inc., Schneider Electric S.E., Tyco International Ltd, Nortek Security & Control, LLC., Control4 Corporation, Apple Inc., Google Inc., Samsung Electronics Co. Ltd, Visonic Limited, Siemens Corporation, LOREX Technology Inc., ADT Inc., Vivint, Inc., Ring LLC, Brinks Home Security.

Recent Developments:

  • 2025: Google Home app added full compatibility for Nest Protect smoke and CO alarms, enabling emergency alerts, safety checkups, and control without the standalone Nest app.

  • 2024: ADT Inc. Introduced ADT+ platform in 2024, unifying professional monitoring, smart devices, Google Nest integration, remote assistance, and the new Trusted Neighbor feature for secure, time-limited home access.

Remote Home Monitoring Systems Market Report Scope:

Report Attributes Details
Market Size in 2024 USD 28.99 Billion 
Market Size by 2032 USD 81.75 Billion 
CAGR CAGR of 13.98% From 2025 to 2032
Base Year 2024
Forecast Period 2025-2032
Historical Data 2021-2023
Report Scope & Coverage Market Size, Segments Analysis, Competitive Landscape, Regional Analysis, DROC & SWOT Analysis, Forecast Outlook
Key Segments • By Sensor Type (Motion Sensors, Water Sensors, Glass Sensors, Door Sensors, Environmental Sensors, Others)
• By Product (Electronic and Smart Locks, Alarms, Security Cameras, Security Solutions, DIY Home Security, Sensors, Detectors, Others)
• By Platform (Mobile, Desktop)
• By Operating System (Android, iOS, Windows)
Regional Analysis/Coverage North America (US, Canada), Europe (Germany, UK, France, Italy, Spain, Russia, Poland, Rest of Europe), Asia Pacific (China, India, Japan, South Korea, Australia, ASEAN Countries, Rest of Asia Pacific), Middle East & Africa (UAE, Saudi Arabia, Qatar, South Africa, Rest of Middle East & Africa), Latin America (Brazil, Argentina, Mexico, Colombia, Rest of Latin America).
Company Profiles Honeywell International Inc., Ooma, Inc., IBM Corporation, SimpliSafe, Inc., General Electric Company, Bosch Security Systems, Inc., Schneider Electric S.E., Tyco International Ltd, Nortek Security & Control, LLC., Control4 Corporation, Apple Inc., Google Inc., Samsung Electronics Co. Ltd, Visonic Limited, Siemens Corporation, LOREX Technology Inc., ADT Inc., Vivint, Inc., Ring LLC, Brinks Home Security

Table Of Contents

1. Introduction

1.1 Market Definition & Scope

 1.2 Research Assumptions & Abbreviations

 1.3 Research Methodology

2. Executive Summary

2.1 Market Snapshot

 2.2 Market Absolute $ Opportunity Assessment & Y-o-Y Analysis, 2021–2032

 2.3 Market Size & Forecast, By Segmentation, 2021–2032

  2.3.1 Market Size By Product

  2.3.2 Market Size By Sensor Type

  2.3.3 Market Size By Platform

  2.3.4 Market Size By Operating System

 2.4 Market Share & Bps Analysis By Region, 2024

 2.5 Industry Growth Scenarios – Conservative, Likely & Optimistic

 2.6 Industry CxO’s Perspective

3. Market Overview

3.1 Market Dynamics

  3.1.1 Drivers

  3.1.2 Restraints

  3.1.3 Opportunities

  3.1.4 Key Market Trends

 3.2 Industry PESTLE Analysis

 3.3 Key Industry Forces (Porter’s) Impacting Market Growth

 3.4 Industry Supply Chain Analysis

  3.4.1 Raw Material Suppliers

  3.4.2 Manufacturers

  3.4.3 Distributors/Suppliers

  3.4.4 Customers/End-Users

 3.5 Industry Life Cycle Assessment

 3.6 Parent Market Overview

 3.7 Market Risk Assessment

4. Statistical Insights & Trends Reporting

4.1 Pricing Analysis & Forecast

  4.1.1 Overview

  4.1.2 Average Device Price By Platform

  4.1.3 Subscription & Service Fee Models (Monthly vs. Annual)

  4.1.4 Price Benchmarking by Key Vendors

  4.1.5 Forecast of Price Trends for Smart Home Integration

4.2 Regulatory & Compliance Landscape

  4.2.1 Overview

  4.2.2 Regional Safety & Data Privacy Regulations

  4.2.3 Device Certification & Compliance Rates (%)

  4.2.4 Liability & Insurance Policies for Monitored Homes

  4.2.5 Future Regulatory Outlook: Smart Home Security & IoT Standards

4.3 Installation & Deployment Metrics

  4.3.1 Overview

  4.3.2 Average Installation Time by System Type

  4.3.3 Share of DIY vs. Professional Installation (%)

  4.3.4 System Coverage per Home (Number of Sensors, Cameras, Hubs)

  4.3.5 Integration with Smart Home Platforms

4.4 User Adoption & Engagement

  4.4.1 Overview

  4.4.2 Adoption Rate by Household Type (Apartment vs. Single-Family Home)

  4.4.3 Active vs. Inactive User Ratios (%)

  4.4.4 Average Daily Monitoring & Alerts per Home

  4.4.5 User Engagement with Mobile Apps & Remote Access Features

4.5 Performance & Reliability Metrics

  4.5.1 Overview

  4.5.2 Device Uptime & Connectivity Rates (%)

  4.5.3 Average Response Time to Alerts

  4.5.4 False Alarm Rates & Resolution Statistics (%)

  4.5.5 Annual Reduction in Security Incidents Due to Monitoring Systems

5. Remote Home Monitoring Systems Market Segmental Analysis & Forecast, By Product, 2021 – 2032, Value (Usd Billion)

5.1 Introduction

 5.2 Electronic and smart locks

  5.2.1 Key Trends

  5.2.2 Market Size & Forecast, 2021 – 2032

 5.3 Alarms

  5.3.1 Key Trends

  5.3.2 Market Size & Forecast, 2021 – 2032

 5.4 Security cameras

  5.4.1 Key Trends

  5.4.2 Market Size & Forecast, 2021 – 2032

 5.5 Security cameras

  5.5.1 Key Trends

  5.5.2 Market Size & Forecast, 2021 – 2032

 5.6 DIY home security

  5.6.1 Key Trends

  5.6.2 Market Size & Forecast, 2021 – 2032

 5.7 Sensors

  5.7.1 Key Trends

  5.7.2 Market Size & Forecast, 2021 – 2032

 5.8 Detectors

  5.8.1 Key Trends

  5.8.2 Market Size & Forecast, 2021 – 2032

 5.9 Others

  5.9.1 Key Trends

  5.9.2 Market Size & Forecast, 2021 – 2032

6. Remote Home Monitoring Systems Market Segmental Analysis & Forecast, By Sensor Type, 2021 – 2032, Value (Usd Billion)

    6.1 Introduction

 6.2 Motion sensors

  6.2.1 Key Trends

  6.2.2 Market Size & Forecast, 2021 – 2032

 6.3 Water sensors

  6.3.1 Key Trends

  6.3.2 Market Size & Forecast, 2021 – 2032

 6.4 Glass sensors

  6.4.1 Key Trends

  6.4.2 Market Size & Forecast, 2021 – 2032

 6.5 Door Sensors

  6.5.1 Key Trends

  6.5.2 Market Size & Forecast, 2021 – 2032

 6.6 Environmental Sensors

  6.6.1 Key Trends

  6.6.2 Market Size & Forecast, 2021 – 2032

 6.7 Others

  6.7.1 Key Trends

  6.7.2 Market Size & Forecast, 2021 – 2032

7. Remote Home Monitoring Systems Market Segmental Analysis & Forecast, By Platform, 2021 – 2032, Value (Usd Billion)

    7.1 Introduction

 7.2 Mobile

  7.2.1 Key Trends

  7.2.2 Market Size & Forecast, 2021 – 2032

 7.3 Desktop

  7.3.1 Key Trends

  7.3.2 Market Size & Forecast, 2021 – 2032

8. Remote Home Monitoring Systems Market Segmental Analysis & Forecast, By Operating System, 2021 – 2032, Value (Usd Billion)

    8.1 Introduction

 8.2 Android

  8.2.1 Key Trends

  8.2.2 Market Size & Forecast, 2021 – 2032

 8.3 iOS

  8.3.1 Key Trends

  8.3.2 Market Size & Forecast, 2021 – 2032

 8.4 Windows

  8.4.1 Key Trends

  8.4.2 Market Size & Forecast, 2021 – 2032

9. Remote Home Monitoring Systems Market Segmental Analysis & Forecast By Region, 2021 – 2025, Value (Usd Billion)

9.1 Introduction

9.2 North America

 9.2.1 Key Trends

 9.2.2 Remote Home Monitoring Systems Market Size & Forecast, By Product, 2021 – 2032

 9.2.3 Remote Home Monitoring Systems Market Size & Forecast, By Sensor Type, 2021 – 2032

 9.2.4 Remote Home Monitoring Systems Market Size & Forecast, By Platform, 2021 – 2032

 9.2.5 Remote Home Monitoring Systems Market Size & Forecast, By Operating System, 2021 – 2032

 9.2.6 Remote Home Monitoring Systems Market Size & Forecast, By Country, 2021 – 2032

  9.2.6.1 USA

   9.2.6.1.1 Remote Home Monitoring Systems Market Size & Forecast, By Product, 2021 – 2032

   9.2.6.1.2 Remote Home Monitoring Systems Market Size & Forecast, By Sensor Type, 2021 – 2032

   9.2.6.1.3 Remote Home Monitoring Systems Market Size & Forecast, By Platform, 2021 – 2032

   9.2.6.1.4 Remote Home Monitoring Systems Market Size & Forecast, By Operating System, 2021 – 2032

  9.2.6.2 Canada

   9.2.6.2.1 Remote Home Monitoring Systems Market Size & Forecast, By Product, 2021 – 2032

   9.2.6.2.2 Remote Home Monitoring Systems Market Size & Forecast, By Sensor Type, 2021 – 2032

   9.2.6.2.3 Remote Home Monitoring Systems Market Size & Forecast, By Platform, 2021 – 2032

   9.2.6.2.4 Remote Home Monitoring Systems Market Size & Forecast, By Operating System, 2021 – 2032

9.3 Europe

 9.3.1 Key Trends

 9.3.2 Remote Home Monitoring Systems Market Size & Forecast, By Product, 2021 – 2032

 9.3.3 Remote Home Monitoring Systems Market Size & Forecast, By Sensor Type, 2021 – 2032

 9.3.4 Remote Home Monitoring Systems Market Size & Forecast, By Platform, 2021 – 2032

 9.3.5 Remote Home Monitoring Systems Market Size & Forecast, By Operating System, 2021 – 2032

 9.3.6 Remote Home Monitoring Systems Market Size & Forecast, By Country, 2021 – 2032

  9.3.6.1 Germany

   9.3.6.1.1 Remote Home Monitoring Systems Market Size & Forecast, By Product, 2021 – 2032

   9.3.6.1.2 Remote Home Monitoring Systems Market Size & Forecast, By Sensor Type, 2021 – 2032

   9.3.6.1.3 Remote Home Monitoring Systems Market Size & Forecast, By Platform, 2021 – 2032

   9.3.6.1.4 Remote Home Monitoring Systems Market Size & Forecast, By Operating System, 2021 – 2032

  9.3.6.2 UK

   9.3.6.2.1 Remote Home Monitoring Systems Market Size & Forecast, By Product, 2021 – 2032

   9.3.6.2.2 Remote Home Monitoring Systems Market Size & Forecast, By Sensor Type, 2021 – 2032

   9.3.6.2.3 Remote Home Monitoring Systems Market Size & Forecast, By Platform, 2021 – 2032

   9.3.6.2.4 Remote Home Monitoring Systems Market Size & Forecast, By Operating System, 2021 – 2032

  9.3.6.3 France

   9.3.6.3.1 Remote Home Monitoring Systems Market Size & Forecast, By Product, 2021 – 2032

   9.3.6.3.2 Remote Home Monitoring Systems Market Size & Forecast, By Sensor Type, 2021 – 2032

   9.3.6.3.3 Remote Home Monitoring Systems Market Size & Forecast, By Platform, 2021 – 2032

   9.3.6.3.4 Remote Home Monitoring Systems Market Size & Forecast, By Operating System, 2021 – 2032

  9.3.6.4 Italy

   9.3.6.4.1 Remote Home Monitoring Systems Market Size & Forecast, By Product, 2021 – 2032

   9.3.6.4.2 Remote Home Monitoring Systems Market Size & Forecast, By Sensor Type, 2021 – 2032

   9.3.6.4.3 Remote Home Monitoring Systems Market Size & Forecast, By Platform, 2021 – 2032

   9.3.6.4.4 Remote Home Monitoring Systems Market Size & Forecast, By Operating System, 2021 – 2032

  9.3.6.5 Spain

   9.3.6.5.1 Remote Home Monitoring Systems Market Size & Forecast, By Product, 2021 – 2032

   9.3.6.5.2 Remote Home Monitoring Systems Market Size & Forecast, By Sensor Type, 2021 – 2032

   9.3.6.5.3 Remote Home Monitoring Systems Market Size & Forecast, By Platform, 2021 – 2032

   9.3.6.5.4 Remote Home Monitoring Systems Market Size & Forecast, By Operating System, 2021 – 2032

  9.3.6.6 Russia

   9.3.6.6.1 Remote Home Monitoring Systems Market Size & Forecast, By Product, 2021 – 2032

   9.3.6.6.2 Remote Home Monitoring Systems Market Size & Forecast, By Sensor Type, 2021 – 2032

   9.3.6.6.3 Remote Home Monitoring Systems Market Size & Forecast, By Platform, 2021 – 2032

   9.3.6.6.4 Remote Home Monitoring Systems Market Size & Forecast, By Operating System, 2021 – 2032

  9.3.6.7 Poland

   9.3.6.7.1 Remote Home Monitoring Systems Market Size & Forecast, By Product, 2021 – 2032

   9.3.6.7.2 Remote Home Monitoring Systems Market Size & Forecast, By Sensor Type, 2021 – 2032

   9.3.6.7.3 Remote Home Monitoring Systems Market Size & Forecast, By Platform, 2021 – 2032

   9.3.6.7.4 Remote Home Monitoring Systems Market Size & Forecast, By Operating System, 2021 – 2032

  9.3.6.8 Rest of Europe

   9.3.6.8.1 Remote Home Monitoring Systems Market Size & Forecast, By Product, 2021 – 2032

   9.3.6.8.2 Remote Home Monitoring Systems Market Size & Forecast, By Sensor Type, 2021 – 2032

   9.3.6.8.3 Remote Home Monitoring Systems Market Size & Forecast, By Platform, 2021 – 2032

   9.3.6.8.4 Remote Home Monitoring Systems Market Size & Forecast, By Operating System, 2021 – 2032   

9.4 Asia-Pacific

 9.4.1 Key Trends

 9.4.2 Remote Home Monitoring Systems Market Size & Forecast, By Product, 2021 – 2032

 9.4.3 Remote Home Monitoring Systems Market Size & Forecast, By Sensor Type, 2021 – 2032

 9.4.4 Remote Home Monitoring Systems Market Size & Forecast, By Platform, 2021 – 2032

 9.4.5 Remote Home Monitoring Systems Market Size & Forecast, By Operating System, 2021 – 2032

 9.4.6 Remote Home Monitoring Systems Market Size & Forecast, By Country, 2021 – 2032

  9.4.6.1 China

   9.4.6.1.1 Remote Home Monitoring Systems Market Size & Forecast, By Product, 2021 – 2032

   9.4.6.1.2 Remote Home Monitoring Systems Market Size & Forecast, By Sensor Type, 2021 – 2032

   9.4.6.1.3 Remote Home Monitoring Systems Market Size & Forecast, By Platform, 2021 – 2032

   9.4.6.1.4 Remote Home Monitoring Systems Market Size & Forecast, By Operating System, 2021 – 2032

  9.4.6.2 India

   9.4.6.2.1 Remote Home Monitoring Systems Market Size & Forecast, By Product, 2021 – 2032

   9.4.6.2.2 Remote Home Monitoring Systems Market Size & Forecast, By Sensor Type, 2021 – 2032

   9.4.6.2.3 Remote Home Monitoring Systems Market Size & Forecast, By Platform, 2021 – 2032

   9.4.6.2.4 Remote Home Monitoring Systems Market Size & Forecast, By Operating System, 2021 – 2032

  9.4.6.3 Japan

   9.4.6.3.1 Remote Home Monitoring Systems Market Size & Forecast, By Product, 2021 – 2032

   9.4.6.3.2 Remote Home Monitoring Systems Market Size & Forecast, By Sensor Type, 2021 – 2032

   9.4.6.3.3 Remote Home Monitoring Systems Market Size & Forecast, By Platform, 2021 – 2032

   9.4.6.3.4 Remote Home Monitoring Systems Market Size & Forecast, By Operating System, 2021 – 2032

  9.4.6.4 South Korea

   9.4.6.4.1 Remote Home Monitoring Systems Market Size & Forecast, By Product, 2021 – 2032

   9.4.6.4.2 Remote Home Monitoring Systems Market Size & Forecast, By Sensor Type, 2021 – 2032

   9.4.6.4.3 Remote Home Monitoring Systems Market Size & Forecast, By Platform, 2021 – 2032

   9.4.6.4.4 Remote Home Monitoring Systems Market Size & Forecast, By Operating System, 2021 – 2032

  9.4.6.5 Australia

   9.4.6.5.1 Remote Home Monitoring Systems Market Size & Forecast, By Product, 2021 – 2032

   9.4.6.5.2 Remote Home Monitoring Systems Market Size & Forecast, By Sensor Type, 2021 – 2032

   9.4.6.5.3 Remote Home Monitoring Systems Market Size & Forecast, By Platform, 2021 – 2032

   9.4.6.5.4 Remote Home Monitoring Systems Market Size & Forecast, By Operating System, 2021 – 2032

  9.4.6.6 ASEAN Countries

   9.4.6.6.1 Remote Home Monitoring Systems Market Size & Forecast, By Product, 2021 – 2032

   9.4.6.6.2 Remote Home Monitoring Systems Market Size & Forecast, By Sensor Type, 2021 – 2032

   9.4.6.6.3 Remote Home Monitoring Systems Market Size & Forecast, By Platform, 2021 – 2032

   9.4.6.6.4 Remote Home Monitoring Systems Market Size & Forecast, By Operating System, 2021 – 2032

  9.4.6.7 Rest of Asia-Pacific

   9.4.6.7.1 Remote Home Monitoring Systems Market Size & Forecast, By Product, 2021 – 2032

   9.4.6.7.2 Remote Home Monitoring Systems Market Size & Forecast, By Sensor Type, 2021 – 2032

   9.4.6.7.3 Remote Home Monitoring Systems Market Size & Forecast, By Platform, 2021 – 2032

   9.4.6.7.4 Remote Home Monitoring Systems Market Size & Forecast, By Operating System, 2021 – 2032

9.5 Latin America

 9.5.1 Key Trends

 9.5.2 Remote Home Monitoring Systems Market Size & Forecast, By Product, 2021 – 2032

 9.5.3 Remote Home Monitoring Systems Market Size & Forecast, By Sensor Type, 2021 – 2032

 9.5.4 Remote Home Monitoring Systems Market Size & Forecast, By Platform, 2021 – 2032

 9.5.5 Remote Home Monitoring Systems Market Size & Forecast, By Operating System, 2021 – 2032

 9.5.6 Remote Home Monitoring Systems Market Size & Forecast, By Country, 2021 – 2032

  9.5.6.1 Brazil

   9.5.6.1.1 Remote Home Monitoring Systems Market Size & Forecast, By Product, 2021 – 2032

   9.5.6.1.2 Remote Home Monitoring Systems Market Size & Forecast, By Sensor Type, 2021 – 2032

   9.5.6.1.3 Remote Home Monitoring Systems Market Size & Forecast, By Platform, 2021 – 2032

   9.5.6.1.4 Remote Home Monitoring Systems Market Size & Forecast, By Operating System, 2021 – 2032

  9.5.6.2 Argentina

   9.5.6.2.1 Remote Home Monitoring Systems Market Size & Forecast, By Product, 2021 – 2032

   9.5.6.2.2 Remote Home Monitoring Systems Market Size & Forecast, By Sensor Type, 2021 – 2032

   9.5.6.2.3 Remote Home Monitoring Systems Market Size & Forecast, By Platform, 2021 – 2032

   9.5.6.2.4 Remote Home Monitoring Systems Market Size & Forecast, By Operating System, 2021 – 2032

  9.5.6.3 Mexico

   9.5.6.3.1 Remote Home Monitoring Systems Market Size & Forecast, By Product, 2021 – 2032

   9.5.6.3.2 Remote Home Monitoring Systems Market Size & Forecast, By Sensor Type, 2021 – 2032

   9.5.6.3.3 Remote Home Monitoring Systems Market Size & Forecast, By Platform, 2021 – 2032

   9.5.6.3.4 Remote Home Monitoring Systems Market Size & Forecast, By Operating System, 2021 – 2032

  9.5.6.4 Colombia

   9.5.6.4.1 Remote Home Monitoring Systems Market Size & Forecast, By Product, 2021 – 2032

   9.5.6.4.2 Remote Home Monitoring Systems Market Size & Forecast, By Sensor Type, 2021 – 2032

   9.5.6.4.3 Remote Home Monitoring Systems Market Size & Forecast, By Platform, 2021 – 2032

   9.5.6.4.4 Remote Home Monitoring Systems Market Size & Forecast, By Operating System, 2021 – 2032

  9.5.6.5 Rest of Latin America

   9.5.6.5.1 Remote Home Monitoring Systems Market Size & Forecast, By Product, 2021 – 2032

   9.5.6.5.2 Remote Home Monitoring Systems Market Size & Forecast, By Sensor Type, 2021 – 2032

   9.5.6.5.3 Remote Home Monitoring Systems Market Size & Forecast, By Platform, 2021 – 2032

   9.5.6.5.4 Remote Home Monitoring Systems Market Size & Forecast, By Operating System, 2021 – 2032

9.6 Middle East & Africa

 9.6.1 Key Trends

 9.6.2 Remote Home Monitoring Systems Market Size & Forecast, By Product, 2021 – 2032

 9.6.3 Remote Home Monitoring Systems Market Size & Forecast, By Sensor Type, 2021 – 2032

 9.6.4 Remote Home Monitoring Systems Market Size & Forecast, By Platform, 2021 – 2032

 9.6.5 Remote Home Monitoring Systems Market Size & Forecast, By Operating System, 2021 – 2032

 9.6.6 Remote Home Monitoring Systems Market Size & Forecast, By Country, 2021 – 2032

  9.6.6.1 UAE

   9.6.6.1.1 Remote Home Monitoring Systems Market Size & Forecast, By Product, 2021 – 2032

   9.6.6.1.2 Remote Home Monitoring Systems Market Size & Forecast, By Sensor Type, 2021 – 2032

   9.6.6.1.3 Remote Home Monitoring Systems Market Size & Forecast, By Platform, 2021 – 2032

   9.6.6.1.4 Remote Home Monitoring Systems Market Size & Forecast, By Operating System, 2021 – 2032

  9.6.6.2 Saudi Arabia

   9.6.6.2.1 Remote Home Monitoring Systems Market Size & Forecast, By Product, 2021 – 2032

   9.6.6.2.2 Remote Home Monitoring Systems Market Size & Forecast, By Sensor Type, 2021 – 2032

   9.6.6.2.3 Remote Home Monitoring Systems Market Size & Forecast, By Platform, 2021 – 2032

   9.6.6.2.4 Remote Home Monitoring Systems Market Size & Forecast, By Operating System, 2021 – 2032

  9.6.6.3 Qatar

   9.6.6.3.1 Remote Home Monitoring Systems Market Size & Forecast, By Product, 2021 – 2032

   9.6.6.3.2 Remote Home Monitoring Systems Market Size & Forecast, By Sensor Type, 2021 – 2032

   9.6.6.3.3 Remote Home Monitoring Systems Market Size & Forecast, By Platform, 2021 – 2032

   9.6.6.3.4 Remote Home Monitoring Systems Market Size & Forecast, By Operating System, 2021 – 2032

  9.6.6.4 Egypt

   9.6.6.4.1 Remote Home Monitoring Systems Market Size & Forecast, By Product, 2021 – 2032

   9.6.6.4.2 Remote Home Monitoring Systems Market Size & Forecast, By Sensor Type, 2021 – 2032

   9.6.6.4.3 Remote Home Monitoring Systems Market Size & Forecast, By Platform, 2021 – 2032

   9.6.6.4.4 Remote Home Monitoring Systems Market Size & Forecast, By Operating System, 2021 – 2032

  9.6.6.5 South Africa

   9.6.6.5.1 Remote Home Monitoring Systems Market Size & Forecast, By Product, 2021 – 2032

   9.6.6.5.2 Remote Home Monitoring Systems Market Size & Forecast, By Sensor Type, 2021 – 2032

   9.6.6.5.3 Remote Home Monitoring Systems Market Size & Forecast, By Platform, 2021 – 2032

   9.6.6.5.4 Remote Home Monitoring Systems Market Size & Forecast, By Operating System, 2021 – 2032

  9.6.6.6 Rest of Middle East & Africa

   9.6.6.6.1 Remote Home Monitoring Systems Market Size & Forecast, By Product, 2021 – 2032

   9.6.6.6.2 Remote Home Monitoring Systems Market Size & Forecast, By Sensor Type, 2021 – 2032

   9.6.6.6.3 Remote Home Monitoring Systems Market Size & Forecast, By Platform, 2021 – 2032

   9.6.6.6.4 Remote Home Monitoring Systems Market Size & Forecast, By Operating System, 2021 – 2032

10. Competitive Landscape

 10.1 Key Players' Positioning

 10.2 Competitive Developments

  10.2.1 Key Strategies Adopted (%), By Key Players, 2024

  10.2.2 Year-Wise Strategies & Development, 2021 – 2025

  10.2.3 Number Of Strategies Adopted By Key Players, 2024

 10.3 Market Share Analysis, 2024

 10.4 Product/Service & Application Benchmarking

  10.4.1 Product/Service Specifications & Features By Key Players

  10.4.2 Product/Service Heatmap By Key Players

  10.4.3 Application Heatmap By Key Players

 10.5 Industry Start-Up & Innovation Landscape

10.6 Key Company Profiles

   10.6.1 Honeywell International Inc.

  10.6.1.1 Company Overview & Snapshot

  10.6.1.2 Product/Service Portfolio

  10.6.1.3 Key Company Financials

  10.6.1.4 SWOT Analysis

 10.6.2 Ooma, Inc.

  10.6.2.1 Company Overview & Snapshot

  10.6.2.2 Product/Service Portfolio

  10.6.2.3 Key Company Financials

  10.6.2.4 SWOT Analysis

 10.6.3 IBM Corporation

  10.6.3.1 Company Overview & Snapshot

  10.6.3.2 Product/Service Portfolio

  10.6.3.3 Key Company Financials

  10.6.3.4 SWOT Analysis

 10.6.4 SimpliSafe, Inc.

  10.6.4.1 Company Overview & Snapshot

  10.6.4.2 Product/Service Portfolio

  10.6.4.3 Key Company Financials

  10.6.4.4 SWOT Analysis

 10.6.5 General Electric Company

  10.6.5.1 Company Overview & Snapshot

  10.6.5.2 Product/Service Portfolio

  10.6.5.3 Key Company Financials

  10.6.5.4 SWOT Analysis

 10.6.6 Bosch Security Systems, Inc.

  10.6.6.1 Company Overview & Snapshot

  10.6.6.2 Product/Service Portfolio

  10.6.6.3 Key Company Financials

  10.6.6.4 SWOT Analysis

 10.6.7 Schneider Electric S.E.

  10.6.7.1 Company Overview & Snapshot

  10.6.7.2 Product/Service Portfolio

  10.6.7.3 Key Company Financials

  10.6.7.4 SWOT Analysis

 10.6.8 Tyco International Ltd

  10.6.8.1 Company Overview & Snapshot

  10.6.8.2 Product/Service Portfolio

  10.6.8.3 Key Company Financials

  10.6.8.4 SWOT Analysis

 10.6.9 Nortek Security & Control, LLC.

  10.6.9.1 Company Overview & Snapshot

  10.6.9.2 Product/Service Portfolio

  10.6.9.3 Key Company Financials

  10.6.9.4 SWOT Analysis

 10.6.10 Control4 Corporation

  10.6.10.1 Company Overview & Snapshot

  10.6.10.2 Product/Service Portfolio

  10.6.10.3 Key Company Financials

  10.6.10.4 SWOT Analysis

 10.6.11 Apple Inc.

  10.6.11.1 Company Overview & Snapshot

  10.6.11.2 Product/Service Portfolio

  10.6.11.3 Key Company Financials

  10.6.11.4 SWOT Analysis

 10.6.12 Google Inc.

  10.6.12.1 Company Overview & Snapshot

  10.6.12.2 Product/Service Portfolio

  10.6.12.3 Key Company Financials

  10.6.12.4 SWOT Analysis

 10.6.13 Samsung Electronics Co. Ltd

  10.6.13.1 Company Overview & Snapshot

  10.6.13.2 Product/Service Portfolio

  10.6.13.3 Key Company Financials

  10.6.13.4 SWOT Analysis

 10.6.14 Visonic Limited

  10.6.14.1 Company Overview & Snapshot

  10.6.14.2 Product/Service Portfolio

  10.6.14.3 Key Company Financials

  10.6.14.4 SWOT Analysis

 10.6.15 Siemens Corporation

  10.6.15.1 Company Overview & Snapshot

  10.6.15.2 Product/Service Portfolio

  10.6.15.3 Key Company Financials

  10.6.15.4 SWOT Analysis

 10.6.16 LOREX Technology Inc.

  10.6.16.1 Company Overview & Snapshot

  10.6.16.2 Product/Service Portfolio

  10.6.16.3 Key Company Financials

  10.6.16.4 SWOT Analysis

 10.6.17 ADT Inc.

  10.6.17.1 Company Overview & Snapshot

  10.6.17.2 Product/Service Portfolio

  10.6.17.3 Key Company Financials

  10.6.17.4 SWOT Analysis

 10.6.18 Vivint, Inc.

  10.6.18.1 Company Overview & Snapshot

  10.6.18.2 Product/Service Portfolio

  10.6.18.3 Key Company Financials

  10.6.18.4 SWOT Analysis

 10.6.19 Ring LLC

  10.6.19.1 Company Overview & Snapshot

  10.6.19.2 Product/Service Portfolio

  10.6.19.3 Key Company Financials

  10.6.19.4 SWOT Analysis

 10.6.20 Brinks Home Security

  10.6.20.1 Company Overview & Snapshot

  10.6.20.2 Product/Service Portfolio

  10.6.20.3 Key Company Financials

  10.6.20.4 SWOT Analysis

11. Analyst Recommendations

 11.1 SNS Insider Opportunity Map

 11.2 Industry Low-Hanging Fruit Assessment

 11.3 Market Entry & Growth Strategy

 11.4 Analyst Viewpoint & Suggestions On Market Growth

12. Assumptions

13. Disclaimer

14. Appendix

 14.1 List Of Tables

 14.2 List Of Figures

Key Segments: 

By Sensor Type

  • Motion sensors

  • Water sensors

  • Glass sensors

  • Door Sensors

  • Environmental Sensors

  • Others

By Product

  • Electronic and smart locks

  • Alarms

  • Security cameras

  • Security Solutions

  • DIY home security

  • Sensors

  • Detectors

  • Others

By Platform

  • Mobile

  • Desktop

By Operating System

  • Android

  • iOS

  • Windows


Request for Segment Customization as per your Business Requirement: Segment Customization Request

Regional Coverage: 

North America

  • US

  • Canada

Europe

  • Germany

  • France

  • UK

  • Italy

  • Spain

  • Poland

  • Russia

  • Rest of Europe

Asia Pacific

  • China

  • India

  • Japan

  • South Korea

  • Australia

  • ASEAN Countries

  • Rest of Asia Pacific

Middle East & Africa

  • UAE

  • Saudi Arabia

  • Qatar

  • South Africa

  • Rest of Middle East & Africa

Latin America

  • Brazil

  • Argentina

  • Mexico

  • Colombia

  • Rest of Latin America

Request for Country Level Research Report: Country Level Customization Request

Available Customization 

With the given market data, SNS Insider offers customization as per the company’s specific needs. The following customization options are available for the report: 

  • Detailed Volume Analysis 

  • Criss-Cross segment analysis (e.g. Product X Application) 

  • Competitive Product Benchmarking 

  • Geographic Analysis 

  • Additional countries in any of the regions 

  • Customized Data Representation 

  • Detailed analysis and profiling of additional market players

An accurate research report requires proper strategizing as well as implementation. There are multiple factors involved in the completion of good and accurate research report and selecting the best methodology to compete the research is the toughest part. Since the research reports we provide play a crucial role in any company’s decision-making process, therefore we at SNS Insider always believe that we should choose the best method which gives us results closer to reality. This allows us to reach at a stage wherein we can provide our clients best and accurate investment to output ratio.

Each report that we prepare takes a timeframe of 350-400 business hours for production. Starting from the selection of titles through a couple of in-depth brain storming session to the final QC process before uploading our titles on our website we dedicate around 350 working hours. The titles are selected based on their current market cap and the foreseen CAGR and growth.


The 5 steps process:

Step 1: Secondary Research:

Secondary Research or Desk Research is as the name suggests is a research process wherein, we collect data through the readily available information. In this process we use various paid and unpaid databases which our team has access to and gather data through the same. This includes examining of listed companies’ annual reports, Journals, SEC filling etc. Apart from this our team has access to various associations across the globe across different industries. Lastly, we have exchange relationships with various university as well as individual libraries.

Secondary Research

Step 2: Primary Research

When we talk about primary research, it is a type of study in which the researchers collect relevant data samples directly, rather than relying on previously collected data.  This type of research is focused on gaining content specific facts that can be sued to solve specific problems. Since the collected data is fresh and first hand therefore it makes the study more accurate and genuine.

We at SNS Insider have divided Primary Research into 2 parts.

Part 1 wherein we interview the KOLs of major players as well as the upcoming ones across various geographic regions. This allows us to have their view over the market scenario and acts as an important tool to come closer to the accurate market numbers. As many as 45 paid and unpaid primary interviews are taken from both the demand and supply side of the industry to make sure we land at an accurate judgement and analysis of the market.

This step involves the triangulation of data wherein our team analyses the interview transcripts, online survey responses and observation of on filed participants. The below mentioned chart should give a better understanding of the part 1 of the primary interview.

Primary Research

Part 2: In this part of primary research the data collected via secondary research and the part 1 of the primary research is validated with the interviews from individual consultants and subject matter experts.

Consultants are those set of people who have at least 12 years of experience and expertise within the industry whereas Subject Matter Experts are those with at least 15 years of experience behind their back within the same space. The data with the help of two main processes i.e., FGDs (Focused Group Discussions) and IDs (Individual Discussions). This gives us a 3rd party nonbiased primary view of the market scenario making it a more dependable one while collation of the data pointers.

Step 3: Data Bank Validation

Once all the information is collected via primary and secondary sources, we run that information for data validation. At our intelligence centre our research heads track a lot of information related to the market which includes the quarterly reports, the daily stock prices, and other relevant information. Our data bank server gets updated every fortnight and that is how the information which we collected using our primary and secondary information is revalidated in real time.

Data Bank Validation

Step 4: QA/QC Process

After all the data collection and validation our team does a final level of quality check and quality assurance to get rid of any unwanted or undesired mistakes. This might include but not limited to getting rid of the any typos, duplication of numbers or missing of any important information. The people involved in this process include technical content writers, research heads and graphics people. Once this process is completed the title gets uploader on our platform for our clients to read it.

Step 5: Final QC/QA Process:

This is the last process and comes when the client has ordered the study. In this process a final QA/QC is done before the study is emailed to the client. Since we believe in giving our clients a good experience of our research studies, therefore, to make sure that we do not lack at our end in any way humanly possible we do a final round of quality check and then dispatch the study to the client.