Isosorbide Market Report Scope & Overview:
The Isosorbide Market size was valued at USD 686.13 million in 2024 and is expected to reach USD 1,008.42 million by 2032, growing at a CAGR of 4.94% over the forecast period of 2025-2032.
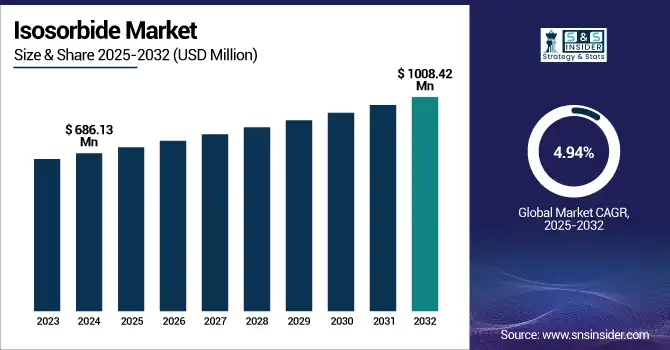
To Get more information on Isosorbide Market - Request Free Sample Report
The demand for isosorbide is growing rapidly as a result of the demand for environmentally friendly chemical intermediates and bio-based polymers, such as PEIT and DURABIO. Growing sustainability regulations are compelling industries to switch over from petro-based diols, influencing key isosorbide market trends. Prominent isosorbide manufacturers, including Roquette, Mitsubishi Chemical Group, Avantium, and SK Chemicals, are focusing on R&D and scale-up production facilities. There is an increasing market share for Isosorbide Mononitrate in pharmaceuticals through sustained release treatments. Roquette’s Lestrem plant features a 20,000 t/y isosorbide capacity, and the company’s POLYSORB solution received sustainability certification in January 2024.
Additionally, Shandong also secured FDA clearance for isosorbide mononitrate tablets in February 2024. These new developments and regulatory milestones are redefining the isosorbide market, driving isosorbide market growth as well as its use in sustainable materials and healthcare. The analysis of the isosorbide market underscores the role of isosorbide in facilitating environmentally sustainable progress in various industries.
Isosorbide Market Dynamics:
Drivers:
-
Government incentives for bio-based chemical production accelerate isosorbide adoption
National bioeconomy strategies and incentives are some of the factors boosting the isosorbide market. The EU Commission has committed over €10 billion in funding through 2027 as part of the bioeconomy strategy to grow green chemical production, and the US Department of Energy awarded $15 million in 2023 to streamline catalytic dehydration of sorbitol to isosorbide. Capital risks are mitigated with these funds, and public-private partnerships are fostered, waylaying the likes of Roquette and the Mitsubishi Chemical Group from expanding. This backing will play a crucial role in promoting the growth of the isosorbide market by establishing isosorbide as a top green chemical intermediate for industrial and pharmaceutical applications.
-
Growth in cardiovascular therapies amplifies isosorbide mononitrate demand
The increasing incidence of cardiovascular disease is still surging the demand for isosorbide mononitrate. The World Health Organization reports that in 2021, ischemic heart disease resulted in 17.9 million deaths worldwide. This health impact led to increased use of isosorbide mononitrate as an extended-release drug in angina therapy. Shandong Xinhua Pharmaceutical Co. Ltd. has entered the U.S. drug market through its isosorbide mononitrate tablet, for which the company obtained an FDA Orange Book listing in February 2024, showcasing an increasing regulatory acceptance. This capacity enables manufacturers to supply the U.S. market and reinforces the position of pharmaceutical-grade isosorbide. These applications also broaden the application range of isosorbide, and the global market is experiencing non-stop expansion in the field of world health.
Restraints:
-
Complex dehydration processes and high-corrosion equipment costs hinder scale-up
The production of isosorbide requires high temperature and acidic conditions for sorbitol dehydration, which requires a special reactor that resists corrosion and a special catalyst. For a 10,000 t/y plant, capital costs can be in excess of $50 MM, after accounting for the use of exotic alloys and stringent process controls, as reported by the American Chemical Society. Moreover, the operational expense is escalated, as repeated catalyst regeneration and maintenance are necessary. These technical barriers deter the newcomers, and even for the side isosorbide companies. The capital intensity of such plants prevents widespread use and creates a bottleneck to increasing the market size for isosorbide, amid increasing downstream demand in polymers and pharmaceuticals.
Isosorbide Market Segmentation Outlook:
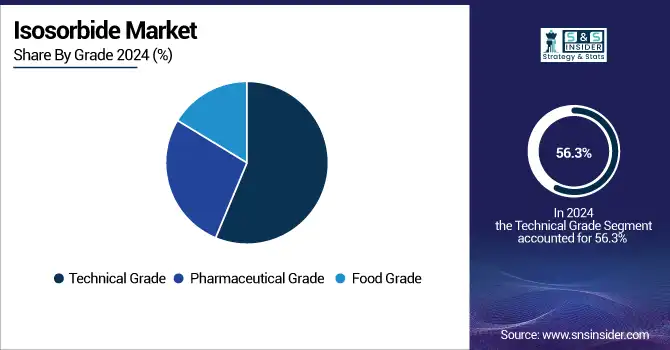
By Grade
Technical grade isosorbide dominated the market in 2024 with a 56.3% share. This was because of its widespread application in the bio-polyester production, particularly for packaging and automotive uses. In 2023, bio-polyester demand grew by 12%, the European Plastics Converters Association found. The Department of Energy provided $15 million in 2023 to develop better sorbitol dehydration as it applies to isosorbide manufacture. Roquette brought forward capacity at its Lestrem plant in France to ramp up production to meet this demand. All of these combined factors led to a more consolidated position of technical grade in the isosorbide market, with improved scalability, performance benefits, and environmental compliance driving its broad commercial uptake.
Pharmaceutical grade isosorbide was the fastest-growing segment in 2024, recording a CAGR of 5.45%. Its usage in cardiovascular medicines, such as isosorbide mononitrate, grew following the FDA’s approval of Shandong Xinhua Pharmaceutical’s generic version in 2024. The World Health Organization recorded 17.9 million global deaths from heart disease in 2021, fueling demand for treatments. Large bio-based isosorbide API companies such as Rochem International, Finekem Labs have industrialized the production using GMP-certified plants. These trends demonstrate the increased demand for pharmaceutical-grade isosorbide in CR tablets, and this is even more true in emerging markets, where better access to healthcare is helping to power the growth of this segment within the larger isosorbide market.
By Application
Polyethylene isosorbide terephthalate led the application segment in 2024 with a 31.7% market share. The superior thermal resistance and recyclability of PEIT, which are suited very well for hot-fill packaging, are why PEIT dominates. Demand for bio-polyester jumped 12% in 2023, according to the European Plastics Converters Association. SK Chemicals and Avantium have accelerated PEIT pilot production to accommodate the needs of the global packaging industry. Furthermore, EU regulations on packaging have encouraged the use of renewable materials. These multiple factors made PEIT the leading application in the isosorbide market, offering an eco-friendly alternative that fits with current environmental policies and corporate circular economy targets.
Polycarbonate was the fastest-growing application in 2024 with a CAGR of 5.44%. This was primarily attributable to the introduction of bio- and isosorbide-based polycarbonate DURABIO™ made by Mitsubishi Chemical Group. Honda used DURABIO™ in the windshields of its CRF1100L Africa Twin and X-ADV motorcycles, and Panasonic adopted the material in Technics earbuds in 2023. These clear, long-lived applications are valued as performance favorites. The U.S. Dept. of Energy further upped funding of isosorbide R&D. These developments show an increasing need for durable and transparent bio-based plastics in the market, making polycarbonate the fastest growing application segment in the isosorbide market.
By End-use
Resins and polymers dominated the end-use segment in 2024 with a 58.9% share. This dominance is attributed to the rise in the need for biopolymers in consumer goods, automotive, and construction. Demand for ‘Green Alternatives’. Regulating programs like the USDA BioPreferred Program and the EU Packaging Waste Directive have sparked interest in renewable chemicals. By September 2023, more than 7,800 biobased products carried USDA certification. Companies like Roquette and SK Chemicals all grew their eco-friendly polyester lines to meet the demand. This trend emphasizes the position of resins and polymers as pivotal to isosorbide, to re/embrace the green chemical intermediate status and frameworks of sustainability.
Additives recorded the fastest growth in 2024, with a CAGR of 5.66%. This was attributed to the use of isosorbide diesters in the role of eco‐friendly plasticizers and coating agents. In 2023, the U.S. Department of Energy granted $15M to improve high-purity isosorbide production, encouraging its utilization for specialty chemical synthesis. The American Chemistry Council said that adhesive and coatings production expanded 4 percent in early 2024. These figures indicate that businesses are leaving behind hazardous oil-based products. As the requirement for isosorbide-based non-toxic and biodegradable chemical additives increases, isosorbide-based additives are emerging as the key growth-catalysing sector in the growth of the isosorbide market.
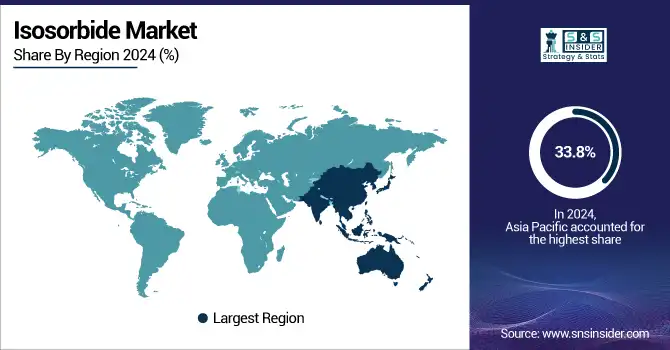
Isosorbide Market Regional Analysis:
Asia Pacific is the dominating region in the isosorbide market in 2024, holding a market share of 33.8%. The industrial growth of bio-based polymers in such countries as China, Japan, South Korea, etc., is commanding it. Roquette’s China activities and Mitsubishi Chemical’s creation of DURABIO™ bio-polycarbonate represent regional activity in green chemical intermediates. The Social innovator noted that there is steady growth in the bioplastics industry at over 12% annually, according to Japan’s Ministry of Economy, Trade and Industry. China is at the forefront of the region with its plastic ban regulations that are set in place by the Ministry of Ecology and the Environment, which are endorsing sustainable replacements. In such a context, Asia Pacific continues to lead the global isosorbide market share.
North America is the fastest-growing region in the isosorbide market in 2024, with the highest CAGR of 5.51%. The growth is supported by regulatory policies, the increase in green chemical applications, and demand for isosorbide mononitrate in pharmaceuticals. The value of the North American isosorbide market is predicted to exceed USD 150 million, and the U.S. leads with USD 80.74 million and a 53% share in 2024. The U.S. Department of Energy 2023 supports bio-isosorbide production with a $15 million investment through the Bioenergy Technologies Office. Additionally, Roquette has expanded its supply network in the U.S. to fulfill the increasing needs of the coatings and resins industry. With the strong pharmaceutical infrastructure, the United States dominates, whereas Canada, supported by Natural Resources Canada-based initiatives, is the fastest-growing country. Mexico is the third after investing in green industry-capacity development.
Europe is the second-dominant region in the isosorbide market in 2024, holding a market share of 24.7%. Its location is motivated by demanding environmental rules and high R&D investment in leading isosorbide suppliers Roquette and Novaphene. France dominates because of Roquette’s Lestrem site.” Roquette’s facility at Lestrem is the largest bio-refinery in Europe and produces technical and pharmaceutical Isosorbide. Germany itself makes a substantial contribution with its circular economy act and with measures in the EU REACH regulation. These policy-driven trends will continue to drive sustainable growth and shape Europe’s influence on the global isosorbide market analysis and application expansion by sector.
The isosorbide market in Latin America, and Middle East & and Africa appears as a growing market, driven by a growing demand for sustainable materials and the supportive policy landscape. Brazil is the leading country in Latin America, thanks to its investment in biopolymers derived from sugar cane and its strong doctrine on biodegradable resources. Argentina and Chile also have favorable environmental regulations. The largest expanded polymers production is in South Africa, and the highest growth is forecast in the UAE, stimulated by its 2031 circular-economy-facing vision. The industrialization efforts in Saudi Arabia also play a part, pushing up the isosorbide market expansion in these two regions.
Get Customized Report as per Your Business Requirement - Enquiry Now
Key Players in Isosorbide Market are:
The major competitors in the isosorbide market include Roquette Frères, Mitsubishi Chemical Group, Novaphene Specialities Pvt. Ltd., Jinan Hongbaifeng Industry & Trade Co., Ltd., TNJ Chemical, Rochem International, Inc., Finekem Labs, Curia, Polpharma, and Dipharma Francis.
Recent Developments:
-
December 2024: Honda adopted Mitsubishi Chemical’s DURABIO, a plant-based isosorbide plastic, for its X-ADV motorcycle body parts, enabling paintless bodywork and reducing emissions through sustainable, scratch-resistant materials.
-
February 2024: Zydus Lifesciences received USFDA approval to market isosorbide mononitrate extended-release tablets in the U.S., enabling a generic version of Imdur® with annual sales of $47 million.
| Report Attributes | Details |
|---|---|
| Market Size in 2024 | USD 686.13 million |
| Market Size by 2032 | USD 1,008.42 million |
| CAGR | CAGR of 4.94% From 2025 to 2032 |
| Base Year | 2024 |
| Forecast Period | 2025-2032 |
| Historical Data | 2021-2023 |
| Report Scope & Coverage | Market Size, Segments Analysis, Competitive Landscape, Regional Analysis, DROC & SWOT Analysis, Forecast Outlook |
| Key Segments | •By Grade (Technical Grade, Pharmaceutical Grade, Food Grade) •By Application (Polyethylene Isosorbide Terephthalate (PEIT), Polycarbonate, Polyurethane, Polyester Polyisosorbide Succinate (PIS), Isosorbide Diesters, Others) •By End-use (Resins & Polymers, Additives, Others) |
| Regional Analysis/Coverage | North America (US, Canada, Mexico), Europe (Germany, France, UK, Italy, Spain, Poland, Turkey, Rest of Europe), Asia Pacific (China, India, Japan, South Korea, Singapore, Australia, Rest of Asia Pacific), Middle East & Africa (UAE, Saudi Arabia, Qatar, South Africa, Rest of Middle East & Africa), Latin America (Brazil, Argentina, Rest of Latin America) |
| Company Profiles | Roquette Frères, Mitsubishi Chemical Group, Novaphene Specialities Pvt. Ltd., Jinan Hongbaifeng Industry & Trade Co., Ltd., TNJ Chemical, Rochem International, Inc., Finekem Labs, Curia, Polpharma, Dipharma Francis |
Get in Touch
