Get More Information on Polyethylene Wax Market - Request Free Sample Report
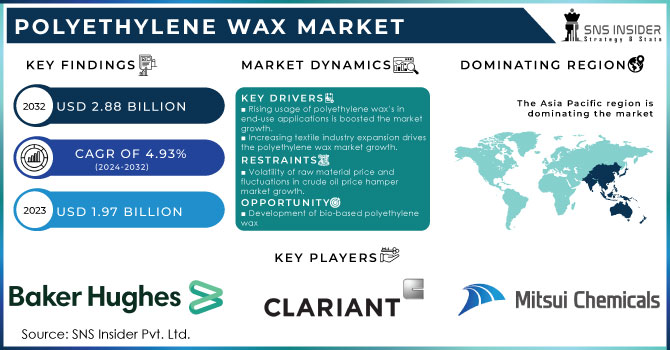
The Polyethylene Wax Market Size was valued at USD 1.97 billion in 2023 and is expected to reach USD 2.88 billion by 2032 and grow at a CAGR of 4.93% over the forecast period 2024-2032.
One of the main factors driving the market is the growing usage of polyethylene wax in various applications, including plastic processing, hot-melt adhesive, printing and industrial coating, and others. Throughout the projection period, the market is anticipated to grow as a result of rising shale gas production in North America and China as well as growing demand from the coatings and printing inks industries.
The increase of shale gas deposits is the main factor anticipated to propel the product categories in the United States. Chevron Phillips Chemical, INEOS, Williams Company, Dow Chemical, Formosa Plastics, Westlake Chemical, and LyondellBasell are among the regional industry participants that have expanded through programs to increase their end-use productions and customer base.
For instance, in August 2023 Chevron Phillips Chemical a U.S based company invested USD 6 billion for construction of a polymers complex in Qatar. It included two high-density polyethylene derivative units with a total capacity of 1680 KTA. This construction helped the company to increase its production capacity and increase its expansion in other countries.
The market is characterized by strict rules from numerous international authorities. In contrast to the developed regulatory frameworks of Europe and North America, developing regions such as the Asia Pacific region are currently improving their regulatory frameworks to guarantee appropriate safeguarding of the environment, public health, safety, and human rights.
Registration, Evaluation, Authorization, and Restriction of Chemicals (REACH), FDA (Food and Drug Administration) and EPA (Environment Protection Agency), have formulated stringent emission standards on harmful automobile emission. Therefore, this initiated is to increase the demand for polyethylene wax in various application market.
Market Dynamics
Drivers
Rising usage of polyethylene wax’s in end-use applications is boosted the market growth.
Due to advancements in polyethylene wax quality and a rise in the material's end-use applications, the polyethylene wax market is anticipated to grow during the forecast period. The growing need for printing inks as a product contributed to the expansion of the polyethylene wax market. The main factor expected to boost American product sectors is the expansion of shale gas reserves. Players in the regional market have started expansion initiatives to increase the size of their end-use productions and customer base.
Additionally, because of its premium qualities like UV resistance, wear, scratch resistance, corrosion resistance, and Mar, nanotechnology is anticipated to become a major market driver in the coating industry. Paints and coating products will use both metallic and micro-ceramic particles. Strict environmental regulations and technological advancements will fuel global demand for high-solid, UV-curable, aqueous coatings. Strict restrictions enforced by multiple international authorities define the market.
For instance, in December 2023, QGP Quimica Geral was acquired by Innospec Inc. QPG is a well-known manufacturer of specific chemicals in Brazil. The purpose of this action was to increase the company's clientele in South America.
Increasing textile industry expansion drives the polyethylene wax market growth.
Restraint
Volatility of raw material price and fluctuations in crude oil price hamper market growth.
The price and availability of raw materials have a major impact on the polyethylene wax industry. Changes in the cost of crude oil, a vital component used in the manufacturing of polyethylene wax, can have a big effect on how profitable businesses in this sector are.
Opportunities
Development of bio-based polyethylene wax
Increasing shale gas deposits in various regions
Market segmentation
By Product
Low-Density Polymerized PE Wax
High-Density Polymerized PE Wax
Micronized PE Wax
Oxidized PE Wax
Others
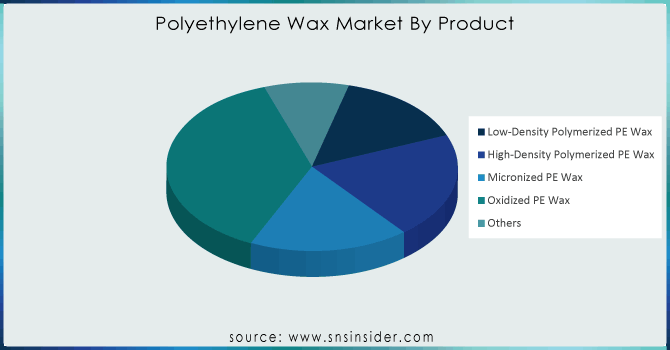
The oxidized PE wax dominated the polyethylene wax market with the highest revenue share of more than 38% in 2023 due to a rise in use in the masterbatches, rubber, plastics, inks, rubber, shoe, and leather sectors. The oxidized market in Asia Pacific is anticipated to expand significantly as a result of increased R&D and rapid industrialization.
PE wax has become widely accepted in the coatings business and is being used more and more in PVC processing, water-based wax emulsions, and nonionic emulsions in a variety of manufacturing sectors, including the paper coating, adhesives, textiles, packaging, and automotive industries.
The second-largest segment was High Density Polymerized PE Wax, which is expected to hold a sizable market share. The most often used PE wax is high density polymerized, which has a high density and tensile strength. Due to their significant market penetration and anticipated growth, they are utilized in a variety of application sectors.
Get Customized Report as Per Your Business Requirement - Request For Customized Report
By Technology
Polymerization
Thermal Cracking
Micronization
Modification
Others
The polymerization dominated the market with the highest revenue share of more than 48.54% in 2023. Manufacturers have recently turned to metallocene, a type of polymerization technology, as an upgraded and improved performance solution for HDP and LDP manufacturing. This is anticipated to support the PE wax market's rise in polymerization technology.
Modification technique is employed in the production of co-polymers, oxidized, acid-modified, and unique monomers. Over the course of the forecast period, it is anticipated that the technological share will rise due to the significant expansion in demand for acid-modified and oxidized products.
The expanding market for oxidized, specific monomer, acid modified, and co-polymer products has a commensurate impact on the demand for the modification segment. Over the course of the forecast period, the growth in the application sector of oxidized inks, adhesives, and masterbatches, as well as acid-modified coatings, is expected to drive the market volume.
By Application
Woods & Fire Logs
Packaging
Plastic Additives
Candles
Cosmetics
Printing Inks
Rubber
Others
The candle dominated the application segment with the highest revenue share of more than 30% in 2023. The second-largest application sector, packaging, is expected to account for a sizeable portion of the market. Among the qualities of PE wax that are highly valued in the packaging industry are heat seal ability and grease and scuff resistance. The growing use of wax packaging in coating, treating, impregnating, and laminating major food contact materials like paper, paperboards, and aluminium is anticipated to drive significant growth in the Indian market.
Regional Analysis
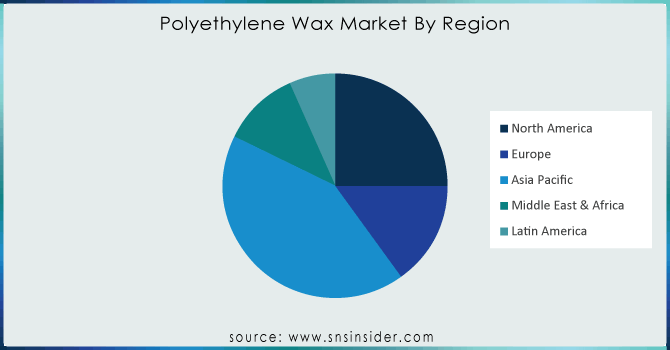
Asia Pacific led the polyethylene wax market with the highest revenue share of approx. 33.12% in 2023. This dominance is a result of the region's PE wax market expanding rapidly due to China and India's ample supply of polyethylene and fast industrialization. Asia Pacific's growth is also increased due to the China's well-established infrastructure for the manufacturing of polyethylene wax, along with the presence of important industry participants. The fast industrial boom that nations like Vietnam and India are experiencing will cause demand for PE wax to soar in the region. In the near future, these countries' expanding industries are anticipated to fuel demand for PE wax.
Due to the rising demand for hot melt adhesives across a range of industries, including the automotive and construction sectors, North America is anticipated to develop at a notable compound annual growth rate (CAGR) of roughly 4.5% over the projected period. Additionally, growing investments in end-use industries are expected to propel the polyethylene wax market. In nations like the United States, Canada, and Mexico, the consumption of magazines, catalogs, periodicals, and directories in end-use applications has been a major driver of market expansion. These nations have distinct structural characteristics and strong performance requirements, which have helped the industry grow remarkably.
REGIONAL COVERAGE:
North America
US
Canada
Mexico
Europe
Eastern Europe
Poland
Romania
Hungary
Turkey
Rest of Eastern Europe
Western Europe
Germany
France
UK
Italy
Spain
Netherlands
Switzerland
Austria
Rest of Western Europe
Asia Pacific
China
India
Japan
South Korea
Vietnam
Singapore
Australia
Rest of Asia Pacific
Middle East & Africa
Middle East
UAE
Egypt
Saudi Arabia
Qatar
Rest of the Middle East
Africa
Nigeria
South Africa
Rest of Africa
Latin America
Brazil
Argentina
Colombia
Rest of Latin America
Key Players
The major key players are Clariant, BASF SE, Baker Hughes, SCG Chemicals, Mitsui Chemicals, Honeywell International Inc., Trecora Chemical, Zellag, Marcus Oil & Chemicals Pvt. Ltd., Oxidized Polyethylene Innovations, and other key players are mentioned in the final report.
SCG Chemicals-Company Financial Analysis
Recent Development:
June 2023 BASF SE, has established its production plant in China. The new plant with a capacity of 500,000 metric tons PE annually. This new production plant helped the company to increase its production capacity and increase its revenue.
In March 2022, Sasol sod its Germany- based subsidiary which is dealing in development, production, and distribution of wax products. It has two production facilities.
Report Attributes | Details |
---|---|
Market Size in 2023 | US$ 1.97 billion |
Market Size by 2032 | US$ 2.88 Billion |
CAGR | CAGR of 4.93 % From 2024 to 2032 |
Base Year | 2023 |
Forecast Period | 2024-2032 |
Historical Data | 2020-2022 |
Report Scope & Coverage | Market Size, Segments Analysis, Competitive Landscape, Regional Analysis, DROC & SWOT Analysis, Forecast Outlook |
Key Segments | • By Product (Low-Density Polymerized PE Wax, High-Density Polymerized PE Wax, Micronized PE Wax, Oxidized PE Wax, And Others) • By Technology (Polymerization, Thermal Cracking, Micronization, Modification, And Others), • By Application (Woods & Fire Logs, Packaging, Plastic Additives, Lubricants, Candles, Cosmetics, Printing Inks, Rubber, And Others) |
Regional Analysis/Coverage | North America (US, Canada, Mexico), Europe (Eastern Europe [Poland, Romania, Hungary, Turkey, Rest of Eastern Europe] Western Europe] Germany, France, UK, Italy, Spain, Netherlands, Switzerland, Austria, Rest of Western Europe]), Asia Pacific (China, India, Japan, South Korea, Vietnam, Singapore, Australia, Rest of Asia Pacific), Middle East & Africa (Middle East [UAE, Egypt, Saudi Arabia, Qatar, Rest of Middle East], Africa [Nigeria, South Africa, Rest of Africa], Latin America (Brazil, Argentina, Colombia, Rest of Latin America) |
Company Profiles | Clariant, BASF SE, Baker Hughes, SCG Chemicals, Mitsui Chemicals, Honeywell International Inc., Trecora Chemical, Zellag, Marcus Oil & Chemicals Pvt. Ltd., Oxidized Polyethylene Innovations and other players |
Key Drivers | • Rising usage of polyethylene wax’s in end-use applications is boosted the market growth |
RESTRAINTS | • Volatility of raw material price and fluctuations in crude oil price |
Ans: The Polyethylene Wax Market was valued at USD 1.97 billion in 2023.
Ans: The expected CAGR of the global Polyethylene Wax Market during the forecast period is 4.93%.
Ans: The oxidized pe wax will grow rapidly in the Polyethylene Wax Market from 2024-2032.
Ans: Factors such as rising usage of polyethylene wax’s in end-use applications is boosted the market growth.
Ans: The China led the Polyethylene Wax Market in Asia Pacific region with highest revenue share in 2023.
TABLE OF CONTENTS
1. Introduction
1.1 Market Definition
1.2 Scope
1.3 Research Assumptions
2. Industry Flowchart
3. Research Methodology
4. Market Dynamics
4.1 Drivers
4.2 Restraints
4.3 Opportunities
4.4 Challenges
5. Porter’s 5 Forces Model
6. Pest Analysis
7. Polyethylene Wax Market Segmentation, By Product
7.1 Introduction
7.2 Low-Density Polymerized PE Wax
7.3 High-Density Polymerized PE Wax
7.4 Micronized PE Wax
7.5 Oxidized PE Wax
7.6 Others
8. Polyethylene Wax Market Segmentation, By Technology
8.1 Introduction
8.2 Polymerization
8.3 Thermal Cracking
8.4 Micronization
8.5 Modification
8.6 Others
9. Polyethylene Wax Market Segmentation, By Application
9.1 Introduction
9.2 Woods & Fire Logs
9.3 Packaging
9.4 Plastic Additives
9.5 Lubricants
9.6 Candles
9.7 Cosmetics
9.8 Printing Inks
9.9 Rubber
9.10 Others
10. Regional Analysis
10.1 Introduction
10.2 North America
10.2.1 Trend Analysis
10.2.2 North America Polyethylene Wax Market by Country
10.2.3 North America Polyethylene Wax Market By Product
10.2.4 North America Polyethylene Wax Market By Technology
10.2.5 North America Polyethylene Wax Market By Application
10.2.6 USA
10.2.6.1 USA Polyethylene Wax Market By Product
10.2.6.2 USA Polyethylene Wax Market By Technology
10.2.6.3 USA Polyethylene Wax Market By Application
10.2.7 Canada
10.2.7.1 Canada Polyethylene Wax Market By Product
10.2.7.2 Canada Polyethylene Wax Market By Technology
10.2.7.3 Canada Polyethylene Wax Market By Application
10.2.8 Mexico
10.2.8.1 Mexico Polyethylene Wax Market By Product
10.2.8.2 Mexico Polyethylene Wax Market By Technology
10.2.8.3 Mexico Polyethylene Wax Market By Application
10.3 Europe
10.3.1 Trend Analysis
10.3.2 Eastern Europe
10.3.2.1 Eastern Europe Polyethylene Wax Market by Country
10.3.2.2 Eastern Europe Polyethylene Wax Market By Product
10.3.2.3 Eastern Europe Polyethylene Wax Market By Technology
10.3.2.4 Eastern Europe Polyethylene Wax Market By Application
10.3.2.5 Poland
10.3.2.5.1 Poland Polyethylene Wax Market By Product
10.3.2.5.2 Poland Polyethylene Wax Market By Technology
10.3.2.5.3 Poland Polyethylene Wax Market By Application
10.3.2.6 Romania
10.3.2.6.1 Romania Polyethylene Wax Market By Product
10.3.2.6.2 Romania Polyethylene Wax Market By Technology
10.3.2.6.4 Romania Polyethylene Wax Market By Application
10.3.2.7 Hungary
10.3.2.7.1 Hungary Polyethylene Wax Market By Product
10.3.2.7.2 Hungary Polyethylene Wax Market By Technology
10.3.2.7.3 Hungary Polyethylene Wax Market By Application
10.3.2.8 Turkey
10.3.2.8.1 Turkey Polyethylene Wax Market By Product
10.3.2.8.2 Turkey Polyethylene Wax Market By Technology
10.3.2.8.3 Turkey Polyethylene Wax Market By Application
10.3.2.9 Rest of Eastern Europe
10.3.2.9.1 Rest of Eastern Europe Polyethylene Wax Market By Product
10.3.2.9.2 Rest of Eastern Europe Polyethylene Wax Market By Technology
10.3.2.9.3 Rest of Eastern Europe Polyethylene Wax Market By Application
10.3.3 Western Europe
10.3.3.1 Western Europe Polyethylene Wax Market by Country
10.3.3.2 Western Europe Polyethylene Wax Market By Product
10.3.3.3 Western Europe Polyethylene Wax Market By Technology
10.3.3.4 Western Europe Polyethylene Wax Market By Application
10.3.3.5 Germany
10.3.3.5.1 Germany Polyethylene Wax Market By Product
10.3.3.5.2 Germany Polyethylene Wax Market By Technology
10.3.3.5.3 Germany Polyethylene Wax Market By Application
10.3.3.6 France
10.3.3.6.1 France Polyethylene Wax Market By Product
10.3.3.6.2 France Polyethylene Wax Market By Technology
10.3.3.6.3 France Polyethylene Wax Market By Application
10.3.3.7 UK
10.3.3.7.1 UK Polyethylene Wax Market By Product
10.3.3.7.2 UK Polyethylene Wax Market By Technology
10.3.3.7.3 UK Polyethylene Wax Market By Application
10.3.3.8 Italy
10.3.3.8.1 Italy Polyethylene Wax Market By Product
10.3.3.8.2 Italy Polyethylene Wax Market By Technology
10.3.3.8.3 Italy Polyethylene Wax Market By Application
10.3.3.9 Spain
10.3.3.9.1 Spain Polyethylene Wax Market By Product
10.3.3.9.2 Spain Polyethylene Wax Market By Technology
10.3.3.9.3 Spain Polyethylene Wax Market By Application
10.3.3.10 Netherlands
10.3.3.10.1 Netherlands Polyethylene Wax Market By Product
10.3.3.10.2 Netherlands Polyethylene Wax Market By Technology
10.3.3.10.3 Netherlands Polyethylene Wax Market By Application
10.3.3.11 Switzerland
10.3.3.11.1 Switzerland Polyethylene Wax Market By Product
10.3.3.11.2 Switzerland Polyethylene Wax Market By Technology
10.3.3.11.3 Switzerland Polyethylene Wax Market By Application
10.3.3.12 Austria
10.3.3.12.1 Austria Polyethylene Wax Market By Product
10.3.3.12.2 Austria Polyethylene Wax Market By Technology
10.3.3.12.3 Austria Polyethylene Wax Market By Application
10.3.3.13 Rest of Western Europe
10.3.3.13.1 Rest of Western Europe Polyethylene Wax Market By Product
10.3.3.13.2 Rest of Western Europe Polyethylene Wax Market By Technology
10.3.3.13.3 Rest of Western Europe Polyethylene Wax Market By Application
10.4 Asia-Pacific
10.4.1 Trend Analysis
10.4.2 Asia-Pacific Polyethylene Wax Market by Country
10.4.3 Asia-Pacific Polyethylene Wax Market By Product
10.4.4 Asia-Pacific Polyethylene Wax Market By Technology
10.4.5 Asia-Pacific Polyethylene Wax Market By Application
10.4.6 China
10.4.6.1 China Polyethylene Wax Market By Product
10.4.6.2 China Polyethylene Wax Market By Technology
10.4.6.3 China Polyethylene Wax Market By Application
10.4.7 India
10.4.7.1 India Polyethylene Wax Market By Product
10.4.7.2 India Polyethylene Wax Market By Technology
10.4.7.3 India Polyethylene Wax Market By Application
10.4.8 Japan
10.4.8.1 Japan Polyethylene Wax Market By Product
10.4.8.2 Japan Polyethylene Wax Market By Technology
10.4.8.3 Japan Polyethylene Wax Market By Application
10.4.9 South Korea
10.4.9.1 South Korea Polyethylene Wax Market By Product
10.4.9.2 South Korea Polyethylene Wax Market By Technology
10.4.9.3 South Korea Polyethylene Wax Market By Application
10.4.10 Vietnam
10.4.10.1 Vietnam Polyethylene Wax Market By Product
10.4.10.2 Vietnam Polyethylene Wax Market By Technology
10.4.10.3 Vietnam Polyethylene Wax Market By Application
10.4.11 Singapore
10.4.11.1 Singapore Polyethylene Wax Market By Product
10.4.11.2 Singapore Polyethylene Wax Market By Technology
10.4.11.3 Singapore Polyethylene Wax Market By Application
10.4.12 Australia
10.4.12.1 Australia Polyethylene Wax Market By Product
10.4.12.2 Australia Polyethylene Wax Market By Technology
10.4.12.3 Australia Polyethylene Wax Market By Application
10.4.13 Rest of Asia-Pacific
10.4.13.1 Rest of Asia-Pacific Polyethylene Wax Market By Product
10.4.13.2 Rest of Asia-Pacific Polyethylene Wax Market By Technology
10.4.13.3 Rest of Asia-Pacific Polyethylene Wax Market By Application
10.5 Middle East & Africa
10.5.1 Trend Analysis
10.5.2 Middle East
10.5.2.1 Middle East Polyethylene Wax Market by Country
10.5.2.2 Middle East Polyethylene Wax Market By Product
10.5.2.3 Middle East Polyethylene Wax Market By Technology
10.5.2.4 Middle East Polyethylene Wax Market By Application
10.5.2.5 UAE
10.5.2.5.1 UAE Polyethylene Wax Market By Product
10.5.2.5.2 UAE Polyethylene Wax Market By Technology
10.5.2.5.3 UAE Polyethylene Wax Market By Application
10.5.2.6 Egypt
10.5.2.6.1 Egypt Polyethylene Wax Market By Product
10.5.2.6.2 Egypt Polyethylene Wax Market By Technology
10.5.2.6.3 Egypt Polyethylene Wax Market By Application
10.5.2.7 Saudi Arabia
10.5.2.7.1 Saudi Arabia Polyethylene Wax Market By Product
10.5.2.7.2 Saudi Arabia Polyethylene Wax Market By Technology
10.5.2.7.3 Saudi Arabia Polyethylene Wax Market By Application
10.5.2.8 Qatar
10.5.2.8.1 Qatar Polyethylene Wax Market By Product
10.5.2.8.2 Qatar Polyethylene Wax Market By Technology
10.5.2.8.3 Qatar Polyethylene Wax Market By Application
10.5.2.9 Rest of Middle East
10.5.2.9.1 Rest of Middle East Polyethylene Wax Market By Product
10.5.2.9.2 Rest of Middle East Polyethylene Wax Market By Technology
10.5.2.9.3 Rest of Middle East Polyethylene Wax Market By Application
10.5.3 Africa
10.5.3.1 Africa Polyethylene Wax Market by Country
10.5.3.2 Africa Polyethylene Wax Market By Product
10.5.3.3 Africa Polyethylene Wax Market By Technology
10.5.3.4 Africa Polyethylene Wax Market By Application
10.5.3.5 Nigeria
10.5.3.5.1 Nigeria Polyethylene Wax Market By Product
10.5.3.5.2 Nigeria Polyethylene Wax Market By Technology
10.5.3.5.3 Nigeria Polyethylene Wax Market By Application
10.5.3.6 South Africa
10.5.3.6.1 South Africa Polyethylene Wax Market By Product
10.5.3.6.2 South Africa Polyethylene Wax Market By Technology
10.5.3.6.3 South Africa Polyethylene Wax Market By Application
10.5.3.7 Rest of Africa
10.5.3.7.1 Rest of Africa Polyethylene Wax Market By Product
10.5.3.7.2 Rest of Africa Polyethylene Wax Market By Technology
10.5.3.7.3 Rest of Africa Polyethylene Wax Market By Application
10.6 Latin America
10.6.1 Trend Analysis
10.6.2 Latin America Polyethylene Wax Market by country
10.6.3 Latin America Polyethylene Wax Market By Product
10.6.4 Latin America Polyethylene Wax Market By Technology
10.6.5 Latin America Polyethylene Wax Market By Application
10.6.6 Brazil
10.6.6.1 Brazil Polyethylene Wax Market By Product
10.6.6.2 Brazil Polyethylene Wax Market By Technology
10.6.6.3 Brazil Polyethylene Wax Market By Application
10.6.7 Argentina
10.6.7.1 Argentina Polyethylene Wax Market By Product
10.6.7.2 Argentina Polyethylene Wax Market By Technology
10.6.7.3 Argentina Polyethylene Wax Market By Application
10.6.8 Colombia
10.6.8.1 Colombia Polyethylene Wax Market By Product
10.6.8.2 Colombia Polyethylene Wax Market By Technology
10.6.8.3 Colombia Polyethylene Wax Market By Application
10.6.9 Rest of Latin America
10.6.9.1 Rest of Latin America Polyethylene Wax Market By Product
10.6.9.2 Rest of Latin America Polyethylene Wax Market By Technology
10.6.9.3 Rest of Latin America Polyethylene Wax Market By Application
11. Company Profiles
11.1 Clariant
11.1.1 Company Overview
11.1.2 Financial
11.1.3 Products/ Services Offered
11.1.4 The SNS View
11.2 BASF SE
11.2.1 Company Overview
11.2.2 Financial
11.2.3 Products/ Services Offered
11.2.4 The SNS View
11.3 Baker Hughes
11.3.1 Company Overview
11.3.2 Financial
11.3.3 Products/ Services Offered
11.3.4 The SNS View
11.4 SCG Chemicals
11.4.1 Company Overview
11.4.2 Financial
11.4.3 Products/ Services Offered
11.4.4 The SNS View
11.5 Mitsui Chemicals
11.5.1 Company Overview
11.5.2 Financial
11.5.3 Products/ Services Offered
11.5.4 The SNS View
11.6 Honeywell International Inc
11.6.1 Company Overview
11.6.2 Financial
11.6.3 Products/ Services Offered
11.6.4 The SNS View
11.7 Trecora Chemical
11.7.1 Company Overview
11.7.2 Financial
11.7.3 Products/ Services Offered
11.7.4 The SNS View
11.8 Zellag
11.8.1 Company Overview
11.8.2 Financial
11.8.3 Products/ Services Offered
11.8.4 The SNS View
11.9 Marcus Oil & Chemicals Pvt. Ltd.
11.9.1 Company Overview
11.9.2 Financial
11.9.3 Products/ Services Offered
11.9.4 The SNS View
11.10 Oxidized Polyethylene Innovations
11.10.1 Company Overview
11.10.2 Financial
11.10.3 Products/ Services Offered
11.10.4 The SNS View
12. Competitive Landscape
12.1 Competitive Benchmarking
12.2 Market Share Analysis
12.3 Recent Developments
12.3.1 Industry News
12.3.2 Company News
12.3.3 Mergers & Acquisitions
13. Use Case and Best Practices
14. Conclusion
An accurate research report requires proper strategizing as well as implementation. There are multiple factors involved in the completion of good and accurate research report and selecting the best methodology to compete the research is the toughest part. Since the research reports we provide play a crucial role in any company’s decision-making process, therefore we at SNS Insider always believe that we should choose the best method which gives us results closer to reality. This allows us to reach at a stage wherein we can provide our clients best and accurate investment to output ratio.
Each report that we prepare takes a timeframe of 350-400 business hours for production. Starting from the selection of titles through a couple of in-depth brain storming session to the final QC process before uploading our titles on our website we dedicate around 350 working hours. The titles are selected based on their current market cap and the foreseen CAGR and growth.
The 5 steps process:
Step 1: Secondary Research:
Secondary Research or Desk Research is as the name suggests is a research process wherein, we collect data through the readily available information. In this process we use various paid and unpaid databases which our team has access to and gather data through the same. This includes examining of listed companies’ annual reports, Journals, SEC filling etc. Apart from this our team has access to various associations across the globe across different industries. Lastly, we have exchange relationships with various university as well as individual libraries.
Step 2: Primary Research
When we talk about primary research, it is a type of study in which the researchers collect relevant data samples directly, rather than relying on previously collected data. This type of research is focused on gaining content specific facts that can be sued to solve specific problems. Since the collected data is fresh and first hand therefore it makes the study more accurate and genuine.
We at SNS Insider have divided Primary Research into 2 parts.
Part 1 wherein we interview the KOLs of major players as well as the upcoming ones across various geographic regions. This allows us to have their view over the market scenario and acts as an important tool to come closer to the accurate market numbers. As many as 45 paid and unpaid primary interviews are taken from both the demand and supply side of the industry to make sure we land at an accurate judgement and analysis of the market.
This step involves the triangulation of data wherein our team analyses the interview transcripts, online survey responses and observation of on filed participants. The below mentioned chart should give a better understanding of the part 1 of the primary interview.
Part 2: In this part of primary research the data collected via secondary research and the part 1 of the primary research is validated with the interviews from individual consultants and subject matter experts.
Consultants are those set of people who have at least 12 years of experience and expertise within the industry whereas Subject Matter Experts are those with at least 15 years of experience behind their back within the same space. The data with the help of two main processes i.e., FGDs (Focused Group Discussions) and IDs (Individual Discussions). This gives us a 3rd party nonbiased primary view of the market scenario making it a more dependable one while collation of the data pointers.
Step 3: Data Bank Validation
Once all the information is collected via primary and secondary sources, we run that information for data validation. At our intelligence centre our research heads track a lot of information related to the market which includes the quarterly reports, the daily stock prices, and other relevant information. Our data bank server gets updated every fortnight and that is how the information which we collected using our primary and secondary information is revalidated in real time.
Step 4: QA/QC Process
After all the data collection and validation our team does a final level of quality check and quality assurance to get rid of any unwanted or undesired mistakes. This might include but not limited to getting rid of the any typos, duplication of numbers or missing of any important information. The people involved in this process include technical content writers, research heads and graphics people. Once this process is completed the title gets uploader on our platform for our clients to read it.
Step 5: Final QC/QA Process:
This is the last process and comes when the client has ordered the study. In this process a final QA/QC is done before the study is emailed to the client. Since we believe in giving our clients a good experience of our research studies, therefore, to make sure that we do not lack at our end in any way humanly possible we do a final round of quality check and then dispatch the study to the client.
The Allulose Market Size was valued at USD 250.53 million in 2023 and is expected to reach USD 522.06 million by 2032 and grow at a CAGR of 8.5% over the forecast period 2024-2032.
The Biocomposites Market was valued at USD 32.59 billion in 2023 and is supposed to reach USD 122.22 billion by 2032. It is expected to grow at a CAGR of 15.8% over the forecast period 2024-2032.
The Mercaptan Market was valued at USD 1.88 billion in 2023 and is about to touch USD 3.00 billion by 2032 with a CAGR of 5.40% over the period 2024-2032.
The Antimicrobial Additives Market Size was valued at USD 3.24 billion in 2023 and is expected to reach USD 6.86 billion by 2032 and grow at a CAGR of 9.20% over the forecast period 2024-2032.
The Green Steel Market Size was valued at USD 2.6 billion in 2023, and is expected to reach USD 2216.5 billion by 2032, and grow at a CAGR of 111.5% over the forecast period 2024-2032.
The Polyurethanes Market Size was valued at USD 59.76 billion in 2022 and is expected to reach USD 90.34 billion by 2030 and grow at a CAGR of 5.3 % over the forecast period 2023-2030.
Hi! Click one of our member below to chat on Phone