Rubber Process Oil Market Report Scope & Overview:
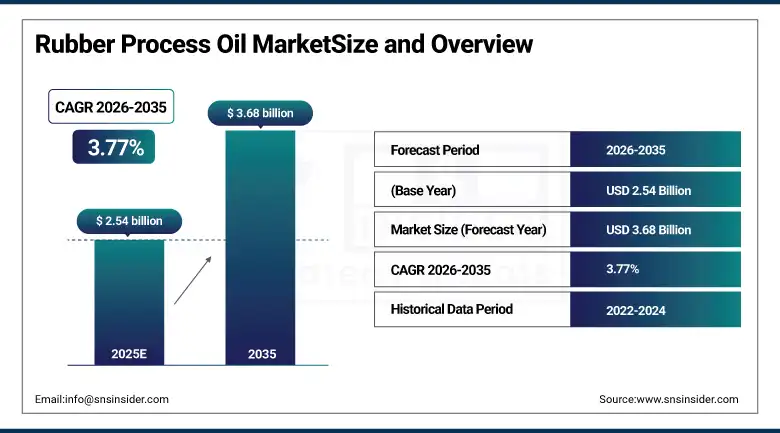
Rubber Process Oil Market was valued at USD 2.54 billion in 2025 and is expected to reach USD 3.68 billion by 2035, growing at a CAGR of 3.77% from 2026–2035.
The rubber process oil (RPO) industry is witnessing a defining change characterized by the fusion of ongoing global growth in tyre manufacturing production, growing industrial rubber consumption across the infrastructure and construction industries, and an industry structural change towards polycyclic aromatic hydrocarbon reduction and use of renewable materials that are reshaping the product development strategies of all leading companies in the market. Rubber process oils play a vital role as essential processing agents in the manufacture of rubber goods, acting as plasticizing agents that allow better dispersion of fillers, lowering viscosity during compound mixing, improving the processability of natural and synthetic rubber compounds, and extending rubber polymer chains to reduce material use while achieving targeted physical properties. In the global tyre manufacturing industry, where over half of all rubber process oils are consumed each year, underlying demand growth is being fueled by the synergies between the recovery in passenger vehicle production from key automotive countries, the increasing use of electric vehicles which require specialized low rolling resistance tyres, and the volume of replacements tyres being manufactured annually to meet demand.
The growth in the global rubber process oil market at a CAGR of 3.77% during 2026 to 2035 can be attributed to a healthy balance between volume growth in tyre and industrial rubber manufacturing globally and the increase in value through the adoption of high-performance low-PAH, naphthenic, and biobased rubber process oils due to increasingly stringent environmental policies and sustainability initiatives by companies globally. This is evident from the commissioning of a separate low-PAH aromatic oil stream at the TotalEnergies facility at Antwerp in February 2024 and an increase in capacity of 20% by ExxonMobil in its Baytown paraffinic/RPO unit in March 2023.
Market Size and Forecast
-
Market Size in 2025: USD 2.54 Billion
-
Market Size by 2035: USD 3.68 Billion
-
CAGR: 3.77% from 2026 to 2035
-
Base Year: 2025
-
Forecast Period: 2026–2035
-
Historical Data: 2022–2024
To Get more information On Rubber Process Oil Market - Request Free Sample Report
Rubber Process Oil Market Trends
-
Accelerating transition from high-PAH aromatic process oils to low-PAH aromatic, naphthenic, and paraffinic alternatives across European and North American tyre and rubber compound manufacturing operations, driven by REACH restriction enforcement, NESHAP amendments, and major tyre brand sustainability commitments requiring compliant process oil inputs across their global supply chains.
-
Growing adoption of bio-based and renewable-feedstock rubber process oils derived from vegetable oils, waste cooking oils, and biorefinery streams as tyre manufacturers and rubber goods producers seek to reduce fossil fuel dependency in their manufacturing processes while meeting corporate net-zero emissions commitments and circular economy standards.
-
Rising demand for specialty naphthenic rubber process oils in high-performance synthetic rubber applications including EPDM seals and gaskets, NBR oil-resistant components, and SBR compounds for premium tyre sidewall formulations, where naphthenic oils deliver superior solvency, thermal stability, and compatibility with polar polymer systems.
-
Expanding rubber process oil consumption in non-tyre growth applications including construction sealants and weatherstripping driven by global infrastructure investment, wire and cable insulation compounds for power grid expansion, high-performance flooring adhesives for commercial real estate development, and vibration-damping rubber components for electric vehicle battery mounting systems.
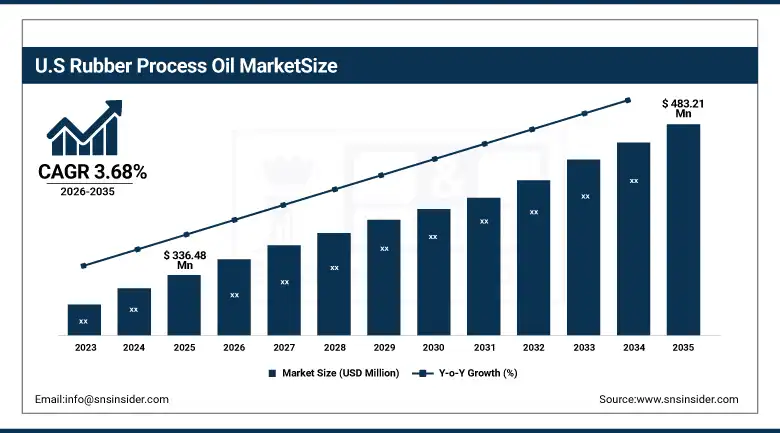
U.S. Rubber Process Oil Market was valued at approximately USD 336.48 million in 2025 and is expected to reach USD 483.21 million by 2035, growing at a CAGR of approximately 3.68%, driven by rising vehicle production, replacement tyre demand, and regulatory-driven transition to sustainable low-PAH and bio-based rubber process oil formulations.
The US holds the biggest national market of RPOs in the West, driven by the presence of the biggest passenger vehicle fleet worldwide, high per capita tyre replacement rate and solid base of rubber manufacturers for industries such as aerospace, oil & gas, building & construction, and agriculture. Evidence is given by the US Tire Manufacturer's Association reports of shipment of 334.8 million tires in 2023, out of which 222 million replacement passenger tires, indicating the huge and consistent volume of RPO consumption in the country's tyre segment, giving the demand side of the market a robust backing. The US RPO market is now being molded to the increasing pressure of amendments to NESHAP from EPA for reducing hazardous air pollution from the process, and the coming into effect of the TSCA Chemical Data Reporting regulations from 2024, requiring 20+ RPO manufacturers to submit their product volumes and formulations to provide the much-needed transparency for driving adoption of PAH-reduced and bio-based RPOs.
Rubber Process Oil Market Segment Insights
-
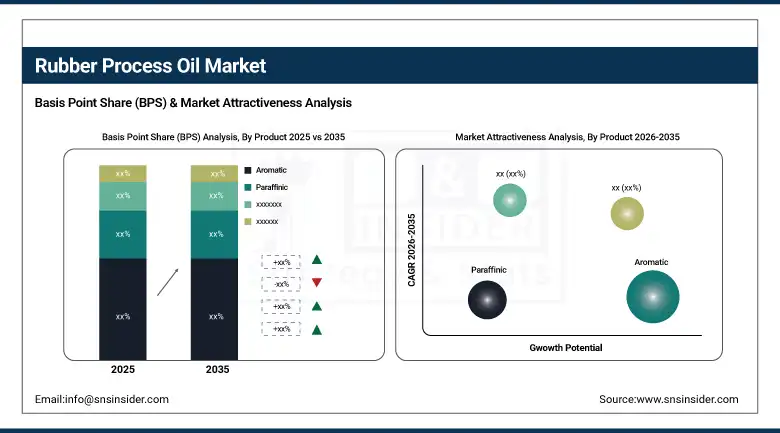
By Product, Aromatic dominated with approximately 50.3% revenue share in 2025; Paraffinic is expected to be the fastest-growing product segment through 2026 to 2035, driven by regulatory migration from high-PAH aromatics and growing synthetic rubber application demand.
-
By Application, Tyre held the highest revenue share of approximately 52.3% in 2025; Flooring Materials is expected to grow at the fastest CAGR of approximately 5.44% from 2026 to 2035, driven by demand for flexible, durable rubber flooring solutions in commercial construction and infrastructure.
Rubber Process Oil Market Segment Analysis
By Product, Aromatic dominates, Paraffinic expected to grow fastest
Aromatic rubber process oils held the position of market leaders in terms of generating the highest revenues of around 50.3% of total market revenue due to the long-lasting technical edge they hold over competing technologies in providing plasticity benefits for natural rubber and styrene-butadiene rubber-based compounds, whereby their higher aromatic carbon content provides improved compatibility, optimal fillers activation and enhanced solvency power for both natural and emulsion polymers commonly employed in high-volume tyre manufacture and industrial rubber applications. This segment continues to lead the way in spite of growing regulatory pressures due to its utilization of processed aromatic distillate extract oils and milder solvate grades that meet the EU REACH limit of 50 mg/kg PAHs and the IP346 specification, which allows tyres manufacturers in APAC and Latin America, whose regulatory enforcement is not as rigorous, to keep using conventional aromatic oils whereas western markets continue to transition into more regulated alternatives. Sinopec Lubricant Co., Ltd. and Indian Oil Corporation as well as other local aromatic oil producers from Southeast Asian regions continue to contribute to the leading market position of the segment with their affordable supply to China, India, and ASEAN tyre plants.
Paraffinic rubber process oils are expected to grow at the fastest CAGR through 2026 to 2035, driven by their growing preference in synthetic rubber applications including EPDM, butyl rubber, and silicone rubber compounding where their high paraffinic carbon content and low aromatic contamination deliver the thermal and oxidative stability, low volatility, and regulatory compliance required for automotive seals, pharmaceutical stoppers, food-contact rubber goods, and wire and cable insulation applications. The EV revolution is creating significant incremental demand for paraffinic process oils in battery sealing systems, high-voltage cable insulation compounds, and vibration-damping rubber mounts that require the clean, low-migration characteristics that paraffinic oils provide in demanding electrical and thermal management applications.
By Application, Tyre dominates, Flooring Materials grows fastest
The Tyre application segment retained its commanding position in the global Rubber Process Oil Market in 2025 with approximately 52.3% of total revenues, anchored by the irreplaceable role of rubber process oils in every major tyre compound formulation from tread and sidewall compounds through bead filler, apex, and inner liner applications that collectively require substantial process oil addition to achieve the target processing viscosity, hardness, and mechanical performance specifications of modern radial tyre construction. Global tyre production is sustained by multiple simultaneous demand drivers including recovering passenger vehicle production in China, India, and Southeast Asia post-pandemic, the accelerating replacement tyre market as expanding global vehicle fleets generate growing replacement cycles, and the structural shift toward larger-diameter, higher-performance tyre sizes in SUV and light truck segments that typically require higher process oil dosage levels per unit mass than standard passenger car tyre formulations. The EV market's rapid expansion is introducing new tyre engineering requirements including enhanced load-bearing capability for battery weight, reduced rolling resistance for range optimization, and regenerative braking torque capability that are driving investment in novel tyre compound formulations requiring carefully specified process oil grades.
Flooring Materials is expected to grow at the fastest CAGR of approximately 5.44% during 2026 to 2035, driven by accelerating commercial real estate construction, renovation, and refurbishment activity globally that is generating growing demand for rubber-based flooring solutions including gym flooring, playground safety surfaces, industrial anti-fatigue mats, and acoustic underlayment applications. Rubber flooring compounds require paraffinic and naphthenic process oils as plasticizers that confer the flexibility, impact absorption, and dimensional stability required for long-service flooring applications in high-traffic commercial, healthcare, and industrial environments. The growing preference for recyclable rubber flooring manufactured from reclaimed tyre rubber in LEED-certified green building projects is expanding the flooring application segment's market while simultaneously creating demand for bio-compatible process oil grades compatible with recycled rubber compounding.
Market Regional Analysis
|
Region |
Major Country |
Share within Region (%) |
|---|---|---|
|
North America |
United States |
~71% |
|
Europe |
Germany |
~31% |
|
Asia Pacific |
China |
~55% |
|
Middle East & Africa |
UAE |
~28% |
|
Latin America |
Brazil |
~43% |
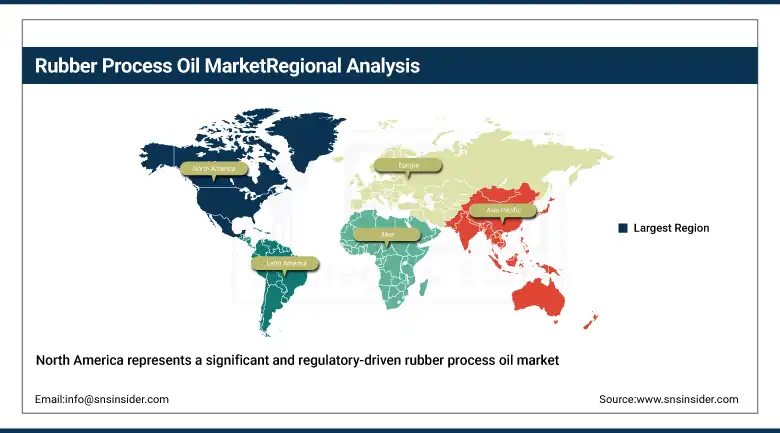
North America Rubber Process Oil Market Insights
North America represents a significant and regulatory-driven rubber process oil market where the combination of the world's largest vehicle replacement tyre market, EPA regulatory modernization, and growing sustainable formulation demand from major tyre brands is simultaneously sustaining volume growth and driving product premiumization toward specialty paraffinic, low-PAH, and renewable-feedstock grades. The United States dominates North American RPO demand with approximately 71% regional market share, anchored by its extraordinary tyre replacement market volume and substantial industrial rubber goods manufacturing base for aerospace, oil and gas, agriculture, and construction equipment applications requiring high-performance rubber components. Canada and Mexico contribute meaningful regional volume through their automotive assembly sector rubber component supply chains and growing industrial infrastructure development requiring rubber process oils in construction sealants, pipe insulation, and electrical cable applications.
Get Customized Report as per Your Business Requirement - Enquiry Now
Europe Rubber Process Oil Market Insights
Europe is the second-largest regional rubber process oil market and represents the fastest-growing region in terms of value-accretive product mix transition, as the EU's REACH chemical regulation and the European Chemicals Agency's progressive restriction of high-PAH aromatic oils are driving a comprehensive reformulation of European tyre and industrial rubber compound formulations toward low-PAH aromatic, naphthenic, and bio-based process oil alternatives. Germany leads European RPO demand through its dominant position in premium automotive tyre manufacturing, with Continental AG's and the operations of Michelin, Bridgestone, and Pirelli in Germany collectively requiring large volumes of compliant, performance-grade RPO for their European production facilities. The German Federal Environment Agency's advocacy for low-PAH and renewable RPO alternatives is creating regulatory alignment between German national standards and EU-wide REACH requirements that positions Germany as the technology development hub for the European market's sustainability transition.
Asia Pacific Rubber Process Oil Market Insights
Asia Pacific dominated the global Rubber Process Oil Market in 2025 with approximately 46.7% of total revenues, driven by the region's commanding position as the world's largest tyre manufacturing hub, its extensive industrial rubber goods production base, and the concentrated presence of both RPO producers and consumers across China, India, Thailand, Japan, and Indonesia. China's automotive production surpassing 30 million units in 2023 as confirmed by the China Association of Automobile Manufacturers, combined with the country's extraordinary concentration of tyre manufacturing capacity supplying both domestic and global markets, generates the world's highest single-country RPO consumption volume that underpins the entire Asia Pacific segment's dominant market position. India's rapidly expanding automotive production, representing the world's third-largest vehicle market by volume, combined with its major tyre manufacturing base anchored by MRF, Apollo Tyres, and Ceat alongside global joint ventures with Michelin, Bridgestone, and Yokohama, is creating growing RPO demand that is sustaining the region's share expansion.
Middle East & Africa and Latin America Rubber Process Oil Market Insights
MEA and Latin America represent developing rubber process oil markets where growing automotive production, infrastructure development, and industrialization are creating expanding RPO demand against a backdrop of improving regulatory frameworks and growing sustainability awareness. Saudi Arabia leads MEA RPO consumption through its substantial petrochemical manufacturing capacity, growing domestic automotive assembly sector, and the operations of international tyre manufacturers who have established Gulf region production facilities to serve the expanding Middle Eastern and African vehicle markets. ORGI Chemie FZC represents the region's established RPO supply infrastructure, serving tyre and rubber manufacturers across the Gulf Cooperation Council with both aromatic and naphthenic process oil grades. Brazil dominates Latin American RPO demand through its position as the region's largest automotive market, with domestic tyre manufacturers Pirelli Brasil and Bridgestone do Brasil requiring substantial RPO volumes for both domestic consumption and export production.
Rubber Process Oil Market Growth Drivers:
Expanding global tyre manufacturing capacity and rising vehicle fleet replacement demand creating sustained structural RPO volume growth: The primary structural growth driver for the Rubber Process Oil Market is the sustained expansion of global tyre manufacturing capacity driven by the simultaneous growth of vehicle production in emerging markets, the consistent volume of the replacement tyre market that generates recurring RPO demand independent of new vehicle production cycles, and the progressive shift toward larger-diameter and higher-performance tyre formats in growing SUV, light truck, and electric vehicle segments that require higher RPO loading per tyre compound unit. The U.S. Tire Manufacturers Association's 334.8 million tire shipment figure for 2023, representing one of the highest annual volumes in U.S. market history, combined with the International Rubber Study Group's 3.1% global rubber consumption increase, provides the quantitative evidence base confirming that underlying RPO demand fundamentals are tracking positively across all major geographic markets.
Rubber Process Oil Market Restraints
Progressive tightening of PAH content regulations and rising bio-based raw material costs creating formulation transition cost pressures for producers and consumers: A significant restraint on the Rubber Process Oil Market is the substantial technical and commercial challenge associated with the industry-wide transition from traditional high-PAH aromatic process oils to compliant low-PAH, naphthenic, and bio-based alternatives, which requires tyre manufacturers and rubber goods producers to undertake extensive compound reformulation programs, re-validate product performance specifications, and manage the higher purchase costs of specialty compliant grades relative to conventional aromatic oils. The PAH content restrictions enforced under EU REACH regulations and progressively adopted in other major markets require aromatic RPO grades to contain less than 50 mg/kg of the eight regulated polycyclic aromatic hydrocarbon compounds as measured by IP346 methodology, imposing refinery processing complexity and cost that is passed through the value chain to rubber manufacturers and ultimately to tyre end-users.
Rubber Process Oil Market Opportunities
Bio-based and renewable RPO commercialization, EV tyre specialty formulations, and circular economy reclaimed rubber process oil applications: The most significant near-term commercial opportunity in the rubber process oil market is the development and scaling of commercially viable bio-based and renewable-feedstock RPO products that deliver equivalent technical performance to petroleum-derived alternatives while meeting the stringent PAH content, viscosity, and polymer compatibility specifications required for tyre-grade rubber compound applications. Nynas AB's February 2024 launch of a renewable-feedstock rubber process oil represents the first commercial-scale proof point that bio-based RPO is achievable at industrial quality standards, and the establishment of a credible supply chain for bio-derived RPO feedstocks from waste cooking oil, tall oil, and biorefinery streams will be essential to scaling this segment from niche to mainstream over the forecast period. The rapidly growing circular rubber economy, centered on the processing and reuse of end-of-life tyre rubber in new rubber products, playground surfaces, sports flooring, and acoustic applications, is creating a new process oil application in reclaimed rubber compounding where specialty naphthenic and paraffinic oils are required to restore the plasticity and processability of devulcanized or cryogenically ground reclaimed rubber granulate, representing an incremental market opportunity growing in direct proportion to the circular economy's expansion in the rubber value chain.
Recent Developments:
-
2026: Shell plc expanded its sustainable specialty oils portfolio for tire and industrial rubber applications by increasing investments in low-PAH and bio-based rubber process oil production capabilities across Europe and Asia, supporting rising demand for environmentally compliant rubber compounds.
-
2025: H&R Group introduced advanced TDAE and MES-based rubber process oils designed for high-performance tire manufacturing applications, focusing on REACH compliance, reduced emissions, and improved compatibility with EV tire compounds.
Rubber Process Oil Market Key Players
-
Nynas AB
-
Ergon, Inc.
-
H&R Group (Hansen & Rosenthal)
-
Apar Industries Ltd.
-
Panama Petrochem Ltd.
-
Raj Petro Specialities Pvt. Ltd. (A Brenntag Group Company)
-
Behran Oil Company
-
Sinopec Lubricant Company
-
ORGI Chemie FZC
-
Savita Oil Technologies Ltd.
-
ExxonMobil Corporation
-
TotalEnergies SE
-
Shell plc
-
Chevron Phillips Chemical Company
-
Indian Oil Corporation Ltd.
-
Cross Oil Refining & Marketing, Inc.
-
HF Sinclair Corporation (HollyFrontier)
-
Repsol S.A.
-
Petro Rubiales
-
CEPSA (Compañía Española de Petróleos)
Rubber Process Oil Market Report Scope:
| Report Attributes | Details |
|---|---|
| Market Size in 2025 | USD 2.54 Billion |
| Market Size by 2035 | USD 3.68 Billion |
| CAGR | CAGR of 3.77% From 2026 to 2035 |
| Base Year | 2025 |
| Forecast Period | 2026-2035 |
| Historical Data | 2022-2024 |
| Report Scope & Coverage | Market Size, Segments Analysis, Competitive Landscape, Regional Analysis, DROC & SWOT Analysis, Forecast Outlook |
| Key Segments | •By Product (Aromatic, Paraffinic, Naphthenic, Others) •By Application (Tyre, Footwear, Wire & Cable Covering, Flooring Materials, Paints & Coatings, Adhesive & Sealants, and Others) |
| Regional Analysis/Coverage | North America (US, Canada), Europe (Germany, UK, France, Italy, Spain, Russia, Poland, Rest of Europe), Asia Pacific (China, India, Japan, South Korea, Australia, ASEAN Countries, Rest of Asia Pacific), Middle East & Africa (UAE, Saudi Arabia, Qatar, South Africa, Rest of Middle East & Africa), Latin America (Brazil, Argentina, Mexico, Colombia, Rest of Latin America). |
| Company Profiles | Nynas AB, Ergon, Inc., H&R Group (Hansen & Rosenthal), Apar Industries Ltd., Panama Petrochem Ltd., Raj Petro Specialities Pvt. Ltd. (A Brenntag Group Company), Behran Oil Company, Sinopec Lubricant Company, ORGI Chemie FZC, Savita Oil Technologies Ltd., ExxonMobil Corporation, TotalEnergies SE, Shell plc, Chevron Phillips Chemical Company, Indian Oil Corporation Ltd., Cross Oil Refining & Marketing, Inc., HF Sinclair Corporation (HollyFrontier), Repsol S.A., Petro Rubiales, and CEPSA (Compañía Española de Petróleos) |
Frequently Asked Questions
Ans: Asia Pacific dominated the Rubber Process Oil Market in 2025 with approximately 46.7% of global revenues, led by China's automotive production scale exceeding 30 million vehicles annually and its commanding position in global tyre manufacturing capacity, alongside India's rapidly expanding tyre production and industrial rubber goods manufacturing base serving both domestic and export markets.
Ans: Aromatic rubber process oils dominated the market in 2025 with approximately 50.3% of revenues, driven by their excellent compatibility with natural and styrene-butadiene rubber matrices, superior filler dispersion, and cost efficiency that makes them the preferred processing aid for high-volume tyre compound manufacturing in Asia Pacific and Latin America.
Ans: The Rubber Process Oil Market was valued at USD 2.54 billion in 2025.
Ans: The Tyre application segment dominated the market in 2025 with approximately 52.3% of revenues, anchored by the extraordinary volume and consistency of global tyre manufacturing demand across passenger vehicle OEM and replacement, commercial vehicle, and specialty tyre segments that collectively consume the majority of all rubber process oils produced globally each year.
Ans: The Rubber Process Oil Market is expected to grow at a CAGR of 3.77% from 2026 to 2035.
Get in Touch
