image

DC Chargers Market Size and Overview
DC Chargers Market Revenue Analysis

To get more information on DC Chargers Market - Request Sample Report

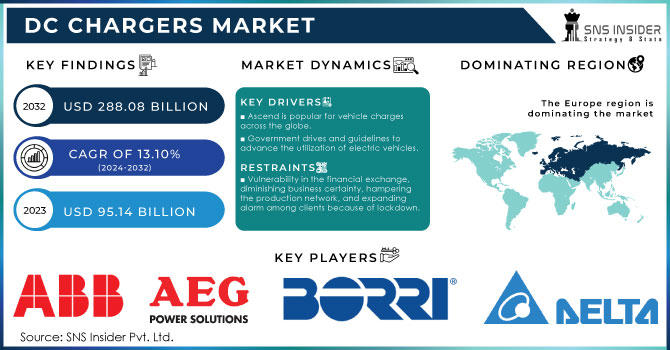
The DC Chargers Market Size was valued at USD 95.14 Billion in 2023 and is projected to reach USD 288.08 Billion by 2032, growing at a CAGR of 13.10% over the forecast period 2024-2032.

DC chargers give DC power yield. DC batteries consume DC power and are utilized to charge batteries for gadgets, alongside auto and modern applications. They convert the information sign to a DC yield signal. DC chargers are the favored kind of chargers for the greater part of electronic gadgets. In DC circuits, there is a unidirectional progression of the current instead of the AC circuits. DC power is utilized at whatever point, AC power transmission is not possible to ship. The DC chargers are progressively used to charge convenient electronic gadgets like mobile phones, workstations, tablets, and other wearable gadgets. The worldwide DC chargers market income is supposed to observe critical development as the interest for these convenient gadgets is on the ascent. DC chargers track down applications in cell phones, PCs, tablets, electric vehicles, and modern hardware.DC chargers for electric vehicles are the most recent advancement in the car business. They give DC power straightforwardly to electric vehicles. DC chargers for electric vehicles have made it conceivable to cover the distance of 350 km and more in a solitary charge. The quick DC charging has helped the vehicle proprietors and drivers to re-energize during their voyaging time or on a brief break rather than being connected for the time being, for several hours to get charged. Various sorts of quick DC chargers are accessible on the lookout. They are joined charging framework, CHAdeMO, and Tesla supercharger.

The DC chargers market is witnessing remarkable growth, driven by the rising adoption of electric vehicles (EVs) and the pressing need for a comprehensive charging infrastructure. This expansion is largely fueled by the demand for efficient and rapid charging solutions that cater to the expanding EV user base. As nations, including India, increasingly focus on sustainable transportation and greener technologies, investments in fast-charging infrastructure are anticipated to soar.ZETWERK's recent approval of 60kW and 120kW DC fast chargers by the Automotive Research Association of India (ARAI) exemplifies the initiatives aimed at enhancing EV infrastructure in the country. This certification aligns perfectly with the government's 'Make-in-India' initiative, emphasizing the commitment to strengthening the electric vehicle ecosystem. Through a partnership with Indian Oil Corporation Limited (IOCL), ZETWERK plans to install over 1,400 fast chargers, featuring advanced options like the DC Dual Gun CCS2 DC Charger, which will greatly enhance accessibility to charging stations. Such efforts are essential for tackling the challenges of charging availability and improving the overall experience of EV ownership. ZETWERK is in the process of developing Super DC Chargers of 240 kW and 360 kW, designed for commercial and public charging stations, which offer even faster charging capabilities. This initiative not only meets the growing consumer demand for rapid charging solutions but also reflects a broader market trend towards high-capacity charging infrastructure that aligns with the evolving needs of electric vehicle users. As the DC fast chargers market continues to grow, the introduction of innovative technologies and strategic collaborations will be crucial in shaping the future of electric mobility in India and beyond.

DC Chargers Market Dynamics

Drivers

  • The Role of Advanced DC Chargers Market in speeding up EV adoption.

The significant increase in global electric mobility is largely being fueled by advancements in charging technology, specifically the development of high-capacity DC fast chargers. An outstanding instance is the Alpitronic HYC400, which is now the initial 400-kilowatt (kW) charger approved by UL Solutions in Europe, signifying a significant achievement in the realm of EV charging. This certification helps Alpitronic break into the North American market and demonstrates dedication to improving the safety, reliability, and performance of electric vehicle (EV) charging solutions. With governments around the world aiming to boost the presence of electric vehicles on the roads by 2030, the need for effective charging infrastructure is becoming increasingly urgent. The HYC400 tackles a key obstacle in EV adoption – range anxiety and the time taken for charging – by significantly decreasing charging times in comparison to traditional methods. The increased focus on fast chargers mirrors the overall trend in the DC fast charger industry, which is experiencing a rise in installations as electric vehicle sales increase and efforts are made to enhance the accessibility and compatibility of charging networks. In the last ten years, there has been a notable growth in the EV charging infrastructure, specifically in public charging stations, especially fast chargers, due to the increased popularity of electric vehicles. By advancing in charging technology, industry leaders like Alpitronic are improving the user experience and driving the shift towards electric mobility, thereby promoting a sustainable transportation future.

Restraints

  • Overcoming Major Challenges Impacting the DC Chargers Market

The DC chargers market, while experiencing significant growth, faces several restraints that could impede its expansion. One major challenge is the high infrastructure development costs associated with installing fast charging stations. According to a report from the International Energy Agency (IEA), the average cost of a DC fast charging station can range from $50,000 to $150,000, which poses a significant investment barrier for potential operators, especially in developing regions. Additionally, the lack of standardization in charging protocols complicates interoperability among different EV models and charging systems, leading to consumer confusion and limiting user adoption. Moreover, the relatively limited availability of electrical grid capacity in certain areas can restrict the deployment of high-capacity DC chargers, creating bottlenecks in urban and rural settings alike. Furthermore, safety regulations and certifications, although necessary for ensuring reliable performance, can prolong the time to market for new charging technologies. As the demand for electric vehicles continues to rise, addressing these challenges is crucial for the sustainable growth of the DC chargers market. The U.S. Department of Energy emphasizes the need for comprehensive strategies to improve charging infrastructure accessibility to support the EV ecosystem effectively.

DC Chargers Market Segment Outlook

By Power

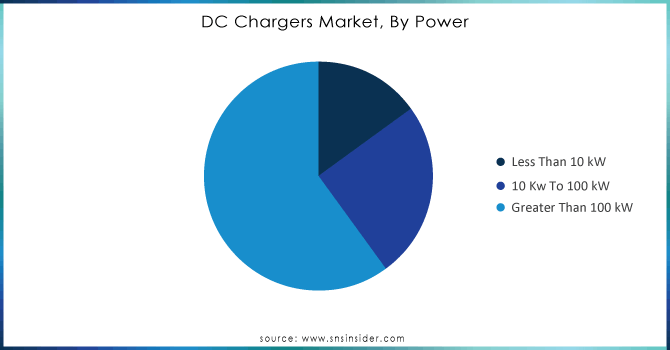
Based on Power, Greater Than 100 kW is captured the largest share in DC Chargers Market with 60% of share in 2023. This dominance is primarily attributed to the growing demand for rapid charging solutions that cater to the increasing number of electric vehicles (EVs) on the roads. High-capacity chargers significantly reduce charging times, which is crucial for enhancing the user experience and mitigating range anxiety among EV users. Leading companies in the industry, such as Alpitronic and ZETWERK, have made substantial strides by launching advanced chargers that cater to this segment. For instance, Alpitronic recently launched the HYC400, a 400 kW DC fast charger that has achieved UL certification, reinforcing its commitment to delivering high-performance charging solutions. Similarly, ZETWERK's launch of the 60 kW and 120 kW DC fast chargers, along with their plans to develop Super DC Chargers of 240 kW and 360 kW, demonstrates a focused approach to expanding the high-power charging infrastructure in India. These innovations not only enhance charging efficiency but also align with global trends towards sustainable transportation and increased EV adoption, positioning greater than 100 kW chargers as the backbone of future charging networks.
DC Chargers Market, By Power

To Get Customized Report as per your Business Requirement - Request For Customized Report

By End User

Based on End User, Automotive is hold the largest share in DC Chargers Market with 60% of share in 2023. This dominance is largely driven by the rapid expansion of the electric vehicle (EV) market, as consumers increasingly shift towards sustainable transportation solutions. Major automotive manufacturers are investing heavily in electric mobility and, consequently, in the development of robust charging infrastructures. Companies like Tesla have significantly contributed to this growth by establishing extensive networks of high-capacity Superchargers that cater specifically to their EV lineup, ensuring fast charging capabilities that enhance user convenience. Additionally, Ford has been expanding its EV offerings and is partnering with charging network providers to install DC fast chargers across the United States. General Motors is also advancing its initiatives by planning to deploy thousands of fast chargers nationwide to support its growing electric vehicle lineup. Furthermore, new entrants such as Rivian are innovating in the automotive space, creating their own fast-charging networks tailored for their electric trucks. This concerted effort from automotive companies not only strengthens the infrastructure but also encourages greater EV adoption, ensuring that the automotive sector remains the pivotal driver of growth in the DC chargers market.

DC Chargers Market Regional Analysis

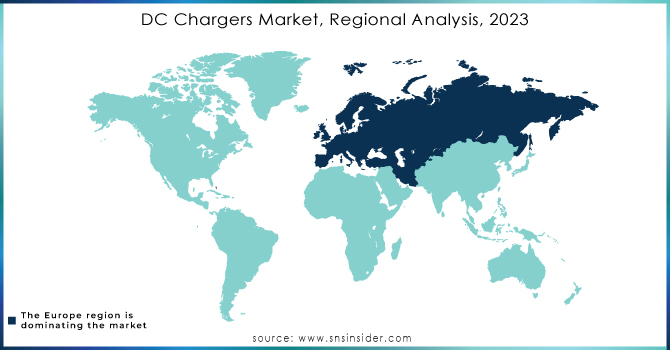
Asia-Pacific dominated the largest share revenue in DC Chargers with 42% of share in 2023. This leadership is fueled by the region's robust electric vehicle (EV) adoption rates, supported by favorable government policies and substantial investments in charging infrastructure. Countries like China have taken significant strides, with initiatives aimed at expanding EV charging networks nationwide, reflecting their commitment to reducing carbon emissions and promoting green technology. The Chinese government has set ambitious targets to increase the number of charging stations, thus facilitating broader EV acceptance. In India, ZETWERK made notable advancements by launching its 60 kW and 120 kW DC fast chargers, which have been approved by the Automotive Research Association of India (ARAI). These chargers are set to enhance the country’s EV infrastructure and align with the ‘Make-in-India’ initiative. Furthermore, the collaboration between ZETWERK and Indian Oil Corporation Limited (IOCL) to install over 1,400 fast chargers is poised to significantly improve the accessibility of charging stations across the country. Meanwhile, Japan continues to innovate with companies like Mitsubishi and Nissan, developing high-capacity chargers that cater to the growing EV market. Collectively, these developments position Asia-Pacific as a key player in shaping the future of electric mobility globally.

In 2023, North America has emerged as the fastest-growing region in the DC chargers market, driven by a surge in electric vehicle (EV) adoption and increasing investments in charging infrastructure. The region is experiencing a robust transformation in its transportation landscape, fueled by federal initiatives and state-level incentives aimed at promoting electric mobility. Companies like Tesla continue to lead the charge, expanding their extensive Supercharger network across the United States and Canada, providing high-capacity charging solutions that significantly reduce charging times for EV users. Additionally, ChargePoint has announced the deployment of its new Express 250 DC fast chargers, designed to deliver rapid charging for a variety of electric vehicles, enhancing the convenience for drivers and supporting the growing demand for fast charging solutions. Electrify America is making significant strides by launching over 800 DC fast charging stations across the country, aiming to create an extensive network that supports both urban and rural EV users. The Biden administration's commitment to installing 500,000 public chargers by 2030 is also fostering an environment conducive to market growth, encouraging partnerships between government and private enterprises to enhance charging accessibility. This strategic focus on building a robust charging infrastructure not only solidifies North America's position as a leader in the EV sector but also establishes a comprehensive ecosystem that supports the ongoing transition to electric mobility.
DC-Chargers-Market-Regional-Analysis-2023

Key Players

Some of the Major Players in DC Chargers Market who offer their product and offering:

  • ABB Ltd. (Terra HP, Terra 94 DC fast chargers)

  • Aeg Power Solutions (3W Power S.A.) (Protect 8 series DC chargers)

  • Borri S.P.A (Legrand Group) (E3001 series DC chargers)

  • Delta Electronics, Inc. (Delta Ultra Fast Charger, DC Wallbox)

  • Helios Power Solutions Group (Helios DC Power Systems)

  • Hitachi Hi-Rel Power Electronics Private Ltd. (Hitachi, Ltd.) (RANGE IGBT-based DC chargers)

  • Kirloskar Electric Company Ltd. (Kirloskar DC fast chargers)

  • Phihong Technology Co., Ltd. (Phihong DC Fast Charging Station)

  • Siemens AG (SICHARGE D series DC chargers)

  • Statron Ltd. (Statron DC Power Systems)

  • Tritium Pty Ltd. (RTM 75 and PKM 150 DC fast chargers)

  • Schneider Electric SE (EVlink DC fast chargers)

  • EVBox Group (EVBox Troniq Modular DC charger)

  • Alpitronic GmbH (HYC 300/350 DC fast chargers)

  • Efacec Power Solutions (HV160 and QC45 DC fast chargers)

  • Tesla, Inc. (Supercharger V3)

  • BYD Company Ltd. (DC Fast Chargers for electric buses and trucks)

  • Blink Charging Co. (IQ 200 DC fast charger)

  • BP Pulse (BP Pulse Ultra-Fast DC Chargers)

  • EVgo Services LLC (150kW and 350kW DC fast chargers)

  • Others

Recent Development

  • On May 14, 2024, Exicom unveiled India's fastest DC charger for electric vehicles, the Harmony Gen 1.5. This advanced DC fast charger boasts a modular design, offering power outputs ranging from 60 kW to 400 kW. It is designed for versatile use, making it ideal for in-city locations, highways, and heavy-duty fleets, marking a significant leap in India's EV charging infrastructure.

  • On September 18, 2024, General Motors announced that its drivers can now access over 17,800 Tesla Superchargers using a GM-approved NACS DC adapter. This move expands GM customers' access to more than 231,800 public Level 2 and DC fast chargers across North America.


DC Chargers Market Report Scope:

Report Attributes Details
Market Size in 2023 USD 95.14  Billion
Market Size by 2032 USD 288.08   Billion
CAGR CAGR of 13.10 % From 2024 to 2032
Base Year 2023
Forecast Period 2024-2032
Historical Data 2020-2022
Report Scope & Coverage Market Size, Segments Analysis, Competitive  Landscape, Regional Analysis, DROC & SWOT Analysis, Forecast Outlook
Key Segments • By Power Output (Less Than 10 Kw, 10 Kw To 100 Kw, Greater Than 100 Kw)
• By End User(Automotive, Consumer Electronics, And Industrial)
Regional Analysis/Coverage North America (US, Canada, Mexico), Europe (Eastern Europe [Poland, Romania, Hungary, Turkey, Rest of Eastern Europe] Western Europe] Germany, France, UK, Italy, Spain, Netherlands, Switzerland, Austria, Rest of Western Europe]), Asia-Pacific (China, India, Japan, South Korea, Vietnam, Singapore, Australia, Rest of Asia-Pacific), Middle East & Africa (Middle East [UAE, Egypt, Saudi Arabia, Qatar, Rest of Middle East], Africa [Nigeria, South Africa, Rest of Africa], Latin America (Brazil, Argentina, Colombia, Rest of Latin America)
Company Profiles ABB Ltd., Aeg Power Solutions (3w Power S.A.), Borri S.P.A (Legrand Group), Delta Electronics, Inc., Helios Power Solutions Group, Hitachi Hi-Rel Power Electronics Private Ltd. (Hitachi, Ltd.), Kirloskar Electric Company Ltd, Phihong Technology Co., Ltd., Siemens Ag, Statron Ltd.,Tritium Pty Ltd. ,Schneider Electric SE ,EVBox Group ,Alpitronic GmbH ,Efacec Power Solutions ,Tesla, Inc. ,BYD Company Ltd., Blink Charging Co. ,BP Pulse ,EVgo Services LLC & Others 
Key Drivers • The Role of Advanced DC Chargers Market in speeding up EV adoption.
RESTRAINTS • Overcoming Major Challenges Impacting the DC Chargers Market

Frequently Asked Questions

Ans: The DC Chargers Market grow at a CAGR of 13.10% over the forecast period of 2024-2032.

Ans: The DC Chargers Market Size was valued at USD 95.14 Billion in 2023 and is projected to reach USD 288.08 Billion by 2032.


Ans: The major growth factor of the DC Chargers Market is the increasing adoption of electric vehicles (EVs), driven by government initiatives and consumer demand for efficient charging solutions.

Ans: The Greater Than 100 kW segment dominated the DC Chargers Market

Ans: Asia-Pacific dominated the DC Chargers Market in 2023.

Table of Content

1. Introduction

1.1 Market Definition

1.2 Scope (Inclusion and Exclusions)

1.3 Research Assumptions

2. Executive Summary

2.1 Market Overview

2.2 Regional Synopsis

2.3 Competitive Summary

3. Research Methodology

3.1 Top-Down Approach

3.2 Bottom-up Approach

3.3. Data Validation

3.4 Primary Interviews

4. Market Dynamics Impact Analysis

4.1 Market Driving Factors Analysis

4.1.2 Drivers

4.1.2 Restraints

4.1.3 Opportunities

4.1.4 Challenges

4.2 PESTLE Analysis

4.3 Porter’s Five Forces Model

5. Statistical Insights and Trends Reporting

5.1 Wafer Production Volumes, by Region (2023)

5.2 Chip Design Trends (Historic and Future)

5.3 Fab Capacity Utilization (2023)

5.4 Supply Chain Metrics

6. Competitive Landscape

6.1 List of Major Companies, By Region

6.2 Market Share Analysis, By Region

6.3 Product Benchmarking

6.3.1 Product specifications and features

6.3.2 Pricing

6.4 Strategic Initiatives

6.4.1 Marketing and promotional activities

6.4.2 Distribution and supply chain strategies

6.4.3 Expansion plans and new product launches

6.4.4 Strategic partnerships and collaborations

6.5 Technological Advancements

6.6 Market Positioning and Branding

7. DC Chargers Market Segmentation, by Power

7.1 Chapter Overview

7.2 Less Than 10 kW

7.2.1 Less Than 10 kW Market Trends Analysis (2020-2032)

7.2.2 Less Than 10 kW Market Size Estimates and Forecasts to 2032 (USD Billion)

7.3 10 Kw To 100 kW

7.3.1 10 Kw To 100 kW Market Trends Analysis (2020-2032)

7.3.2 10 Kw To 100 kW Market Size Estimates and Forecasts to 2032 (USD Billion)

7.4 Greater Than 100 kW

7.4.1 Greater Than 100 kW Market Trends Analysis (2020-2032)

7.4.2 Greater Than 100 kW Market Size Estimates and Forecasts to 2032 (USD Billion)

8. DC Chargers Market Segmentation, by End User

8.1 Chapter Overview

8.2 Automotive

8.2.1 Automotive Market Trends Analysis (2020-2032)

8.2.2 Automotive Market Size Estimates and Forecasts to 2032 (USD Billion)

8.3 Industrial

8.3.1 Industrial Market Trends Analysis (2020-2032)

8.3.2 Industrial Market Size Estimates and Forecasts to 2032 (USD Billion)

8.4 Consumer Electronics

8.4.1 Consumer Electronics Market Trends Analysis (2020-2032)

8.4.2 Consumer Electronics Market Size Estimates and Forecasts to 2032 (USD Billion)

9. Regional Analysis

9.1 Chapter Overview

9.2 North America

9.2.1 Trends Analysis

9.2.2 North America DC Chargers Market Estimates and Forecasts, by Country (2020-2032) (USD Billion)

9.2.3 North America DC Chargers Market Estimates and Forecasts, by Power (2020-2032) (USD Billion)  

9.2.4 North America DC Chargers Market Estimates and Forecasts, by End User (2020-2032) (USD Billion)

9.2.5 USA

9.2.5.1 USA DC Chargers Market Estimates and Forecasts, by Power (2020-2032) (USD Billion)

9.2.5.2 USA DC Chargers Market Estimates and Forecasts, by End User (2020-2032) (USD Billion)

9.2.6 Canada

9.2.6.1 Canada DC Chargers Market Estimates and Forecasts, by Power (2020-2032) (USD Billion)

9.2.6.2 Canada DC Chargers Market Estimates and Forecasts, by End User (2020-2032) (USD Billion)

9.2.7 Mexico

9.2.7.1 Mexico DC Chargers Market Estimates and Forecasts, by Power (2020-2032) (USD Billion)

9.2.7.2 Mexico DC Chargers Market Estimates and Forecasts, by End User (2020-2032) (USD Billion)

9.3 Europe

9.3.1 Eastern Europe

9.3.1.1 Trends Analysis

9.3.1.2 Eastern Europe DC Chargers Market Estimates and Forecasts, by Country (2020-2032) (USD Billion)

9.3.1.3 Eastern Europe DC Chargers Market Estimates and Forecasts, by Power (2020-2032) (USD Billion)  

9.3.1.4 Eastern Europe DC Chargers Market Estimates and Forecasts, by End User (2020-2032) (USD Billion)

9.3.1.5 Poland

9.3.1.5.1 Poland DC Chargers Market Estimates and Forecasts, by Power (2020-2032) (USD Billion)

9.3.1.5.2 Poland DC Chargers Market Estimates and Forecasts, by End User (2020-2032) (USD Billion)

9.3.1.6 Romania

9.3.1.6.1 Romania DC Chargers Market Estimates and Forecasts, by Power (2020-2032) (USD Billion)

9.3.1.6.2 Romania DC Chargers Market Estimates and Forecasts, by End User (2020-2032) (USD Billion)

9.3.1.7 Hungary

9.3.1.7.1 Hungary DC Chargers Market Estimates and Forecasts, by Power (2020-2032) (USD Billion)

9.3.1.7.2 Hungary DC Chargers Market Estimates and Forecasts, by End User (2020-2032) (USD Billion)

9.3.1.8 Turkey

9.3.1.8.1 Turkey DC Chargers Market Estimates and Forecasts, by Power (2020-2032) (USD Billion)

9.3.1.8.2 Turkey DC Chargers Market Estimates and Forecasts, by End User (2020-2032) (USD Billion)

9.3.1.9 Rest of Eastern Europe

9.3.1.9.1 Rest of Eastern Europe DC Chargers Market Estimates and Forecasts, by Power (2020-2032) (USD Billion)

9.3.1.9.2 Rest of Eastern Europe DC Chargers Market Estimates and Forecasts, by End User (2020-2032) (USD Billion)

9.3.2 Western Europe

9.3.2.1 Trends Analysis

9.3.2.2 Western Europe DC Chargers Market Estimates and Forecasts, by Country (2020-2032) (USD Billion)

9.3.2.3 Western Europe DC Chargers Market Estimates and Forecasts, by Power (2020-2032) (USD Billion)  

9.3.2.4 Western Europe DC Chargers Market Estimates and Forecasts, by End User (2020-2032) (USD Billion)

9.3.2.5 Germany

9.3.2.5.1 Germany DC Chargers Market Estimates and Forecasts, by Power (2020-2032) (USD Billion)

9.3.2.5.2 Germany DC Chargers Market Estimates and Forecasts, by End User (2020-2032) (USD Billion)

9.3.2.6 France

9.3.2.6.1 France DC Chargers Market Estimates and Forecasts, by Power (2020-2032) (USD Billion)

9.3.2.6.2 France DC Chargers Market Estimates and Forecasts, by End User (2020-2032) (USD Billion)

9.3.2.7 UK

9.3.2.7.1 UK DC Chargers Market Estimates and Forecasts, by Power (2020-2032) (USD Billion)

9.3.2.7.2 UK DC Chargers Market Estimates and Forecasts, by End User (2020-2032) (USD Billion)

9.3.2.8 Italy

9.3.2.8.1 Italy DC Chargers Market Estimates and Forecasts, by Power (2020-2032) (USD Billion)

9.3.2.8.2 Italy DC Chargers Market Estimates and Forecasts, by End User (2020-2032) (USD Billion)

9.3.2.9 Spain

9.3.2.9.1 Spain DC Chargers Market Estimates and Forecasts, by Power (2020-2032) (USD Billion)

9.3.2.9.2 Spain DC Chargers Market Estimates and Forecasts, by End User (2020-2032) (USD Billion)

9.3.2.10 Netherlands

9.3.2.10.1 Netherlands DC Chargers Market Estimates and Forecasts, by Power (2020-2032) (USD Billion)

9.3.2.10.2 Netherlands DC Chargers Market Estimates and Forecasts, by End User (2020-2032) (USD Billion)

9.3.2.11 Switzerland

9.3.2.11.1 Switzerland DC Chargers Market Estimates and Forecasts, by Power (2020-2032) (USD Billion)

9.3.2.11.2 Switzerland DC Chargers Market Estimates and Forecasts, by End User (2020-2032) (USD Billion)

9.3.2.12 Austria

9.3.2.12.1 Austria DC Chargers Market Estimates and Forecasts, by Power (2020-2032) (USD Billion)

9.3.2.12.2 Austria DC Chargers Market Estimates and Forecasts, by End User (2020-2032) (USD Billion)

9.3.2.13 Rest of Western Europe

9.3.2.13.1 Rest of Western Europe DC Chargers Market Estimates and Forecasts, by Power (2020-2032) (USD Billion)

9.3.2.13.2 Rest of Western Europe DC Chargers Market Estimates and Forecasts, by End User (2020-2032) (USD Billion)

9.4 Asia-Pacific

9.4.1 Trends Analysis

9.4.2 Asia-Pacific DC Chargers Market Estimates and Forecasts, by Country (2020-2032) (USD Billion)

9.4.3 Asia-Pacific DC Chargers Market Estimates and Forecasts, by Power (2020-2032) (USD Billion)  

9.4.4 Asia-Pacific DC Chargers Market Estimates and Forecasts, by End User (2020-2032) (USD Billion)

9.4.5 China

9.4.5.1 China DC Chargers Market Estimates and Forecasts, by Power (2020-2032) (USD Billion)

9.4.5.2 China DC Chargers Market Estimates and Forecasts, by End User (2020-2032) (USD Billion)

9.4.6 India

9.4.5.1 India DC Chargers Market Estimates and Forecasts, by Power (2020-2032) (USD Billion)

9.4.5.2 India DC Chargers Market Estimates and Forecasts, by End User (2020-2032) (USD Billion)

9.4.5 Japan

9.4.5.1 Japan DC Chargers Market Estimates and Forecasts, by Power (2020-2032) (USD Billion)

9.4.5.2 Japan DC Chargers Market Estimates and Forecasts, by End User (2020-2032) (USD Billion)

9.4.6 South Korea

9.4.6.1 South Korea DC Chargers Market Estimates and Forecasts, by Power (2020-2032) (USD Billion)

9.4.6.2 South Korea DC Chargers Market Estimates and Forecasts, by End User (2020-2032) (USD Billion)

9.4.7 Vietnam

9.4.7.1 Vietnam DC Chargers Market Estimates and Forecasts, by Power (2020-2032) (USD Billion)

9.2.7.2 Vietnam DC Chargers Market Estimates and Forecasts, by End User (2020-2032) (USD Billion)

9.4.8 Singapore

9.4.8.1 Singapore DC Chargers Market Estimates and Forecasts, by Power (2020-2032) (USD Billion)

9.4.8.2 Singapore DC Chargers Market Estimates and Forecasts, by End User (2020-2032) (USD Billion)

9.4.9 Australia

9.4.9.1 Australia DC Chargers Market Estimates and Forecasts, by Power (2020-2032) (USD Billion)

9.4.9.2 Australia DC Chargers Market Estimates and Forecasts, by End User (2020-2032) (USD Billion)

9.4.10 Rest of Asia-Pacific

9.4.10.1 Rest of Asia-Pacific DC Chargers Market Estimates and Forecasts, by Power (2020-2032) (USD Billion)

9.4.10.2 Rest of Asia-Pacific DC Chargers Market Estimates and Forecasts, by End User (2020-2032) (USD Billion)

9.5 Middle East and Africa

9.5.1 Middle East

9.5.1.1 Trends Analysis

9.5.1.2 Middle East DC Chargers Market Estimates and Forecasts, by Country (2020-2032) (USD Billion)

9.5.1.3 Middle East DC Chargers Market Estimates and Forecasts, by Power (2020-2032) (USD Billion)  

9.5.1.4 Middle East DC Chargers Market Estimates and Forecasts, by End User (2020-2032) (USD Billion)

9.5.1.5 UAE

9.5.1.5.1 UAE DC Chargers Market Estimates and Forecasts, by Power (2020-2032) (USD Billion)

9.5.1.5.2 UAE DC Chargers Market Estimates and Forecasts, by End User (2020-2032) (USD Billion)

9.5.1.6 Egypt

9.5.1.6.1 Egypt DC Chargers Market Estimates and Forecasts, by Power (2020-2032) (USD Billion)

9.5.1.6.2 Egypt DC Chargers Market Estimates and Forecasts, by End User (2020-2032) (USD Billion)

9.5.1.7 Saudi Arabia

9.5.1.7.1 Saudi Arabia DC Chargers Market Estimates and Forecasts, by Power (2020-2032) (USD Billion)

9.5.1.7.2 Saudi Arabia DC Chargers Market Estimates and Forecasts, by End User (2020-2032) (USD Billion)

9.5.1.8 Qatar

9.5.1.8.1 Qatar DC Chargers Market Estimates and Forecasts, by Power (2020-2032) (USD Billion)

9.5.1.8.2 Qatar DC Chargers Market Estimates and Forecasts, by End User (2020-2032) (USD Billion)

9.5.1.9 Rest of Middle East

9.5.1.9.1 Rest of Middle East DC Chargers Market Estimates and Forecasts, by Power (2020-2032) (USD Billion)

9.5.1.9.2 Rest of Middle East DC Chargers Market Estimates and Forecasts, by End User (2020-2032) (USD Billion)

9.5.2 Africa

9.5.2.1 Trends Analysis

9.5.2.2 Africa DC Chargers Market Estimates and Forecasts, by Country (2020-2032) (USD Billion)

9.5.2.3 Africa DC Chargers Market Estimates and Forecasts, by Power (2020-2032) (USD Billion)  

9.5.2.4 Africa DC Chargers Market Estimates and Forecasts, by End User (2020-2032) (USD Billion)

9.5.2.5 South Africa

9.5.2.5.1 South Africa DC Chargers Market Estimates and Forecasts, by Power (2020-2032) (USD Billion)

9.5.2.5.2 South Africa DC Chargers Market Estimates and Forecasts, by End User (2020-2032) (USD Billion)

9.5.2.6 Nigeria

9.5.2.6.1 Nigeria DC Chargers Market Estimates and Forecasts, by Power (2020-2032) (USD Billion)

9.5.2.6.2 Nigeria DC Chargers Market Estimates and Forecasts, by End User (2020-2032) (USD Billion)

9.5.2.7 Rest of Africa

9.5.2.7.1 Rest of Africa DC Chargers Market Estimates and Forecasts, by Power (2020-2032) (USD Billion)

9.5.2.7.2 Rest of Africa DC Chargers Market Estimates and Forecasts, by End User (2020-2032) (USD Billion)

9.6 Latin America

9.6.1 Trends Analysis

9.6.2 Latin America DC Chargers Market Estimates and Forecasts, by Country (2020-2032) (USD Billion)

9.6.3 Latin America DC Chargers Market Estimates and Forecasts, by Power (2020-2032) (USD Billion)  

9.6.4 Latin America DC Chargers Market Estimates and Forecasts, by End User (2020-2032) (USD Billion)

9.6.5 Brazil

9.6.5.1 Brazil DC Chargers Market Estimates and Forecasts, by Power (2020-2032) (USD Billion)

9.6.5.2 Brazil DC Chargers Market Estimates and Forecasts, by End User (2020-2032) (USD Billion)

9.6.6 Argentina

9.6.6.1 Argentina DC Chargers Market Estimates and Forecasts, by Power (2020-2032) (USD Billion)

9.6.6.2 Argentina DC Chargers Market Estimates and Forecasts, by End User (2020-2032) (USD Billion)

9.6.7 Colombia

9.6.7.1 Colombia DC Chargers Market Estimates and Forecasts, by Power (2020-2032) (USD Billion)

9.6.7.2 Colombia DC Chargers Market Estimates and Forecasts, by End User (2020-2032) (USD Billion)

9.6.8 Rest of Latin America

9.6.8.1 Rest of Latin America DC Chargers Market Estimates and Forecasts, by Power (2020-2032) (USD Billion)

9.6.8.2 Rest of Latin America DC Chargers Market Estimates and Forecasts, by End User (2020-2032) (USD Billion)

10. Company Profiles

10.1 ABB Ltd.

10.1.1 Company Overview

10.1.2 Financial

10.1.3 Products/ Services Offered

110.1.4 SWOT Analysis

10.2 Aeg Power Solutions (3w Power S.A.)

10.2.1 Company Overview

10.2.2 Financial

10.2.3 Products/ Services Offered

10.2.4 SWOT Analysis

10.3 Borri S.P.A (Legrand Group)

10.3.1 Company Overview

10.3.2 Financial

10.3.3 Products/ Services Offered

10.3.4 SWOT Analysis

10.4 Delta Electronics, Inc.

10.4.1 Company Overview

10.4.2 Financial

10.4.3 Products/ Services Offered

10.4.4 SWOT Analysis

10.5 Helios Power Solutions Group

10.5.1 Company Overview

10.5.2 Financial

10.5.3 Products/ Services Offered

10.5.4 SWOT Analysis

10.6 Hitachi Hi-Rel Power Electronics Private Ltd. (Hitachi, Ltd.)

10.6.1 Company Overview

10.6.2 Financial

10.6.3 Products/ Services Offered

10.6.4 SWOT Analysis

10.7 Kirloskar Electric Company Ltd

10.7.1 Company Overview

10.7.2 Financial

10.7.3 Products/ Services Offered

10.7.4 SWOT Analysis

10.8 , Phihong Technology Co., Ltd.

10.8.1 Company Overview

10.8.2 Financial

10.8.3 Products/ Services Offered

10.8.4 SWOT Analysis

10.9 Siemens Ag

10.9.1 Company Overview

10.9.2 Financial

10.9.3 Products/ Services Offered

10.9.4 SWOT Analysis

10.10 Statron Ltd.

             10.9.1 Company Overview

10.9.2 Financial

10.9.3 Products/ Services Offered

10.9.4 SWOT Analysis

11. Use Cases and Best Practices

12. Conclusion

An accurate research report requires proper strategizing as well as implementation. There are multiple factors involved in the completion of good and accurate research report and selecting the best methodology to compete the research is the toughest part. Since the research reports we provide play a crucial role in any company’s decision-making process, therefore we at SNS Insider always believe that we should choose the best method which gives us results closer to reality. This allows us to reach at a stage wherein we can provide our clients best and accurate investment to output ratio.

Each report that we prepare takes a timeframe of 350-400 business hours for production. Starting from the selection of titles through a couple of in-depth brain storming session to the final QC process before uploading our titles on our website we dedicate around 350 working hours. The titles are selected based on their current market cap and the foreseen CAGR and growth.


The 5 steps process:

Step 1: Secondary Research:

Secondary Research or Desk Research is as the name suggests is a research process wherein, we collect data through the readily available information. In this process we use various paid and unpaid databases which our team has access to and gather data through the same. This includes examining of listed companies’ annual reports, Journals, SEC filling etc. Apart from this our team has access to various associations across the globe across different industries. Lastly, we have exchange relationships with various university as well as individual libraries.

Secondary Research

Step 2: Primary Research

When we talk about primary research, it is a type of study in which the researchers collect relevant data samples directly, rather than relying on previously collected data.  This type of research is focused on gaining content specific facts that can be sued to solve specific problems. Since the collected data is fresh and first hand therefore it makes the study more accurate and genuine.

We at SNS Insider have divided Primary Research into 2 parts.

Part 1 wherein we interview the KOLs of major players as well as the upcoming ones across various geographic regions. This allows us to have their view over the market scenario and acts as an important tool to come closer to the accurate market numbers. As many as 45 paid and unpaid primary interviews are taken from both the demand and supply side of the industry to make sure we land at an accurate judgement and analysis of the market.

This step involves the triangulation of data wherein our team analyses the interview transcripts, online survey responses and observation of on filed participants. The below mentioned chart should give a better understanding of the part 1 of the primary interview.

Primary Research

Part 2: In this part of primary research the data collected via secondary research and the part 1 of the primary research is validated with the interviews from individual consultants and subject matter experts.

Consultants are those set of people who have at least 12 years of experience and expertise within the industry whereas Subject Matter Experts are those with at least 15 years of experience behind their back within the same space. The data with the help of two main processes i.e., FGDs (Focused Group Discussions) and IDs (Individual Discussions). This gives us a 3rd party nonbiased primary view of the market scenario making it a more dependable one while collation of the data pointers.

Step 3: Data Bank Validation

Once all the information is collected via primary and secondary sources, we run that information for data validation. At our intelligence centre our research heads track a lot of information related to the market which includes the quarterly reports, the daily stock prices, and other relevant information. Our data bank server gets updated every fortnight and that is how the information which we collected using our primary and secondary information is revalidated in real time.

Data Bank Validation

Step 4: QA/QC Process

After all the data collection and validation our team does a final level of quality check and quality assurance to get rid of any unwanted or undesired mistakes. This might include but not limited to getting rid of the any typos, duplication of numbers or missing of any important information. The people involved in this process include technical content writers, research heads and graphics people. Once this process is completed the title gets uploader on our platform for our clients to read it.

Step 5: Final QC/QA Process:

This is the last process and comes when the client has ordered the study. In this process a final QA/QC is done before the study is emailed to the client. Since we believe in giving our clients a good experience of our research studies, therefore, to make sure that we do not lack at our end in any way humanly possible we do a final round of quality check and then dispatch the study to the client.

Key Segments:

By Power Output

  • Less Than 10 kW

  • 10 Kw To 100 kW

  • Greater Than 100 kW

By End Use

  • Automotive

  • Industrial

  • Consumer Electronics

Request for Segment Customization as per your Business Requirement: Segment Customization Request

REGIONAL COVERAGE:

North America

  • US

  • Canada

  • Mexico

Europe

  • Eastern Europe

    • Poland

    • Romania

    • Hungary

    • Turkey

    • Rest of Eastern Europe

  • Western Europe

    • Germany

    • France

    • UK

    • Italy

    • Spain

    • Netherlands

    • Switzerland

    • Austria

    • Rest of Western Europe

Asia-Pacific

  • China

  • India

  • Japan

  • South Korea

  • Vietnam

  • Singapore

  • Australia

  • Rest of Asia-Pacific

Middle East & Africa

  • Middle East

    • UAE

    • Egypt

    • Saudi Arabia

    • Qatar

    • Rest of the Middle East

  • Africa

    • Nigeria

    • South Africa

    • Rest of Africa

Latin America

  • Brazil

  • Argentina

  • Colombia

Request for Country Level Research Report: Country Level Customization Request

Available Customization

With the given market data, SNS Insider offers customization as per the company’s specific needs. The following customization options are available for the report:

  • Product Analysis

  • Criss-Cross segment analysis (e.g. Product X Application)

  • Product Matrix which gives a detailed comparison of the product portfolio of each company

  • Geographic Analysis

  • Additional countries in any of the regions

  • Company Information

  • Detailed analysis and profiling of additional market players (Up to five)


  •            5000 (33% Discount)


  •            8950 (40% Discount)


  •            3050 (23% Discount)

Start a Conversation

Hi! Click one of our member below to chat on Phone