image

Low-Calorie Food Market Report Scope & Overview:

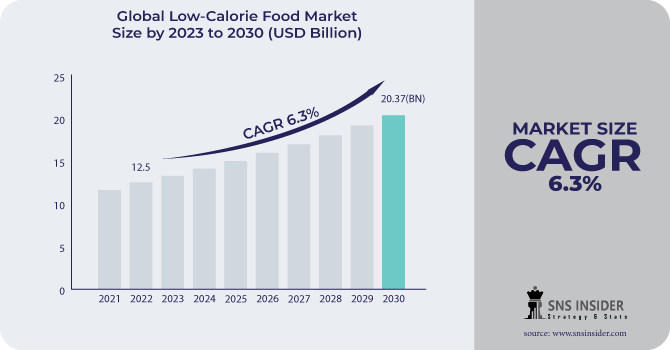
The Low-Calorie Food Market size was USD 12.5 billion in 2022 and is expected to Reach USD 20.37 billion by 2030 and grow at a CAGR of 6.3% over the forecast period of 2023-2030. 

Obesity is a condition that affects all of the body's systems. It has ramifications for the heart, liver, kidneys, joints, and reproductive system. It causes a variety of noncommunicable diseases (NCDs), including type 2 diabetes, hypertension, cardiovascular disease, and stroke, as well as many types of cancer and mental health difficulties. Obesity affects more than one billion people globally, including 650 million adults, 340 million adolescents, and 39 million children. This figure is still rising. According to WHO, by 2025, about 167 million individuals - adults and children - will be less healthy due to being overweight or obese.

Low-Calorie Food Market Revenue Analysis

Rapid growth in urbanization and shifts in consumer behavior, particularly in emerging nations such as China, India, Brazil, and Mexico, are likely to be important market drivers. The growing retail sector, together with rising consumer disposable income, is expected to have a beneficial impact on the market.

Increasing demand for sugar replacements, along with an aging global population, is expected to drive demand for low-calorie foods during the next six years. Artificial sweeteners and packaged food processed food products, on the other hand, are recognized to pose possible health risks and are projected to hinder the market throughout the projection period.  

MARKET DYNAMICS

KEY DRIVERS

  • A spike in the rates of obesity and other persistent illnesses

Obesity is a major public health concern since it is linked to a variety of chronic illnesses such as type 2 diabetes, heart disease, stroke, and various malignancies. By eating low-calorie foods, people can reduce their risk of getting certain diseases and lose weight. Consumers are becoming more aware of the importance of eating a balanced diet to maintain one's weight and overall health. Low-calorie foods are typically regarded as healthier alternatives to traditional diets.

RESTRAIN

  • Developing health problems as a result of a low-calorie diet

While low-calorie foods can be beneficial for weight loss and other health goals, it is important to consume enough calories to meet your body's needs. Eating too few calories can lead to several health problems, including Fatigue, Nutrient deficiencies, Muscle loss, Constipation, Increased risk of gallstones, Irregular heartbeat, and Eating disorders. Consumers are becoming more aware of the potential health risks associated with low-calorie diets. This is leading some consumers to be more cautious about eating low-calorie foods.

OPPORTUNITY

  • Rising demand in emerging markets for low-calorie foods

In the United States, approximately 35% of adults are considered obese, and within 15 years, this number is expected to reach about 50%. Fast food restaurants have received some of the blame since they frequently sell items that are heavy in calories, fats, sugars, and sodium but poor in vitamins and minerals. While these eateries might be a part of the average American's unhealthy diet, they are not the only culprit. Over 1.5 billion people in East Asia, including China, Japan, and South Korea, are affected by the worldwide health epidemic of obesity. The availability of processed foods and the Westernization of dietary trends following industrialization resulted in an estimated 40.9% overweight/obese prevalence among adults in the Asia-Pacific region, with an estimated economic impact of up to 12% of the total cost of healthcare on obesity or related diseases. As the population ages, this will only intensify.

CHALLENGES

  • High cost of Low-Calorie food

Low-calorie foods might be more expensive to produce than standard foods since they typically require specialized ingredients and manufacturing procedures. This is especially true for new, cutting-edge low-calorie products. Low-calorie foods are usually advertised as high-end items, which drives up prices even further. This is because people are typically willing to spend more for meals that are seen to be healthier.

MARKET SEGMENTATION

by Type

  • Sugar substitutes

  • Sugar alcohol substitutes

  • Nutrient-based substitutes

by Application

  • Dairy products

  • Dietary beverages

  • Healthcare

  • Bakery products

  • Snacks

  • Others

Low-Calorie Food Market Segmentation Analysis

Segmentation Analysis

By Type Analysis

Based on type the low-calorie food market is segmented into sugar substitutes, sugar alcohol substitutes, and nutrient-based substitutes. The sugar substitute segment is expected to witness the highest growth rate in 2022. Low-calorie sugar substitutes are sweeteners that have fewer calories than sugar, or none at all. They are often used to sweeten foods and beverages without adding a lot of calories. Some examples of artificial sweeteners are Aspartame, Stevia, Saccharin, and Sucralose Sugar substitutes offer health-conscious clients benefits such as weight control and diabetes treatment. Artificial sweeteners have no carbs and hence do not raise blood sugar levels. Sugar substitutes have essentially no calories, compared to about 15 calories for a teaspoon of sugar.

By Application Analysis

The application segments include Dietary beverages, Dairy products, Healthcare, Snacks, Bakery products, and Others. The dairy products segment is the fastest-growing segment during the forecast period. Due to the numerous health advantages of dairy-based goods, low-calorie dairy-based products are in high demand. Consumption of dairy products is a key factor in the market's growth because of increased consumer demand for a healthy lifestyle, which has prompted the industry to create low-calorie dairy products.

REGIONAL ANALYSIS

North America has significant market growth for the market. Increasing health-conscious consumers drives the adoption of a healthier lifestyle. The demand for low-calorie food is growing due to an increase in the number of obesity, and cardiovascular diseases due to unhealthy lifestyles. Roughly out of three, two adults are overweight. The low-calorie food market in the United States is expected to be the world's largest.

Europe is the second largest market for the low-calorie food market. People in the United Kingdom and Germany have embraced the vegan or vegetarian diet trend. However, Europe's nutritional trends have paralleled those of many other developed and developing countries, with a shift away from a complex carbohydrate-based diet and toward one high in fat and added sweets. Germany's market was worth USD 1.2 billion in 2022 and increased at a 6.3% CAGR over the predicted period. The country's market development is being driven by rising cases of obesity and diabetes, as well as consumers' growing interest in living a healthy lifestyle.

Asia Pacific region is the fastest growing market as China's low-calorie food market is predicted to reach USD 1.59 billion by 2029, growing at a 6.8% CAGR. China currently has the biggest population of diabetes in the world with over 116 million people. Low-calorie sweeteners are increasingly being positioned as useful products for addressing various lifestyle diseases as a result of this rising popularity, which is helping the market growth in the nation. At a CAGR of 6.5% from 2023 to 2030, the low-calorie food industry in India is anticipated to reach USD 1.18 billion by 2029.

REGIONAL COVERAGE

North America

  • US

  • Canada

  • Mexico

Europe

  • Eastern Europe

    • Poland

    • Romania

    • Hungary

    • Turkey

    • Rest of Eastern Europe

  • Western Europe

    • Germany

    • France

    • UK

    • Italy

    • Spain

    • Netherlands

    • Switzerland

    • Austria

    • Rest of Western Europe

Asia Pacific

  • China

  • India

  • Japan

  • South Korea

  • Vietnam

  • Singapore

  • Australia

  • Rest of Asia Pacific

Middle East & Africa

  • Middle East

    • UAE

    • Egypt

    • Saudi Arabia

    • Qatar

    • Rest of Middle East

  • Africa

    • Nigeria

    • South Africa

    • Rest of Africa

Latin America

  • Brazil

  • Argentina

  • Colombia

  • Rest of Latin America

KEY PLAYERS

Some major key players in the Low-Calorie Food Market are Archer Daniels Midland Company, DSM, Beneo GmbH, Bernard Food Industries, Dansico A/S, The Coca-Cola Company, Tate & Lyle, Ajinomoto Co. Inc, Nestle, Cargill Incorporated, PepsiCo, Ingredion Inc., and other key players.

Archer Daniels Midland Company-Company Financial Analysis

RECENT DEVELOPMENTS

In August 2023, Tate & Lyle company increased its stevia range in response to consumer demand for 'natural' sugar substitutes. Tate & Lyle's Tasteva Sol sweetener is based on stevia, as the ingredients giant attempts to capitalize on the growing demand for sugar substitutes.

In July 2023, Ingredion announced PureCircle Clean Taste Solutions, a product line of stevia solutions suited to specific food & beverage applications. In various categories, including dairy, tea, coffee, drinks, sauces, savory, bakery, confectionery, sports nutrition, and dressings, PureCircle Clean Taste Solutions seeks to decrease sugar and deliver sweetness. For better performance, the new solutions make use of more stevia plant material.

In April 2023, Ingredion released a five-part video series to assist food and beverage makers in utilizing stevia to lower the sugar level of their goods. The series investigates how stevia offers an organic substitute to artificial sweeteners, addressing customer desire for healthier meals and allowing claims such as "plant-based" to be made on product labeling. It also discusses how the discovery of novel steviol glycosides enables a more regulated, sugar-like sweetness with no bitter aftertaste.

Low-Calorie Food Market Report Scope:
Report Attributes Details
Market Size in 2022  US$ 12.5 Billion
Market Size by 2030  US$ 20.37 Billion
CAGR   CAGR of 6.3 % From 2023 to 2030
Base Year 2022
Forecast Period  2023-2030
Historical Data  2019-2021
Report Scope & Coverage Market Size, Segments Analysis, Competitive  Landscape, Regional Analysis, DROC & SWOT Analysis, Forecast Outlook
Key Segments • By Type (Sugar alcohol substitutes, Sugar substitutes, Nutrient-based substitutes)
• By Application (Dietary beverages, Dairy products, Healthcare, Snacks, Bakery products, Others)
Regional Analysis/Coverage North America (US, Canada, Mexico), Europe (Eastern Europe [Poland, Romania, Hungary, Turkey, Rest of Eastern Europe] Western Europe] Germany, France, UK, Italy, Spain, Netherlands, Switzerland, Austria, Rest of Western Europe]), Asia Pacific (China, India, Japan, South Korea, Vietnam, Singapore, Australia, Rest of Asia Pacific), Middle East & Africa (Middle East [UAE, Egypt, Saudi Arabia, Qatar, Rest of Middle East], Africa [Nigeria, South Africa, Rest of Africa], Latin America (Brazil, Argentina, Colombia Rest of Latin America)
Company Profiles Archer Daniels Midland Company, DSM, Beneo GmbH, Bernard Food Industries, Dansico A/S, The Coca-Cola Company, Tate & Lyle, Ajinomoto Co. Inc, Nestle, Cargill Incorporated, PepsiCo, Ingredion Inc.
Key Drivers

• A spike in the rates of obesity and other persistent illnesses

Market Restrain

• Developing health problems as a result of a low-calorie diet


Frequently Asked Questions

Ans: Low-Calorie Food Market is anticipated to expand by 6.3% from 2023 to 2030.

Ans: Restraints are developing health problems as a result of a low-calorie diet.

Ans:  USD 20.37 billion is expected to grow by 2030.

Ans: North America is dominating the Low-Calorie Food Market in 2022.

Ans: Rising demand in emerging markets for low-calorie foods are an opportunity for the growth of the Low-Calorie Food Market.

TABLE OF CONTENT

1. Introduction
1.1 Market Definition
1.2 Scope
1.3 Research Assumptions

2. Research Methodology

3. Market Dynamics
3.1 Drivers
3.2 Restraints
3.3 Opportunities
3.4 Challenges

4. Impact Analysis
4.1 Impact of Russia-Ukraine War
4.2 Impact of Ongoing Recession
4.3. Introduction
4.3.1 Impact on Major Economies
4.3.1.1 US
4.3.1.2 Canada
4.3.1.3 Germany
4.3.1.4 France
4.3.1.5 United Kingdom
4.3.1.6 China
4.3.1.7 Japan
4.3.1.8 South Korea
4.3.1.9 Rest of the World

5. Value Chain Analysis

6. Porter’s 5 forces model

7. PEST Analysis

8. Low-Calorie Food Market Segmentation, By Type
8.1 Sugar substitutes
8.2 Sugar alcohol substitutes
8.3 Nutrient-based substitutes

9. Low-Calorie Food Market Segmentation, By Application
9.1 Dairy products
9.2 Dietary beverages
9.3 Healthcare
9.4 Bakery products
9.5 Snacks
9.6 Others

10. Regional Analysis
10.1 Introduction
10.2 North America
10.2.1 North America Low-Calorie Food Market by Country
10.2.2 North America Low-Calorie Food Market by Type
10.2.3 North America Low-Calorie Food Market by Application
10.2.4 USA
10.2.4.1 USA Low-Calorie Food Market by Type
10.2.4.2 USA Low-Calorie Food Market by Application
10.2.5 Canada
10.2.5.1 Canada Low-Calorie Food Market by Type
10.2.5.2 Canada Low-Calorie Food Market by Application
10.2.6 Mexico
10.2.6.1 Mexico Low-Calorie Food Market by Type
10.2.6.2 Mexico Low-Calorie Food Market by Application
10.3 Europe
10.3.1 Eastern Europe
10.3.1.1 Eastern Europe Low-Calorie Food Market by Country
10.3.1.2 Eastern Europe Low-Calorie Food Market by Type
10.3.1.3 Eastern Europe Low-Calorie Food Market by Application
10.3.1.4 Poland
10.3.1.4.1 Poland Low-Calorie Food Market by Type
10.3.1.4.2 Poland Low-Calorie Food Market by Application
10.3.1.5 Romania
10.3.1.5.1 Romania Low-Calorie Food Market by Type
10.3.1.5.2 Romania Low-Calorie Food Market by Application
10.3.1.6 Hungary
10.3.1.6.1 Hungary Low-Calorie Food Market by Type
10.3.1.6.2 Hungary Low-Calorie Food Market by Application
10.3.1.7 Turkey
10.3.1.7.1 Turkey Low-Calorie Food Market by Type
10.3.1.7.2 Turkey Low-Calorie Food Market by Application
10.3.1.8 Rest of Eastern Europe
10.3.1.8.1 Rest of Eastern Europe Low-Calorie Food Market by Type
10.3.1.8.2 Rest of Eastern Europe Low-Calorie Food Market by Application
10.3.2 Western Europe
10.3.2.1 Western Europe Low-Calorie Food Market by Country
10.3.2.2 Western Europe Low-Calorie Food Market by Type
10.3.2.3 Western Europe Low-Calorie Food Market by Application
10.3.2.4 Germany
10.3.2.4.1 Germany Low-Calorie Food Market by Type
10.3.2.4.2 Germany Low-Calorie Food Market by Application
10.3.2.5 France
10.3.2.5.1 France Low-Calorie Food Market by Type
10.3.2.5.2 France Low-Calorie Food Market by Application
10.3.2.6 UK
10.3.2.6.1 UK Low-Calorie Food Market by Type
10.3.2.6.2 UK Low-Calorie Food Market by Application
10.3.2.7 Italy
10.3.2.7.1 Italy Low-Calorie Food Market by Type
10.3.2.7.2 Italy Low-Calorie Food Market by Application
10.3.2.8 Spain
10.3.2.8.1 Spain Low-Calorie Food Market by Type
10.3.2.8.2 Spain Low-Calorie Food Market by Application
10.3.2.9 Netherlands
10.3.2.9.1 Netherlands Low-Calorie Food Market by Type
10.3.2.9.2 Netherlands Low-Calorie Food Market by Application
10.3.2.10 Switzerland
10.3.2.10.1 Switzerland Low-Calorie Food Market by Type
10.3.2.10.2 Switzerland Low-Calorie Food Market by Application
10.3.2.11 Austria
10.3.2.11.1 Austria Low-Calorie Food Market by Type
10.3.2.11.2 Austria Low-Calorie Food Market by Application
10.3.2.12 Rest of Western Europe
10.3.2.12.1 Rest of Western Europe Low-Calorie Food Market by Type
10.3.2.12.2 Rest of Western Europe Low-Calorie Food Market by Application
10.4 Asia-Pacific
10.4.1 Asia Pacific Low-Calorie Food Market by Country
10.4.2 Asia Pacific Low-Calorie Food Market by Type
10.4.3 Asia Pacific Low-Calorie Food Market by Application
10.4.4 China
10.4.4.1 China Low-Calorie Food Market by Type
10.4.4.2 China Low-Calorie Food Market by Application
10.4.5 India
10.4.5.1 India Low-Calorie Food Market by Type
10.4.5.2 India Low-Calorie Food Market by Application
10.4.6 Japan
10.4.6.1 Japan Low-Calorie Food Market by Type
10.4.6.2 Japan Low-Calorie Food Market by Application
10.4.7 South Korea
10.4.7.1 South Korea Low-Calorie Food Market by Type
10.4.7.2 South Korea Low-Calorie Food Market by Application
10.4.8 Vietnam
10.4.8.1 Vietnam Low-Calorie Food Market by Type
10.4.8.2 Vietnam Low-Calorie Food Market by Application
10.4.9 Singapore
10.4.9.1 Singapore Low-Calorie Food Market by Type
10.4.9.2 Singapore Low-Calorie Food Market by Application
10.4.10 Australia
10.4.10.1 Australia Low-Calorie Food Market by Type
10.4.10.2 Australia Low-Calorie Food Market by Application
10.4.11 Rest of Asia-Pacific
10.4.11.1 Rest of Asia-Pacific Low-Calorie Food Market by Type
10.4.11.2 Rest of Asia-Pacific Low-Calorie Food Market by Application
10.5 Middle East & Africa
10.5.1 Middle East
10.5.1.1 Middle East Low-Calorie Food Market by Country
10.5.1.2 Middle East Low-Calorie Food Market by Type
10.5.1.3 Middle East Low-Calorie Food Market by Application
10.5.1.4 UAE
10.5.1.4.1 UAE Low-Calorie Food Market by Type
10.5.1.4.2 UAE Low-Calorie Food Market by Application
10.5.1.5 Egypt
10.5.1.5.1 Egypt Low-Calorie Food Market by Type
10.5.1.5.2 Egypt Low-Calorie Food Market by Application
10.5.1.6 Saudi Arabia
10.5.1.6.1 Saudi Arabia Low-Calorie Food Market by Type
10.5.1.6.2 Saudi Arabia Low-Calorie Food Market by Application
10.5.1.7 Qatar
10.5.1.7.1 Qatar Low-Calorie Food Market by Type
10.5.1.7.2 Qatar Low-Calorie Food Market by Application
10.5.1.8 Rest of Middle East
10.5.1.8.1 Rest of Middle East Low-Calorie Food Market by Type
10.5.1.8.2 Rest of Middle East Low-Calorie Food Market by Application
10.5.2 Africa
10.5.2.1 Africa Low-Calorie Food Market by Country
10.5.2.2 Africa Low-Calorie Food Market by Type
10.5.2.3 Africa Low-Calorie Food Market by Application
10.5.2.4 Nigeria
10.5.2.4.1 Nigeria Low-Calorie Food Market by Type
10.5.2.4.2 Nigeria Low-Calorie Food Market by Application
10.5.2.5 South Africa
10.5.2.5.1 South Africa Low-Calorie Food Market by Type
10.5.2.5.2 South Africa Low-Calorie Food Market by Application
10.5.2.6 Rest of Africa
10.5.2.6.1 Rest of Africa Low-Calorie Food Market by Type
10.5.2.6.2 Rest of Africa Low-Calorie Food Market by Application
10.6 Latin America
10.6.1 Latin America Low-Calorie Food Market by Country
10.6.2 Latin America Low-Calorie Food Market by Type
10.6.3 Latin America Low-Calorie Food Market by Application
10.6.4 Brazil
10.6.4.1 Brazil Low-Calorie Food Market by Type
10.6.4.2 Brazil Low-Calorie Food Market by Application
10.6.5 Argentina
10.6.5.1 Argentina Low-Calorie Food Market by Type
10.6.5.2 Argentina Low-Calorie Food Market by Application
10.6.6 Colombia
10.6.6.1 Colombia Low-Calorie Food Market by Type
10.6.6.2 Colombia Low-Calorie Food Market by Application
10.6.7 Rest of Latin America
10.6.7.1 Rest of Latin America Low-Calorie Food Market by Type
10.6.7.2 Rest of Latin America Low-Calorie Food Market by Application

11 Company Profile
11.1 Archer Daniels Midland Company
11.1.1 Company Overview
11.1.2 Financials
11.1.3 Product/Services Offered
11.1.4 SWOT Analysis
11.1.5 The SNS View
11.2 Beneo GmbH
11.2.1 Company Overview
11.2.2 Financials
11.2.3 Product/Services Offered
11.2.4 SWOT Analysis
11.2.5 The SNS View
11.3 Bernard Food Industries
11.3.1 Company Overview
11.3.2 Financials
11.3.3 Product/Services Offered
11.3.4 SWOT Analysis
11.3.5 The SNS View
11.4 DSM
11.4 Company Overview
11.4.2 Financials
11.4.3 Product/Services Offered
11.4.4 SWOT Analysis
11.4.5 The SNS View
11.5 Dansico A/S
11.5.1 Company Overview
11.5.2 Financials
11.5.3 Product/Services Offered
11.5.4 SWOT Analysis
11.5.5 The SNS View
11.6 The Coca-Cola Company
11.6.1 Company Overview
11.6.2 Financials
11.6.3 Product/Services Offered
11.6.4 SWOT Analysis
11.6.5 The SNS View
11.7 Tate & Lyle
11.7.1 Company Overview
11.7.2 Financials
11.7.3 Product/Services Offered
11.7.4 SWOT Analysis
11.7.5 The SNS View
11.8 Ajinomoto Co. Inc
11.8.1 Company Overview
11.8.2 Financials
11.8.3 Product/Services Offered
11.8.4 SWOT Analysis
11.8.5 The SNS View
11.9 Nestle
11.9.1 Company Overview
11.9.2 Financials
11.9.3 Product/ Services Offered
11.9.4 SWOT Analysis
11.9.5 The SNS View
11.10 Cargill Incorporated
11.10.1 Company Overview
11.10.2 Financials
11.10.3 Product/Services Offered
11.10.4 SWOT Analysis
11.10.5 The SNS View
11.11 PepsiCo
11.11.1 Company Overview
11.11.2 Financials
11.11.3 Product/Services Offered
11.11.4 SWOT Analysis
11.11.5 The SNS View
11.12 Ingredion Inc.
11.12.1 Company Overview
11.12.2 Financials
11.12.3 Product/Services Offered
11.12.4 SWOT Analysis
11.12.5 The SNS View

12. Competitive Landscape
12.1 Competitive Benchmarking
12.2 Market Share Analysis
12.3 Recent Developments
12.3.1 Industry News
12.3.2 Company News
12.3.3 Mergers & Acquisitions

13. USE Cases and Best Practices

14. Conclusion

An accurate research report requires proper strategizing as well as implementation. There are multiple factors involved in the completion of good and accurate research report and selecting the best methodology to compete the research is the toughest part. Since the research reports we provide play a crucial role in any company’s decision-making process, therefore we at SNS Insider always believe that we should choose the best method which gives us results closer to reality. This allows us to reach at a stage wherein we can provide our clients best and accurate investment to output ratio.

Each report that we prepare takes a timeframe of 350-400 business hours for production. Starting from the selection of titles through a couple of in-depth brain storming session to the final QC process before uploading our titles on our website we dedicate around 350 working hours. The titles are selected based on their current market cap and the foreseen CAGR and growth.


The 5 steps process:

Step 1: Secondary Research:

Secondary Research or Desk Research is as the name suggests is a research process wherein, we collect data through the readily available information. In this process we use various paid and unpaid databases which our team has access to and gather data through the same. This includes examining of listed companies’ annual reports, Journals, SEC filling etc. Apart from this our team has access to various associations across the globe across different industries. Lastly, we have exchange relationships with various university as well as individual libraries.

Secondary Research

Step 2: Primary Research

When we talk about primary research, it is a type of study in which the researchers collect relevant data samples directly, rather than relying on previously collected data.  This type of research is focused on gaining content specific facts that can be sued to solve specific problems. Since the collected data is fresh and first hand therefore it makes the study more accurate and genuine.

We at SNS Insider have divided Primary Research into 2 parts.

Part 1 wherein we interview the KOLs of major players as well as the upcoming ones across various geographic regions. This allows us to have their view over the market scenario and acts as an important tool to come closer to the accurate market numbers. As many as 45 paid and unpaid primary interviews are taken from both the demand and supply side of the industry to make sure we land at an accurate judgement and analysis of the market.

This step involves the triangulation of data wherein our team analyses the interview transcripts, online survey responses and observation of on filed participants. The below mentioned chart should give a better understanding of the part 1 of the primary interview.

Primary Research

Part 2: In this part of primary research the data collected via secondary research and the part 1 of the primary research is validated with the interviews from individual consultants and subject matter experts.

Consultants are those set of people who have at least 12 years of experience and expertise within the industry whereas Subject Matter Experts are those with at least 15 years of experience behind their back within the same space. The data with the help of two main processes i.e., FGDs (Focused Group Discussions) and IDs (Individual Discussions). This gives us a 3rd party nonbiased primary view of the market scenario making it a more dependable one while collation of the data pointers.

Step 3: Data Bank Validation

Once all the information is collected via primary and secondary sources, we run that information for data validation. At our intelligence centre our research heads track a lot of information related to the market which includes the quarterly reports, the daily stock prices, and other relevant information. Our data bank server gets updated every fortnight and that is how the information which we collected using our primary and secondary information is revalidated in real time.

Data Bank Validation

Step 4: QA/QC Process

After all the data collection and validation our team does a final level of quality check and quality assurance to get rid of any unwanted or undesired mistakes. This might include but not limited to getting rid of the any typos, duplication of numbers or missing of any important information. The people involved in this process include technical content writers, research heads and graphics people. Once this process is completed the title gets uploader on our platform for our clients to read it.

Step 5: Final QC/QA Process:

This is the last process and comes when the client has ordered the study. In this process a final QA/QC is done before the study is emailed to the client. Since we believe in giving our clients a good experience of our research studies, therefore, to make sure that we do not lack at our end in any way humanly possible we do a final round of quality check and then dispatch the study to the client.

Start a Conversation

Hi! Click one of our member below to chat on Phone