LPG Vaporizer Market Report Scope & Overview:
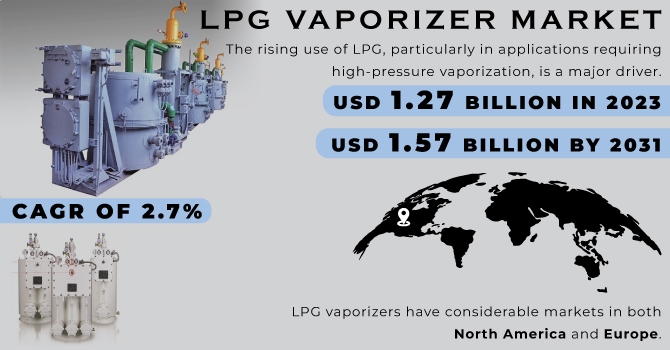
The LPG vaporizer Market Size was valued at USD 1.27 Billion in 2023 and is expected to reach USD 1.57 Billion by 2031 and grow at a CAGR of 2.7% over the forecast period 2024-2031.
The rising use of LPG, particularly in applications requiring high-pressure vaporization, is a major driver. This has spurred investment across the LPG industry, from equipment manufacturing to distribution and marketing. Also, the market outlook remains promising in North America, Europe, and Africa, with developing countries expected to catch up as LPG infrastructure improves. Additionally, technological advancements are increasing product adoption in various sectors.
Get More Information on LPG vaporizer Market - Request Sample Report
High-pressure LPG applications are a key growth area, especially in regions with harsh weather that hinders natural vaporization. These applications include industrial processes and situations where freezing temperatures reduce efficiency. However, the market faces uncertainties like regulatory changes, trade fluctuations, and the potential shift towards natural gas due to environmental concerns.
LPG is passed via a unique kind of coil that is utilised for heat transmission in a water bath vaporizer. This is immersed in a water bath that has electric heating. The LPG liquid input line has a thermally regulated valve installed. It detects the temperature of the water and only permits LPG liquid into the vaporizer when the water reaches 50°C.
MARKET DYNAMICS
KEY DRIVERS:
-
Rising development in natural gas infra structure
-
Growing Environmental Concern and Use of Eco-Friendly Techniques to Cut Carbon Emission
Companies are now looking for green solutions as a result of increased awareness of environmental concerns and the enforcement of strict laws and regulations by regulatory agencies. LPG has recently been utilised to replace petrol and diesel. A clean fuel is LPG. It provides businesses with a cost-effective option.
RESTRAIN:
-
Market growth might be limited by competition from readily available natural gas in some regions.
OPPORTUNITY:
-
Rising Industrialization and urbanisation to give market growth opportunities.
LPG vaporizers have the capacity to deliver LPG at a steady flow rate even in extremely cold regions and to completely use LPG, even at a low pressure in cylinders. Additionally, the usage of LPG in the commercial, agricultural, residential, and power utility sectors in emerging nations contributes to the market's expansion.
CHALLENGES:
-
Companies are now looking for green solutions
IMPACT OF RUSSIA-UKRAINE WAR
Energy-related payments are now exempt from financial sanctions imposed on Russia by the US, EU, UK, and others, which should allow ongoing flows on existing contracts, but a lot of global trade firms are avoiding doing new business with Russia. LPG shipments from the Baltic and Black Seas have steadily decreased as local petrochemical usage increased. From 3.5 MMt/y, Russian seaborne exports were about 1 MMt/y in 2021. Exports were expected to rise to 1.5 MMt/y in 2022 along with increased gas output before the conflict, but the future of that expansion is now questionable. The Baltic Sea accounts for over 75% of Russia's exports of LPG via sea. The Mediterranean and Eastern Europe each receive roughly 30% of it, with two thirds going to Northwest Europe. Due of the tiny total amounts, it looks that Europe will be the region to have the most impact.
IMPACT OF ONGOING RECESSION
A recession would affect the industrial and power production sectors' needs for natural gas. The industrial sector is often capital-intensive and can only quickly adjust to economic disruptions. by making marginal changes to manufacturing, such as shifts worked, personnel, closed plants, and, thus, the quantity of energy used. This industry directly uses natural gas. and indirectly through the use of electricity. over the past eight years, the industrial sector's demand for natural gas has largely decreased, and This pattern would only get worse during a recession. The amount of natural gas used in the power generation industry might change during a recession. by decreasing the need for power in other areas sectors. Throughout much of the nation, natural gas is typically the source of marginal generation, Consequently, the age group most likely to see the immediate impacts of a decline in demand.
KEY MARKET SEGMENTATION
By Product
-
Direct-fired
-
Electric
-
Steam/Water Bath
Direct-fired LPG vaporizer is the fastest growing product segment on account of several advantages associated with the product. The most significant advantage includes the utilization of liquefied gas as the source of energy. Globally, various consumers have prioritized direct-fired vaporizers over others as it results in 100% of the fuel with lower operating costs and higher fuel conversion. Also, it is easy to transport, produces a high amount of heat even in smaller units, has lower rental and maintenance costs, and is safer for unsupervised use.
By Capacity
-
40-160 gal/hr
-
168-455 gal/hr
-
555-1005 gal/hr
-
>1000 gal/hr
LPG vaporizers come in various sizes to suit different needs. Industrial users, like those running peak shaving plants, require high-capacity units to handle large amounts of gas quickly. These vaporizers can convert liquid LPG to vapor at high pressure. The range of capacities available reflects this, with options from smaller units handling 40-160 gallons per hour to massive industrial models that can process over 1000 gallons per hour.
By End Use
-
Industrial
-
Commercial
-
Agriculture
-
Others
The demand for LPG vaporizers is driven by their use in various industries with different pressure needs. Large-scale industries like power plants and peak shaving facilities, alongside commercial operations like hotels and resorts, are all prime users. These applications often require high vaporization rates to handle large volumes of LPG quickly, so high-capacity vaporizers are typically chosen. In essence, the industry and its specific pressure requirements dictate the size and type of vaporizer needed.
REGIONAL ANALYSIS
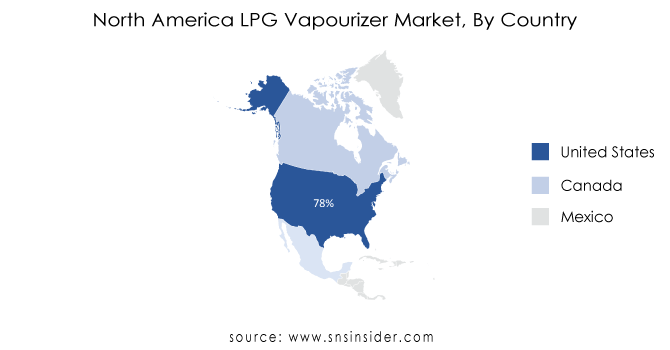
LPG vaporizers have considerable markets in both North America and Europe. The increased use of liquefied petroleum gas and associated equipment in several sectors is a primary driver of these regional markets. Commercial, residential, and industrial uses for LPG vaporizers are the main applications in North America. The majority of industrial firms with an extensive worldwide distribution network are concentrated in this region.
With over 76% of the market share in North America, the United States became the biggest contributor. Italy and the U.K. have made important contributions to regional penetration in Europe. Commercial applications, such as the usage of LPG in hotels, resorts and restaurants, dominate the Europe Liquid Petroleum Gas Vaporizer Market. Distributors are more numerous in Europe than among local producers.
Get Customized Report as per Your Business Requirement - Request For Customized Report
REGIONAL COVERAGE:
North America
-
US
-
Canada
-
Mexico
Europe
-
Eastern Europe
-
Poland
-
Romania
-
Hungary
-
Turkey
-
Rest of Eastern Europe
-
-
Western Europe
-
Germany
-
France
-
UK
-
Italy
-
Spain
-
Netherlands
-
Switzerland
-
Austria
-
Rest of Western Europe
-
Asia Pacific
-
China
-
India
-
Japan
-
South Korea
-
Vietnam
-
Singapore
-
Australia
-
Rest of Asia Pacific
Middle East & Africa
-
Middle East
-
UAE
-
Egypt
-
Saudi Arabia
-
Qatar
-
Rest of Middle East
-
-
Africa
-
Nigeria
-
South Africa
-
Rest of Africa
-
Latin America
-
Brazil
-
Argentina
-
Colombia
-
Rest of Latin America
RECENT DEVELOPMENTS
-
In March 2021, SHV Energy purchased the assets and clients of United Propane and Collins Propane. The corporation gained 15,000 additional customers and boosted its position by making this transaction. This led to SHV Energy expanding, and it made it possible for it to dominate and do well in the Texan market.
KEY PLAYERS
The Major Players are TransTech Energy, SHV Energy, Alternate Energy Systems, Inc., Algas-SDI, Aether DBS, Meeder Equipment Co, Pegoraro Gas Technologies SRL, Maxquip Inc, Standby Systems, Inc., Ransome Manufacturing, Anil Engineering Pvt Ltd, FAS Gmbh Germany, Kagla Vaportech Corporation and other players are listed in a final report.
SHV Energy-Company Financial Analysis
| Report Attributes | Details |
| Market Size in 2023 | US$ 1.27 Bn |
| Market Size by 2031 | US$ 1.57 Bn |
| CAGR | CAGR of 2.7 % From 2024 to 2031 |
| Base Year | 2023 |
| Forecast Period | 2024-2031 |
| Historical Data | 2020-2022 |
| Report Scope & Coverage | Market Size, Segments Analysis, Competitive Landscape, Regional Analysis, DROC & SWOT Analysis, Forecast Outlook |
| Key Segments | • By Product (Direct-fired, Electric, Steam/Water Bath) • By Capacity (40-160 gal/hr, 168-455 gal/hr, 555-1005 gal/hr, >1000 gal/hr) • By End Use (Industrial, Commercial, Agriculture, Others) |
| Regional Analysis/Coverage | North America (US, Canada, Mexico), Europe (Eastern Europe [Poland, Romania, Hungary, Turkey, Rest of Eastern Europe] Western Europe] Germany, France, UK, Italy, Spain, Netherlands, Switzerland, Austria, Rest of Western Europe]). Asia Pacific (China, India, Japan, South Korea, Vietnam, Singapore, Australia, Rest of Asia Pacific), Middle East & Africa (Middle East [UAE, Egypt, Saudi Arabia, Qatar, Rest of Middle East], Africa [Nigeria, South Africa, Rest of Africa], Latin America (Brazil, Argentina, Colombia Rest of Latin America) |
| Company Profiles | TransTech Energy, SHV Energy, Alternate Energy Systems, Inc., Algas-SDI, Aether DBS, Meeder Equipment Co, Pegoraro Gas Technologies SRL, Maxquip Inc, Standby Systems, Inc., Ransome Manufacturing, Anil Engineering Pvt Ltd, FAS Gmbh Germany, Kagla Vaportech Corporation |
| Key Drivers | • Rising development in natural gas infra structure • Growing Environmental Concern and Use of Eco-Friendly Techniques to Cut Carbon Emission |
| Market Restraints | • Market growth might be limited by competition from readily available natural gas in some regions. |
Get in Touch
