Medical Imaging Workstations Market Size Analysis:
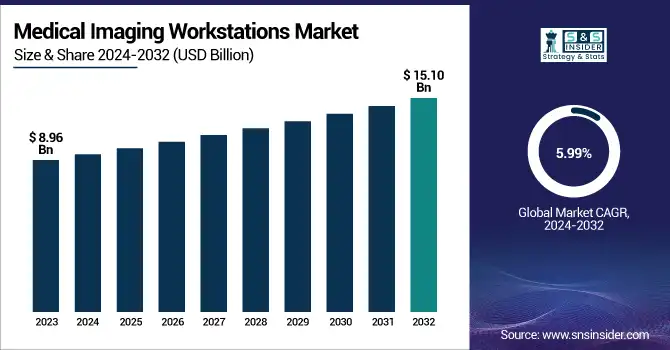
The Medical Imaging Workstations Market size was valued at USD 8.96 Billion in 2023 and is expected to reach USD 15.10 Billion by 2032 and grow at a CAGR of 5.99% over the forecast period 2024-2032.
This report underscores the surge in use of sophisticated imaging technologies, increased demand for effective diagnostic solutions, and the spread of chronic diseases that need to be imaged frequently. Market growth rates, changing consumption behavior, and the incorporation of artificial intelligence in imaging workstations to improve diagnostic accuracy are examined in this study. In addition, it explores demographic factors, including the effect of an aging population and the increasing demand for early disease detection, as well as the trend toward cloud-based and remote-access imaging solutions. The report also explores evolving consumer preferences, with a focus on the need for increased image processing speed, multimodal imaging capabilities, and the influence of telemedicine on workflow optimization and distribution channels.
Bet more information on Medical Imaging Workstations Market - Request Sample Report
Medical Imaging Workstations Market Dynamics
Drivers
-
The rising prevalence of chronic diseases such as cancer, cardiovascular disorders, and neurological conditions, increasing the demand for advanced imaging solutions.
As per the World Health Organization (WHO), cancer rates are predicted to increase by 47% over the 2020-2040 period, and more accurate diagnostic equipment will be required. Rapid deployment of AI-enabled imaging workstations is also driving market expansion, with radiology solutions enabled with AI predicted to enhance diagnostic accuracy by 30% and cut interpretation time. Further, technological improvements in imaging modalities such as 3D and 4D imaging, digital radiography, and hybrid imaging are improving diagnostic effectiveness. The growing trend towards cloud-based imaging solutions and teleradiology is another important driver, which is enabling remote diagnosis and saving costs. Increased healthcare spending and the increasing emphasis on digitization in hospitals and diagnostic centers further drive market growth. The combination of PACS and RIS into imaging workstations is optimizing workflow and enhancing productivity. In addition, government-led initiatives encouraging digital healthcare technology adoption, including the EU's Digital Health Strategy and the U.S. ONC Health IT Program, are pushing market adoption faster. These driving forces in sum contribute to expanding demand for enhanced medical imaging workstations.
Restraints
-
The high cost of advanced imaging systems and limited accessibility in low-income regions.
The cost of AI- integrated imaging workstations can vary from USD 50,000 to more than USD 200,000 and is not economical for smaller health centers. Secondly, there is a scarcity of professionals with skills to run advanced imaging workstations, restricting the adoption process. A report published by the American College of Radiology mentions a shortage of 10-15% of radiologists globally, which affects the efficiency of imaging. Security concerns for data also act as a barrier because cloud-based and AI-powered imaging solutions are susceptible to data breaches and cyberattacks. According to research by CyberMDX, more than 80% of medical imaging equipment is exposed to cyber threats, thus compromising patient data privacy. Regulatory complexities and stringent compliance standards, including FDA approvals, CE marking, and HIPAA compliance, also act as barriers to market entry. The expensive maintenance and software upgrades also contribute to the cost pressure for healthcare providers. Inadequate interoperability among various imaging systems also limits smooth workflow integration. All these aspects retard widespread adoption of medical imaging workstations, particularly in cost-conscious markets.
Opportunities
-
The growing demand for AI-driven diagnostics, cloud-based imaging solutions, and portable imaging workstations presents significant market opportunities.
The medical imaging AI market is anticipated to experience significant growth, with AI-assisted radiology set to enhance abnormality detection rates by 35-40%, increasing diagnostic accuracy. Growth in the adoption of teleradiology presents another opportunity, allowing remote diagnosis in rural and underserved communities. For instance, India's National Digital Health Mission (NDHM) has the goal of enhancing remote healthcare access, making it a supportive market for cloud-based imaging workstations. The growth of point-of-care imaging solutions, especially in emergency and mobile health units, is also fueling demand. Furthermore, the adoption of augmented reality (AR) and virtual reality (VR) in imaging workstations is creating new avenues for surgical planning and medical training. The collaborations between healthcare providers and technology companies, like GE Healthcare's AI-driven imaging partnership with NVIDIA, also reflect the expanding potential in AI-based imaging. The growth in personalized medicine and precision diagnostics, fueled by growth in radiomics and image-based biomarkers, offers additional opportunity for growth. With the steady improvement in deep learning algorithms and cloud-based PACS solutions, the market can expect continued growth and innovation over the coming years.
Challenges
-
The integration of AI with existing healthcare infrastructure, as many hospitals and diagnostic centers still operate on legacy imaging systems that lack AI compatibility.
A Healthcare IT News survey discovered that more than 60% of healthcare organizations have interoperability challenges when implementing new imaging technologies. The second significant challenge is the increasing threat of cybersecurity attacks in cloud-based imaging, with healthcare being one of the top industries to be hit by cyberattacks. As per a Report, the average cost of a data breach in the healthcare industry is now at USD 10.93 million, with data protection becoming a vital issue. On top of this, ethical issues surrounding AI-based imaging remain, such as AI algorithm bias and liability concerns in AI-assisted diagnosis. The time-consuming regulatory approval process for AI-based imaging solutions further lags innovation, as agency approvals from the FDA and European Medicines Agency (EMA) may take years. The steep learning curve and resistance to AI uptake among radiologists also present obstacles, with numerous professionals needing to undergo further training. Last, the environmental footprint and sustainability of high-power imaging workstations, especially energy consumption and e-waste, are long-term challenges for manufacturers.
Medical Imaging Workstations Market Segmentation Analysis
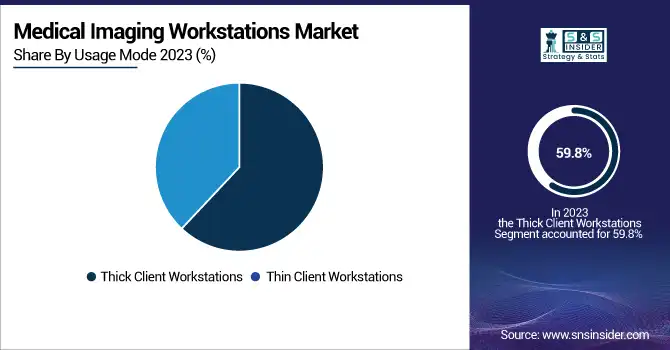
By Usage Mode
The thin client workstations segment led the medical imaging workstations market with a revenue of 59.8% in 2023. They are responsible for this leadership due to their affordability, centralized data processing, and rising use in teleradiology and cloud-based imaging systems. Thin client workstations facilitate easy remote access of imaging data, thus finding favor among large healthcare networks and diagnostic centers.
Conversely, the thick client workstation segment is anticipated to be the fastest growing on account of its faster processing, enhanced image resolution capabilities, and growing need for AI-based imaging solutions. These workstations are especially useful for sophisticated imaging processes such as 3D reconstruction and high-level radiology applications, which are fueling their expansion in specialized diagnostics.
By Application
The advanced imaging segment dominated the market with a revenue share of 55.7% in 2023 due to the increasing demand for high-accuracy imaging modalities like 3D and 4D imaging, AI-based diagnostics, and multi-modality image fusion. The growing incidence of chronic conditions like cancer and cardiovascular diseases has fueled the demand for advanced imaging tools with enhanced diagnostic accuracy.
On the other hand, the conventional imaging segment is likely to be the fastest growing with healthcare institutions in the emerging markets continuing to invest in basic radiology infrastructure. Increasing demand for low-cost imaging solutions, especially in primary healthcare facilities, is driving the growth of traditional imaging workstations.
By Component
The visualization software segment commanded the highest market share of 57.9% in 2023, attributed to the expanding use of AI, machine learning algorithms, and cloud-based imaging platforms. Higher-end visualization products improve diagnostic performance, automate image analysis, and enhance workflow, making them a key part in contemporary imaging workstations.
The hardware segment, instead, will be the growth leader because of ongoing technological innovation in GPUs, high-performance processors, and specialized medical imaging displays. The increased use of 3D imaging, augmented reality (AR), and virtual reality (VR) applications in radiology is also driving the growth for superior workstation hardware.
By Modality
The computed tomography (CT) segment led the market with a 29.3% revenue share in 2023, mostly driven by its common application for diagnosing a variety of conditions, such as cardiovascular ailments, cancer, and traumas. Its growing popularity for high-resolution and multi-slice CT imaging along with the wider use of AI-enabled CT analysis has also strengthened its leadership status.
Conversely, the mammography segment is expected to be the highest-growing since demand for early breast cancer detection continues to increase. Growing awareness initiatives, government screening initiatives, and improvements in digital breast tomosynthesis (DBT) technology are fueling the speedy use of mammography workstations.
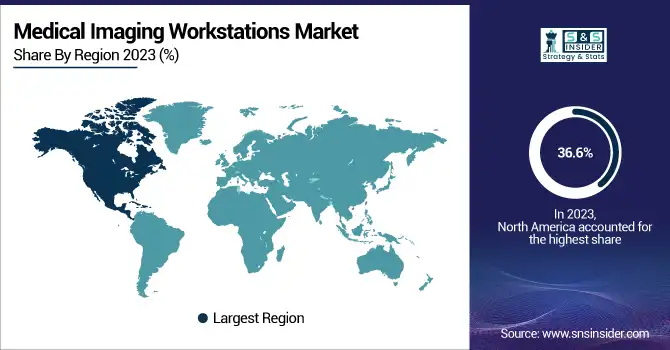
Regional Insights
North America dominated the world medical imaging workstations market with a revenue share of 36.6% in 2023, supported by the region's advanced healthcare infrastructure, high usage of advanced imaging technologies, and mounting demand for AI-enabled imaging solutions. The dominance of prime market players, heavy investments in healthcare IT, and extensive use of Picture Archiving and Communication Systems (PACS) and Radiology Information Systems (RIS) have also bolstered North America's leadership. Growing healthcare needs of an aging population with a higher incidence of chronic illnesses, including cardiovascular diseases and cancer, have bolstered demand for high-performance medical imaging workstations in hospitals, diagnostic centers, and research establishments. Government schemes encouraging the deployment of digital health technologies have driven market growth even further.
On the other hand, the Asia-Pacific market is likely to be the fastest-growing due to the swift growth of healthcare infrastructure, growing investments in diagnostic imaging and radiology, and rising patient numbers. China, India, and Japan are seeing high demand for sophisticated imaging technology, driven by growing awareness, enhanced reimbursement policies, and rising rates of chronic diseases. The transition to cloud-based and AI-enabled imaging solutions, as well as government initiatives to boost diagnostic capabilities in emerging economies, is also propelling market growth in the region.
Get Customized Report as per Your Business Requirement - Enquiry Now
Medical Imaging Workstations Market Key Players
-
Carestream Health
-
Carl Zeiss Meditec AG
-
FUJIFILM Holdings Corporation
-
GE HealthCare
-
Koninklijke Philips N.V.
-
NGI Group
-
Siemens Healthineers AG
-
Planmeca Oy
-
Elekta AB
-
Pro Medicus
Recent Developments
In July 2024, Carestream Health introduced enhancements to its ImageView Software and DRX-Evolution Plus System to improve technologist experience and patient workflow. The ImageView Software v2.1 now includes Smart Room Options such as virtual long-length imaging, virtual collimation, patient-position monitoring, and alignment assist.
| Report Attributes | Details |
| Market Size in 2023 | USD 8.96 billion |
| Market Size by 2032 | USD 15.10 billion |
| CAGR | CAGR of 5.99% From 2024 to 2032 |
| Base Year | 2023 |
| Forecast Period | 2024-2032 |
| Historical Data | 2020-2022 |
| Report Scope & Coverage | Market Size, Segments Analysis, Competitive Landscape, Regional Analysis, DROC & SWOT Analysis, Forecast Outlook |
| Key Segments | • By Usage Mode [Thick Client Workstations, Thin Client Workstations] • By Application [Conventional Imaging, Advanced Imaging] • By Component [Visualization Software, Hardware] • By Modality [Computed Tomography (CT), Magnetic Resonance Imaging (MRI), Ultrasound, Mammography] |
| Regional Analysis/Coverage | North America (US, Canada, Mexico), Europe (Eastern Europe [Poland, Romania, Hungary, Turkey, Rest of Eastern Europe] Western Europe] Germany, France, UK, Italy, Spain, Netherlands, Switzerland, Austria, Rest of Western Europe]), Asia Pacific (China, India, Japan, South Korea, Vietnam, Singapore, Australia, Rest of Asia Pacific), Middle East & Africa (Middle East [UAE, Egypt, Saudi Arabia, Qatar, Rest of Middle East], Africa [Nigeria, South Africa, Rest of Africa], Latin America (Brazil, Argentina, Colombia, Rest of Latin America) |
| Company Profiles | Accuray Incorporated, Canon Medical Systems Corporation, Carestream Health, Carl Zeiss Meditec AG, FUJIFILM Holdings Corporation, GE HealthCare, Koninklijke Philips N.V., NGI Group, Siemens Healthineers AG, Planmeca Oy, Elekta AB, Pro Medicus. |
Get in Touch
