Membrane Switch Market Report Scope & Overview:
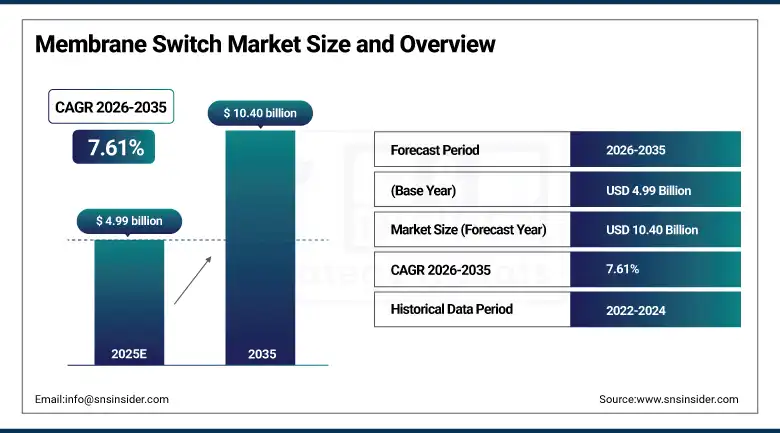
The Membrane Switch Market Size was valued at USD 4.99 billion in 2025 and is expected to reach USD 10.40 billion by 2035, growing at a CAGR of 7.61% from 2026–2035.
The membrane switch market is vital for the functioning of current HMI systems in various industries, including the healthcare industry, automotive industry, commercial sector, and consumer electronics. Membrane switches are used widely in various types of machines that include medical equipment, control panels, diagnostic devices, kitchen appliances, and machines in industrial applications. Because of their light weight, small size, durability, waterproof, and dustproof properties, membrane switches can perform effectively even in harsh environmental conditions. Demand for user-friendly electronics, growth of automation in various industries, and adoption of sophisticated electronics are some major factors that will drive market growth. Technological advancements in printed electronics, tactile sensors, and graphics overlay are adding more functionality to membrane switches. Furthermore, extensive application of membrane switches in the production of healthcare products, vehicles, and automation equipment in industries ensures continued demand for interfaces in all these applications.
In 2025, Phillips Medisize, a Molex company, launched TheraVolt medical connectors designed for next-generation electrophysiology devices requiring compact, high-reliability interfaces and advanced signal handling capabilities. Additionally, Xymox Technologies expanded its focus on custom membrane switches, capacitive keypads, and printed electronic interfaces for aerospace, medical, industrial, and automotive applications.
Market Size and Forecast
-
Market Size 2026E: USD 5.37 Billion
-
Market Size 2035: USD 10.40 billion
-
CAGR (2026-2035): 7.61% CAGR
-
Fastest Growing Region: North America
-
Largest Region: Asia Pacific
To Get more information On Membrane Switch Market - Request Free Sample Report
Membrane Switch Market Trends
-
Capacitive-touch hybrid membrane switches are gaining adoption by combining traditional sealed membrane designs with multitouch and gesture-recognition capabilities.
-
Antimicrobial membrane switch solutions are witnessing increased demand in healthcare and food processing industries due to stricter hygiene and infection-control requirements.
-
Rapid industrialization across emerging economies is expanding demand for cost-effective membrane switch interfaces in industrial control equipment and automation systems.
-
Growing Industry 4.0 adoption is accelerating the installation of automated machinery and HMI panels utilizing durable membrane switch technologies.
-
Replacement of conventional mechanical switch panels with customizable, sealed, and low-maintenance membrane switch interfaces is increasing across industrial, commercial, and consumer electronics applications.
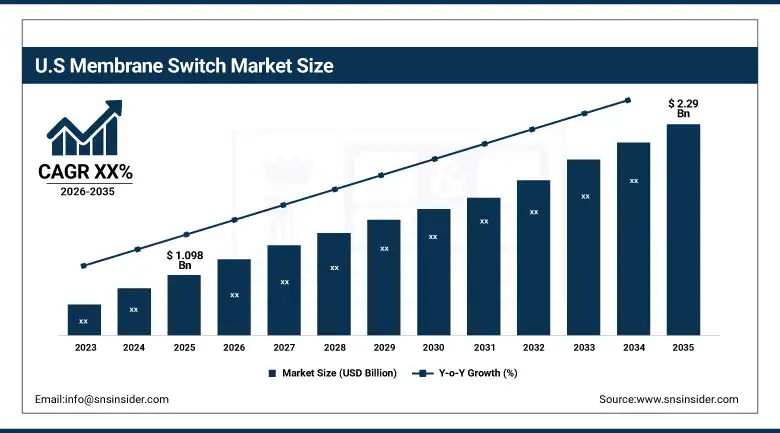
The U.S. Membrane Switch Market Size Outlook:
The U.S. Membrane Switch Market was valued at approximately USD 1.098 billion in 2025 and is expected to reach approximately USD 2.29 billion by 2035. The United States represents the world's most technologically sophisticated membrane switch market, characterised by the highest technical specifications in the medical device, aerospace and defense, and industrial automation sectors that drive demand for premium membrane switch solutions with stringent environmental sealing, EMI shielding, backlighting, and reliability requirements. U.S. defense procurement of ruggedised human-machine interface solutions for military equipment, ground vehicles, and airborne platforms creates a significant premium membrane switch demand channel where interface reliability under extreme environmental conditions justifies the highest specification and pricing tier in the market.
Molex's launch of polyester membrane switch overlays reducing bacterial load by 99% and alignment with FDA infection control guidelines, combined with Xymox's rigid-flex PCB membrane switch designs meeting complex aerospace lighting requirements, exemplify the premium innovation at the U.S. market's technology frontier where validated antimicrobial performance and aerospace-certified construction capabilities command the highest membrane switch product pricing globally.
Membrane Switch Market Segment Highlights
-
According to Type, Tactile Membrane Switches dominated with approximately 59.30% market share in 2025; PCB-Backed Membrane Switches are the fastest-growing type at a CAGR of approximately 7.84% from 2026 to 2035.
-
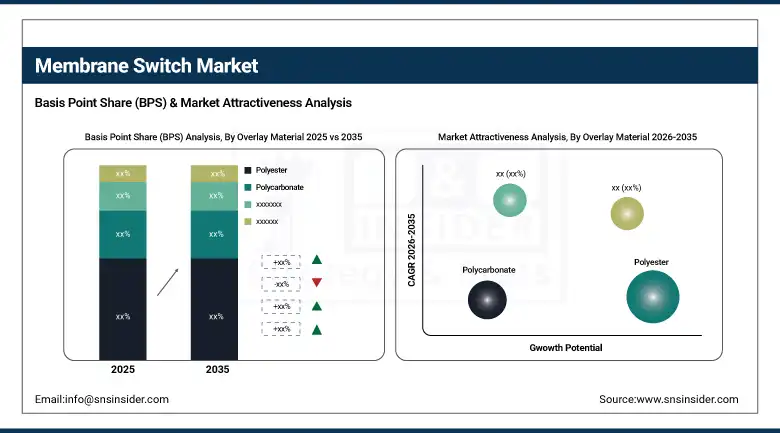
In terms of Overlay Material, Polyester dominated with approximately 53.8% market share in 2025; Polycarbonate is the fastest-growing material at approximately 7.74% CAGR.
-
By Application, Industrial and Manufacturing dominated as the largest application segment; Medical and Healthcare is the fastest-growing application segment driven by expanding diagnostic equipment, patient monitoring, and surgical instrument membrane switch demand.
By Type, tactile membrane switches dominate, pcb-backed grows fastest
Tactile Membrane Switches maintained their leadership as the type leader in the Membrane Switch market in 2025 with about 59.30% of market share on account of the underlying commercial bias towards operator-input interface types that ensure tangible proof of activation through the signature click of metal snap domes or polyester dome deflection under operator force.
PCB Membrane Switches are the fastest growing membrane switch types at about 7.84% CAGR to 2035 based on growing sophistication of electronic interface control needs in aerospace cockpit panels, medical diagnostic devices, high-end industrial machinery, among others, where the PCB substrate design facilitates advanced electric routing capabilities, surface mount and through hole connection options and multi-layer circuits which are not possible with only flex circuit membranes.
By Overlay Material, polyester dominates, polycarbonate grows fastest
Polyester remained the leading overlay material type due to the excellent performance characteristics of this substance including chemical resistance, mechanical strength, dimensional stability in case of temperature changes, cleanliness, and affordability which enable polyester to be used as a preferred overlay material in the vast majority of industrial, medical, food processing, and military membrane switches.
The polycarbonate overlay material experienced the most significant growth rate among other materials with approximately 7.74% CAGR until 2035 due to the increasing demand on behalf of OEM companies for membrane switches with the overlay made of polycarbonate which combines such characteristics as optical translucency to enable the illumination of icons; fire-resistant UL 94 rating for safety-related applications in aviation and industry, impact resistance to withstand mechanical stress, and glossiness typical for premium consumer electronics and automobiles.
By Application, industrial and manufacturing dominates, medical and healthcare grows fastest
Membrane switches maintained their position as the leading application in the Membrane Switch Market due to the vast global installed base of industrial manufacturing machines, including CNC machine tools, process control systems, packaging machines, material handling systems, and other types of industrial automation equipment requiring membrane switch control panels because of their superior environmental sealing, durability, and cost-effective features. Industrial membrane switches have to operate reliably under constant contact with cutting fluids, lubricants, cleaning chemicals, metal chips, and dust during millions of operations throughout the life span of 10 to 20 years of the equipment service.
The Medical & Healthcare application is expected to be the most rapidly growing segment of the market until 2035 due to a steady growth of global medical devices industry and significant role of membrane switches in diagnostic equipment, patient monitoring systems, infusion pumps, surgical instruments, and medical equipment in general, which requires reliable and cleanable operator interfaces with anti-microbial and electrically reliable characteristics.
Regional Insights
|
Region |
Major Country |
Share within Region, 2025 (%) |
|---|---|---|
|
North America |
United States |
76% |
|
Europe |
Germany |
34% |
|
Asia Pacific |
China |
49% |
|
Middle East & Africa |
UAE |
27% |
|
Latin America |
Brazil |
43% |
North America Membrane Switch Market Insights
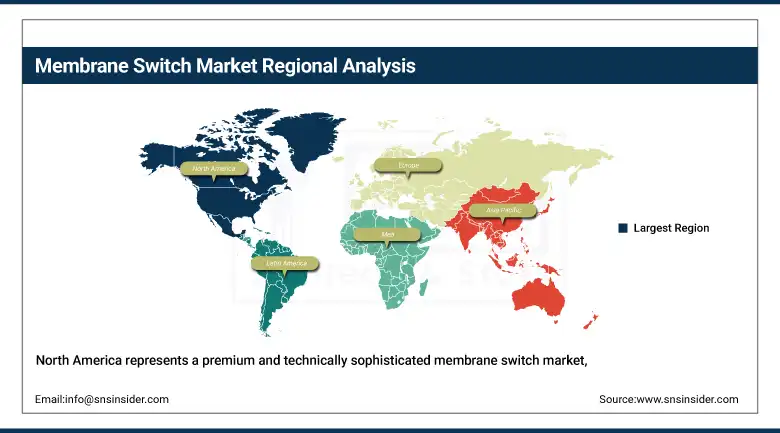
North America represents a premium and technically sophisticated membrane switch market, anchored by the United States which accounted for approximately 76% of North American revenues in 2025, driven by strong demand from the world's largest medical device, aerospace and defense, and industrial automation sectors. U.S. membrane switch manufacturers including Molex, Xymox, Nelson-Miller, and Epec Engineered Technologies serve domestic OEMs with the most technically demanding specifications in the global market, commanding premium pricing for antimicrobial medical switches, aerospace-certified PCB-backed panels, and military-qualified ruggedised interface assemblies. IPC's confirmation that electronic interface solution exports rose 4.2% in 2024 confirms the U.S. membrane switch industry's global competitiveness.
Get Customized Report as per Your Business Requirement - Enquiry Now
Europe Membrane Switch Market Insights
Europe is a significant and growing membrane switch market, driven by Germany's world-leading automotive and machine tool industries that specify membrane switches across vehicle interior controls and industrial machine operator panels, combined with European medical device manufacturing in Germany, Switzerland, and the Netherlands that drives demand for premium medical-grade membrane switch solutions. European membrane switch demand is shaped by strict RoHS compliance requirements that have driven the transition to lead-free, halogen-free materials across all product categories, creating a market where technical compliance and material sustainability are as important as cost and performance in supplier selection decisions.
Asia Pacific Membrane Switch Market Insights
Asia Pacific represents the largest regional membrane switch market by revenues in 2025, driven by China's enormous consumer electronics manufacturing industry specifying membrane switches in home appliances, kitchen equipment, and consumer electronic control panels, combined with Japan's advanced industrial equipment and automotive sectors, South Korea's electronics manufacturing industry, and rapidly growing industrial automation investment across Southeast Asia. China's dominant position as the world's largest producer of membrane-switch-interfaced consumer electronics creates the highest regional membrane switch consumption volume, while the manufacturing cost advantages of Chinese membrane switch producers are enabling competitive pricing that sustains Asia Pacific's revenue leadership through the forecast period.
Latin America and MEA Membrane Switch Market Insights
Latin America and MEA are growing membrane switch markets driven by industrial equipment adoption, food processing industry expansion, and medical device market development. Brazil leads Latin American revenues at approximately 43% through its large industrial machinery, food processing, and consumer electronics sectors that drive membrane switch adoption. MEA adoption is anchored by UAE and Saudi Arabia's growing industrial and medical equipment sectors, and South Africa's manufacturing industry that specifies membrane switches in mining, food processing, and agricultural equipment control panels.
Market Dynamics
Growth Drivers: Expanding industrial automation, growing medical device complexity, and industrial equipment modernisation driving broad-based membrane switch demand across global end-use sectors
The primary structural growth drivers for the membrane switch market are the continuing expansion of global industrial automation investment that installs new production equipment requiring membrane switch control interfaces, the growing complexity and proliferation of medical devices requiring sealed, cleanable, antimicrobial operator interfaces, and the technology upgrade cycle across existing industrial, commercial, and consumer equipment that replaces legacy mechanical switch panels with modern membrane switch interfaces offering superior environmental sealing, graphic customisation, and total cost of ownership. The global Industry 4.0 transformation of manufacturing operations is installing new automated production systems across every industrial category, each requiring membrane switch-interfaced human-machine interface panels that provide operators with sealed, reliable control access to automated equipment.
IPC's documentation of 4.2% growth in electronic interface solution exports in 2024, combined with Molex's continued investment in antimicrobial polyester overlay formulations for medical applications and Xymox's rigid-flex PCB switch development for aerospace cockpit panel applications, confirm that the membrane switch market's established technology base is simultaneously expanding into new premium applications through material and construction.
Restraints: Competition from touchscreen and capacitive interface technologies in premium consumer applications, limited suitability for complex graphical interface requirements, and pressure from lower-cost alternative switch technologies
A significant restraint on the membrane switch market is the increasing penetration of touchscreen and capacitive touch panel technologies in consumer electronics, high-end medical equipment, and premium automotive interiors where the graphical user interface richness, software updateability, and multitouch capability of display-integrated touchscreens create compelling advantages over membrane switch's fixed-key interface architecture. While membrane switches retain decisive advantages in harsh environment applications where touchscreen durability, gloved-hand operation, and sealed construction are critical, the continuing improvement in touchscreen environmental sealing and reduced touchscreen manufacturing costs is progressively expanding the application range where touchscreens become cost-competitive with membrane switches. The sensitivity of membrane switch conductive silver ink circuits to repeated flexing over millions of actuations creates a reliability limitation in applications with very high cycle frequency that requires careful application engineering.
Opportunities: Capacitive hybrid membrane switches, antimicrobial healthcare applications, and emerging market industrial equipment demand
The development of capacitive-touch hybrid membrane switch products that combine the environmental sealing and cost advantages of traditional membrane switch construction with capacitive sensing capability enabling multitouch input, gesture recognition, and software-configurable key assignment represents a compelling product evolution that retains membrane switches' competitive advantages in harsh environments while closing the functional capability gap with touchscreens in industrial and medical applications. Antimicrobial membrane switch products for healthcare and food processing applications, validated to reduce pathogen contamination on frequently-touched control surfaces, represent a premium market segment where demonstrable infection control performance justifies significant pricing premiums relative to standard membrane switches. The industrialisation of emerging economies across Southeast Asia, Latin America, and Sub-Saharan Africa is creating growing demand for industrial control equipment specifying membrane switch interfaces, expanding the addressable market for cost-competitive membrane switch manufacturers.
Recent Developments:
-
2025: Molex expanded its membrane switch portfolio with enhanced antimicrobial polyester overlay formulations achieving 99% bacterial load reduction, aligning with FDA infection control guidelines for medical equipment and food processing facility control surface specifications.
-
2025: Xymox Technologies introduced rigid-flex PCB membrane switches meeting complex aerospace cockpit panel lighting requirements, enabling integrated multilayer circuit and LED backlighting in a single assembly for next-generation aircraft avionics interface panels.
Membrane Switch Companies are:
-
Xymox Technologies Inc.
-
Nelson-Miller Inc.
-
Epec Engineered Technologies
-
SCHURTER Holding AG
-
Esterline Technologies Corporation
-
Human E&C Co. Ltd.
-
Douglas Corporation
-
Hutson Industries Inc.
-
ECI Screenprint Inc.
-
Butler Technologies Inc.
-
KEE Group
-
Quad Industries NV
-
Fieldtech Avionics & Instruments Ltd.
-
W3 Global Co. Ltd.
-
Southern Imperial LLC
-
Fujikura Ltd.
-
Lustre-Cal Corporation
-
Shenzhen Carling Technology Co. Ltd.
Membrane Switch Market Report Scope
| Report Attributes | Details |
|---|---|
| Market Size in 2025 | USD 4.99 Billion |
| Market Size by 2035 | USD 10.40 Billion |
| CAGR | CAGR of 7.61% From 2026 to 2035 |
| Base Year | 2025 |
| Forecast Period | 2026-2035 |
| Historical Data | 2022-2024 |
| Report Scope & Coverage | Market Size, Segments Analysis, Competitive Landscape, Regional Analysis, DROC & SWOT Analysis, Forecast Outlook |
| Key Segments | • By Type (Tactile Membrane Switches, Non-Tactile Membrane Switches, PCB-Backed Membrane Switches) • By Overlay Material (Polyester, Polycarbonate, Others) • By Application (Industrial and Manufacturing, Medical and Healthcare, Consumer Electronics, Automotive, Aerospace and Defense, Others) |
| Regional Analysis/Coverage | North America (US, Canada), Europe (Germany, UK, France, Italy, Spain, Russia, Poland, Rest of Europe), Asia Pacific (China, India, Japan, South Korea, Australia, ASEAN Countries, Rest of Asia Pacific), Middle East & Africa (UAE, Saudi Arabia, Qatar, South Africa, Rest of Middle East & Africa), Latin America (Brazil, Argentina, Mexico, Colombia, Rest of Latin America). |
| Company Profiles | Molex LLC; Xymox Technologies Inc.; Nelson-Miller Inc.; Epec Engineered Technologies; SCHURTER Holding AG; DynaGraphics Inc.; Esterline Technologies Corporation; Human E&C Co. Ltd.; Douglas Corporation; Hutson Industries Inc.; ECI Screenprint Inc.; Butler Technologies Inc.; KEE Group; Quad Industries NV; Fieldtech Avionics & Instruments Ltd.; W3 Global Co. Ltd.; Southern Imperial LLC; Fujikura Ltd.; Lustre-Cal Corporation; Shenzhen Carling Technology Co. Ltd. |
Frequently Asked Questions
Ans: Medical and Healthcare is the fastest-growing application segment through 2035, driven by the expanding global medical device market requiring sealed, cleanable, antimicrobial, and electrically reliable operator interfaces across diagnostic equipment, patient monitoring, infusion pumps, and surgical instruments that must satisfy FDA, CE, and ISO 13485 quality requirements while maintaining clinical environment cleanability.
Ans: Polycarbonate is the fastest-growing overlay material at approximately 7.74% CAGR through 2035, driven by OEM demand for fire-retardant optical clarity enabling backlit icon illumination, superior impact resistance, and high-gloss aesthetic quality in aerospace cockpit panels, premium consumer appliances, and automotive interior control applications where visual clarity and UL certification are design requirements.
Ans: Tactile Membrane Switches dominated with approximately 59.30% of revenues in 2024, driven by the fundamental commercial preference for operator interfaces providing positive physical confirmation of successful switch actuation through dome deflection feedback that is critical in regulated industrial operations, medical device use, and safety equipment where unconfirmed actuation could have serious operational consequences.
Ans: The Membrane Switch Market was valued at USD 4.993 billion in 2025.
Ans: The Membrane Switch Market is expected to grow at a CAGR of 7.61% from 2026 to 2035.
Get in Touch
