Methionine Market Report Scope & Overview:
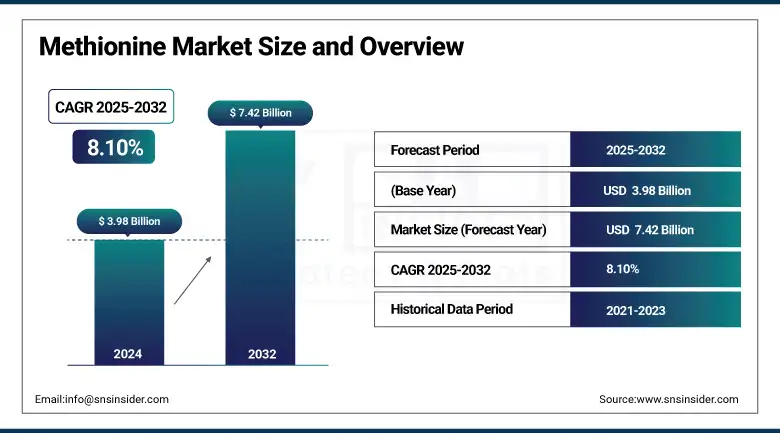
The Methionine Market size was valued at USD 3.98 billion in 2024 and is expected to reach USD 7.42 billion by 2032, growing at a CAGR of 8.10% over the forecast period of 2025-2032.
As methionine is an essential compound of human health, the methionine market analysis highlights that the demand for methionine for pharmaceutical and nutraceutical applications is increasing. Methionine, an essential amino acid, is important for liver function, detoxification, and the production of molecules such as glutathione. Owing to its natural antioxidant and anti-inflammatory properties, it has now become a key component of several dietary supplements used to improve metabolic health, joint health, and boost immunity, too. Additionally, increasing consumer attention on preventive healthcare and nutritional supplements is further propelling the growth of the market. Methionine is employed in the pharmaceutical industry for liver disease formulations and acetaminophen poison treatments, which drive the methionine market growth.
To Get more information On Methionine Market - Request Free Sample Report
In March 2024, Novus International acquired BioResource International (BRI), including its facilities in North Carolina, to strengthen its capabilities in enzymes and bio-based methionine production.
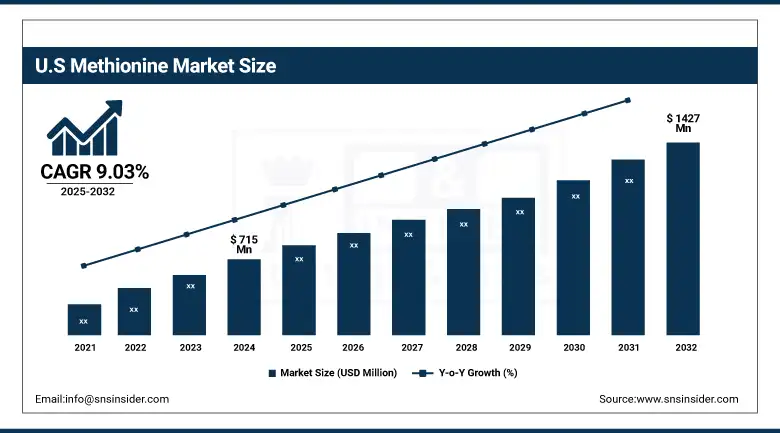
The U.S. methionine market size was USD 715 million in 2024 and is expected to reach USD 1427 million by 2032 and grow at a CAGR of 9.03% over the forecast period of 2025-2032. Owing to its presence in animal nutrition and human health. In the U.S., the demand for methionine to improve feed efficiency, the growth of livestock and poultry, and the quality of protein is particularly high, as the country is one of the world leaders in poultry and livestock production and consumption. In addition, the sophisticated feed milling infrastructure and stringent regulatory framework of the country promote precision nutrition with the use of key amino acids such as methionine. Besides animal feed, methionine is commonly used in the expanding dietary supplements market due to the rise of health-conscious populations and increasing spending on preventive healthcare.
Methionine Market Drivers
-
Rising Demand for Animal Protein Globally Drives the Market Growth
Methionine demand is primarily driven by the global increase in meat, poultry, and dairy consumption. With the continuing expansion of population and dietary habits evolving towards more protein, especially in Asia-Pacific and Latin America, livestock producers are investing in feed efficiency and animal performance. Methionine is an important amino acid for poultry and swine, providing improved growth rate, immune defence, and digestibility. It contributes to the reduction of the total crude protein requirement in feed and, consequently, to its devaluation and waste in the environment. This would be quite important in some areas where animal farming is pushed to extreme practices.
For instance, the Food and Agriculture Organization (FAO) predicted more than 145 million metric tons in global production of poultry meat by 2032, creating a lucrative demand for methionine feed.
Methionine Market Restrain
-
Stringent Environmental Regulations and Cost May Hamper the Market Growth
Methionine production is highly regulated, both for potential emissions and waste generation from hydrochemical synthesis and high energy and material input for microbially fermented methionine. Regulatory bodies like the U.S. Environmental Protection Agency (EPA) and the European Chemicals Agency (ECHA) are strict when it comes to compliance with standards relating to environmental performance and workplace safety, specifically in amino acid and specialty chemical plants. Compliance raises production costs and requires further investment in effluent treatment, air quality measurement, and safe storage. In addition to that, fluctuating costs of raw materials such as methanethiol and acrolein break cost predictability and prove to be a challenge to the profits of SMEs.
Methionine Market Opportunities
-
Sustainable Production Through Bio-Based Fermentation Technologies Create an Opportunity in the Market
As global sustainability targets tighten, this has come with an industry-wide shift towards bio-based and low-emission methionine. Microbes and fermentation decrease carbon footprint, save energy and lessen the need for petrochemical feedstocks. Such methods are in alignment with the Environmental, Social, and Governance (ESG) mandates and allow companies to qualify for green funding and incentives. Enabling clean chemical manufacturing through governmental funding, research, and regulatory frameworks to minimize the carbon footprint of the chemical industry, which drives the methionine market trends.
For instance, the U.S. Inflation Reduction Act of 2022 dedicated USD 369 billion for energy security and climate change programs, including for green manufacturing and bioprocessing innovation, which can create a favorable atmosphere for bio-based methionine technology.
Methionine Market Segmentation Analysis:
By Source
Plant-based held the largest methionine market share, around 72.56%, in 2024. It is owing to the rising need for sustainable and non-animal-derived feed and amino acid supplement alternatives. With consumer preference to source products that are ethically fortified and environmentally friendly, particularly in North America and Europe, plant-based methionine is increasingly finding acceptance with livestock producers and nutraceutical companies. It provides a clean-label alternative for animal feed, particularly in poultry and aquaculture, while also resonating with increasing regulatory pressure to minimize the environmental impact of animal farming.
Animal-based held a significant methionine market share. It is due to its long deployment in traditional animal nutrition practices. This methionine, based on natural animal proteins, is essential for the synthesis of protein in livestock and poultry feed and improves the performance and immune function of livestock and poultry in the growth stage. Animal-derived methionine remains a firm favorite in specific markets due to long-established supply chains, competitive pricing, and demonstrated nutritional performance, despite growing interest in plant-based and bio-fermented alternatives. In contrast, animal-based sources are still an integral part of feed formulations in both developing markets, where regulatory restrictions are more blurred and cost sensitivity is higher, and developed markets, which support their market growth.
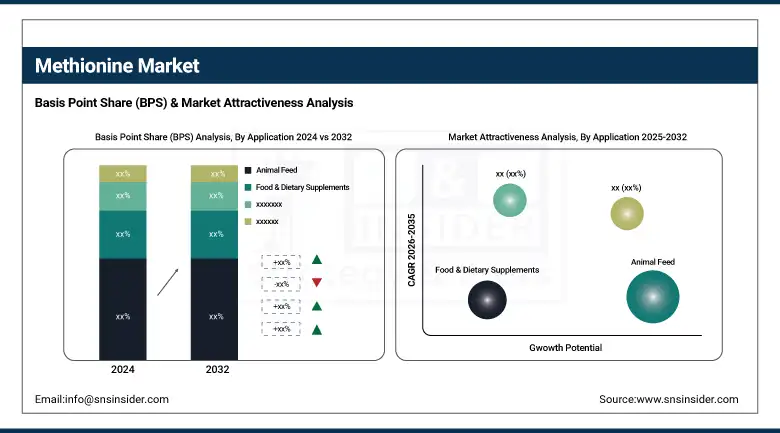
By Application
Animal Feed segment held the largest market share, around 58%, in 2024. This is largely attributed to the necessity of methionine for improving livestock productivity and the efficiency of animal feed additives. Methionine is an important amino acid in the diets of poultry, swine, and aquaculture species, as it plays an important role in growth, supporting an optimal immune system, and for better feed conversion ratios. As worldwide demand for meat and dairy products escalates, feed producers are adding more methionine to fulfill the dietary requirements of these intensively reared livestock. Moreover, increasing concern regarding animal health and sustainable farming practices is resulting in the use of precise feed formulations, thereby increasing the demand for methionine in this segment.
Food & dietary supplements hold a significant market share in the methionine market. It is due to its essential role in metabolism, liver detoxification, and antioxidant defense, methionine is widely used in functional foods and dietary supplements. This has made it an attractive ingredient for products aimed at overall liver health, skin and hair health, and wellness in general, especially in aging populations and among health-conscious consumers. In recent years, the increasing number of people switching to vegetarian and vegan diets is fuelling the demand for essential amino acid fortification to fill the gaps that methionine helps. Moreover, the increasing nutraceutical market and favourable regulation for amino acid-based health products have further entrenched the place of methionine in this expanding application area.
Methionine Market Regional Outlook:
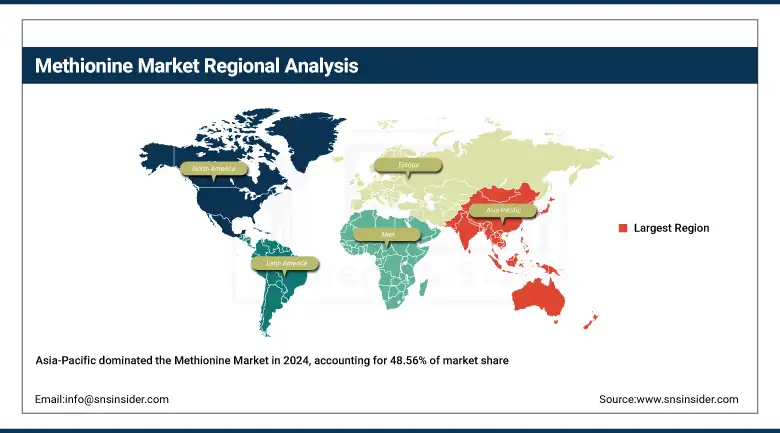
Asia-Pacific methionine market held the largest market share, around 48.56%, in 2024. It is due to the strong livestock and aquaculture industries in this region, including China, India, Vietnam, and Indonesia. As the largest poultry and seafood producer and consumer in the world, large quantities of methionine are essential to maintain optimal animal growth, feed efficiency, and disease resistance. The growth in animal protein consumption has been encouraged by rapid urbanization, population increase, and wealth growth, which has bolstered the use of methionine in feed formulations. Furthermore, significant methionine production facilities are located in Asia-Pacific, where low-cost raw material availability and inexpensive labor are also present. Backing from the government for improving food security and modernizing the animal sector also supports the region in maintaining its dominant market position.
Get Customized Report as per Your Business Requirement - Enquiry Now
North America methionine market held a significant market share and is the fastest-growing segment in the forecast period. It is due to well-established livestock and poultry industries in the region, particularly the U.S. Strong demand for feed formulations owing to the importance given by the region, in terms of efficient animal nutrition, quality standards of meat production, and regulation, has led to the significant growth of the methionine market in the region. Another factor that has expanded its application is the surge in utilization of methionine in nutraceuticals & dietary supplements, which is majorly driven by rising health consciousness & aging population. Increased methionine demand owing to its successful use as a feed supplement, along with technology development and more investment into sustainable, bio-based methionine production, has further driven industrial expansion.
Europe held a significant market share in the forecast period. It is owing to its developed animal husbandry system, tough laws regarding nutritional boundaries, and rising attention towards sustainable farming in the region. Demand for methionine in poultry and swine feed is robust, particularly in countries with high meat production standards (Germany, France, and Netherlands) that require specific feed formulations to optimize animal health and performance. Furthermore, low feed conversion associated with the use of methionine allows for reduced nitrogen pollution, which is especially welcomed in Europe, where environmental and animal welfare regulations are stringent. The region has an increasing demand for nutraceuticals owing to the rise of the aging population and rising interest in amino acid-based supplements.
Methionine Market Companies are:
The major Methionine companies are Evonik Industries AG, Adisseo, CJ CheilJedang Corp., Novus International, Sumitomo Chemical Co., Ltd., Meihua Holdings Group Co., Ltd., Bluestar Adisseo Company, Chongqing Unisplendour Chemical Co., Ltd., Phibro Animal Health Corporation, and Prinova Group LLC.
Recent Development:
-
In 2024, Evonik also completed the expansion of its production plant for the amino acid DL-methionine on Jurong Island in Singapore, increasing its annual capacity for the production of DL-methionine by 40,000metrictons (now 340,000t/y). Cooperatively with Linde, added green hydrogen to the upgrade, reducing 6% of the product carbon footprint.
-
In 2024, Novus International purchased BioResource International (BRI) along with the North Carolina facilities. According to the company, the acquisition expands Novus's enzyme portfolio and strengthens its bio-based methionine offerings in the United States.
| Report Attributes | Details |
|---|---|
| Market Size in 2024 | USD 3.98 Billion |
| Market Size by 2032 | USD 7.42 Billion |
| CAGR | CAGR of8.10% From 2025 to 2032 |
| Base Year | 2024 |
| Forecast Period | 2025-2032 |
| Historical Data | 2021-2023 |
| Report Scope & Coverage | Market Size, Segments Analysis, Competitive Landscape, Regional Analysis, DROC & SWOT Analysis, Forecast Outlook |
| Key Segments | •By Source (Plant Based,and Animal Based) • By Application (Animal Feed, Food & Dietary Supplements, Pharmaceuticals, and Others) |
| Regional Analysis/Coverage | North America (US, Canada, Mexico), Europe (Germany, France, UK, Italy, Spain, Poland, Turkey, Rest of Europe), Asia Pacific (China, India, Japan, South Korea, Singapore, Australia, Rest of Asia Pacific), Middle East & Africa (UAE, Saudi Arabia, Qatar, South Africa, Rest of Middle East & Africa), Latin America (Brazil, Argentina, Rest of Latin America) |
| Company Profiles | Evonik Industries AG, Adisseo, CJ CheilJedang Corp., Novus International, Sumitomo Chemical Co., Ltd., Meihua Holdings Group Co., Ltd., Bluestar Adisseo Company, Chongqing Unisplendour Chemical Co., Ltd., Phibro Animal Health Corporation, Prinova Group LLC |
Frequently Asked Questions
Asia Pacific held the largest market share in the methionine market.
Evonik Industries, Adisseo, Novus International, CJ CheilJedang, Sumitomo Chemical, Ajinomoto, Phibro Animal Health, Kemin Industries, Kyowa Hakko Bio, and DSM.
The DL-methionine segment is performing strongly in the market, holding the largest share due to its cost-efficiency, thermal stability, and extensive use in animal feed formulations. Its ability to meet nutritional requirements across various livestock types makes it the preferred form of methionine globally.
The primary industries driving demand for methionine are animal feed, pharmaceuticals, and dietary supplements.
The Methionine Market was valued at USD 3.98 billion in 2024.
Get in Touch
