Multi-Cuvette Spectrophotometer Market Report Scope & Overview:
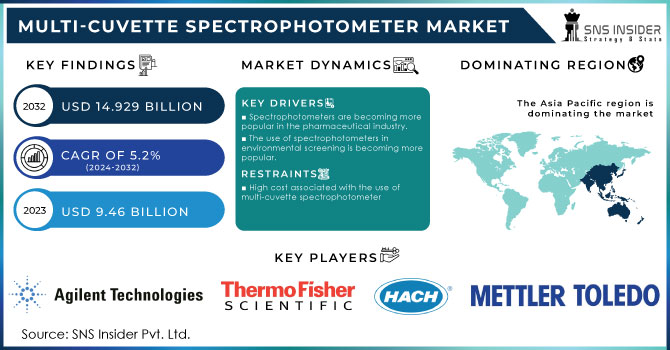
Multi-Cuvette Spectrophotometer Market was valued at USD 8.85 billion in 2023 and is expected to reach USD 14.87 billion by 2032, growing at a CAGR of 5.98% from 2024-2032. This report gives information about the market in key areas, such as supply chain and distribution channels, investment and funding opportunities, regulatory impact, consumer behavior trends, and performance metrics. It focuses on the increasing trend of advanced spectrophotometer technology in the pharmaceutical, biotechnology, and environmental testing sectors, with emphasis on innovations driving the market to grow and meet regulatory requirements for precise analysis.
Get more information on the Multi-Cuvette Spectrophotometer Market - Request Sample Report
Multi-Cuvette Spectrophotometer Market Dynamics
Drivers
-
Technological Advancements in Precision, Automation, and Multi-Cuvette Functionality are Key Growth Factors in the Multi-Cuvette Spectrophotometer Market
Innovations in analytical technology are changing the pace of the Multi-Cuvette Spectrophotometer market through significant boosts in measurement precision, automation, and functionality. Technological advancements in sensor technologies, for example, enhance the accuracy and reliability of the data acquired, increasing the effectiveness of spectrophotometric measurements. Incorporation of automation features speeds up processes and reduces human error, thereby ensuring consistent results across high-throughput applications. Moreover, the ability to use multiple cuvettes simultaneously increases efficiency, making these instruments indispensable for laboratories and industries requiring large-scale testing. These technologies have fulfilled the needs of highly advanced analytical solutions for sectors including pharmaceuticals, biotechnology, and environmental testing and thus became unavoidable tools in the hands of research, quality control, and process monitoring units.
Restraints
-
Expensive Maintenance and Calibration Efforts Drive Organizations away from Multi-Cuvette Spectrophotometer Use
In many cases, multi-cuvette spectrophotometers will demand significant investments into ongoing maintenance and calibration costs that would sum up the expenses in the end to be substantial for any budgetary restrained organizations. It also means that frequent calibration is a necessity to provide reliable and accurate results, though professional services or specific training may be required in this process, increasing operational costs. Moreover, maintenance of the devices to ensure they remain in proper working order and last for as long as possible increases operational costs. Such expenses can become prohibitively expensive for small laboratories or businesses that must operate within strict budgets. With such hesitation, an organization may prefer multi-cuvette spectrophotometers be a low priority, opting instead for cheaper alternatives with less overhead.
Opportunities
-
Implementation of Multi-Cuvette Spectrophotometers in Automated Laboratory Systems Increases Capacity and Productivity to Fuel the Market
Integrating multi-cuvette spectrophotometers with automated laboratory systems substantially increases capacity and productivity, driving further market expansion. Automation not only saves labor hours and days, but repetitive processes are handled at a significantly faster pace to enable faster and more consistent testing in high-capacity environments. These spectrophotometers are integrated into fully automated workflows, which means that the processes are streamlined and more precise, with less risk of human error. This synergy is especially valuable in industries like pharmaceuticals, biotechnology, and environmental testing, where rapid and accurate analysis is critical. By facilitating high-throughput testing and minimizing manual intervention, the integration of automation makes multi-cuvette spectrophotometers more appealing for large-scale laboratories, further boosting their adoption and expanding market opportunities.
Challenges
-
Skilled Personnel Requirements and Operational Complexity Limit Adoption of Multi-Cuvette Spectrophotometers in Smaller Laboratories
The need for skilled personnel to operate multi-cuvette spectrophotometers poses a significant barrier to widespread adoption, particularly in smaller laboratories or organizations with limited technical expertise. These instruments, while highly advanced, require specialized knowledge to ensure accurate operation and maintenance. Without proper training, there's a risk of suboptimal performance or inaccuracy, which would undermine the value. Smaller labs often cannot afford such an investment in training or the hiring of well-trained staff and thus find these highly sophisticated instruments less attractive for adoption. This operational complexity can slow down the growth of the market, especially in regions or industries where access to qualified personnel is limited, thereby restricting the potential user base for multi-cuvette spectrophotometers.
Segment Analysis
By Component
The Light Source segment held the largest share in the Multi-Cuvette Spectrophotometers Market in 2023, accounting for approximately 29% of the revenue share, because it is a critical component in spectrophotometry that offers stable and consistent light for measurements. The Software segment will be growing with the fastest CAGR of approximately 7.53% over the forecasted period of 2024 to 2032, due to rising demand for advanced software that provides better analytics, automation capabilities, and integrates with other systems used in laboratory, thereby reducing errors and inaccuracies
By Product Type
The UV-Visible Spectrophotometers segment held the highest revenue share of around 45% in the Multi-Cuvette Spectrophotometers Market in 2023, as these instruments are highly utilized due to their ability to measure absorbance range across a wide spectrum of samples, and thus, are highly required by industries such as pharmaceuticals, biotechnology, and environmental testing. The Fluorescence Spectrophotometers segment is expected to grow at the fastest CAGR of about 7.65% from 2024-2032, driven by increasing demand for highly sensitive detection methods in applications like medical diagnostics and research.
By Application
The Life Sciences and Biotechnology segment accounted for the highest revenue share of around 31% in 2023 in the Multi-Cuvette Spectrophotometers Market, as the demand for precise analytical tools in research, genomics, and protein analysis is on the rise. The Pharmaceuticals segment is going to expand with the fastest CAGR around 7.49% during 2024-2032, as there is growing demand of spectrophotometric analysis in drug development, quality control and clinical testing, as the pharmaceutical industry is interested in accuracy coupled with regulatory compliance.
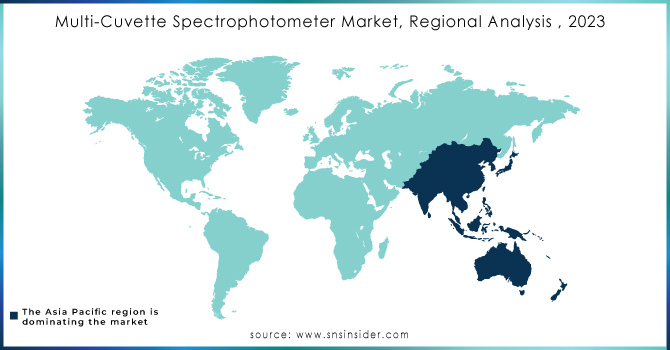
Regional Analysis
North America dominated the Multi-Cuvette Spectrophotometers Market in 2023 with the highest revenue share of about 35%, driven by the region's strong presence in research and development across biotechnology, pharmaceuticals, and healthcare sectors. The advanced infrastructure, well-established academic institutions, and high demand for precise analytical tools for drug testing, clinical research, and quality control contribute to its market leadership. Additionally, stringent regulatory standards in the region further amplify the need for reliable and accurate measurement instruments.
Asia Pacific is likely to grow at the fastest CAGR of about 7.77% from 2024-2032 due to fast industrialization and growing investment in healthcare, biotechnology, and pharmaceuticals. The upsurge in efforts to upgrade healthcare infrastructure, growth in research activities, and advancements in regulatory practices are all merging into a scenario that is propitious to the adoption of multi-cuvette spectrophotometers. The burgeoning pharmaceutical market in countries like China and India continues to drive demand for advanced analytical solutions, making Asia Pacific the fastest-growing region within the market.
Get Customized Report as per your Business Requirement - Request For Customized Report
Key Players
-
PerkinElmer (Lambda 365 UV/Vis Spectrophotometer, Victor Nivo Microplate Reader)
-
Eppendorf (BioSpectrometer Basic, BioPhotometer)
-
Shimadzu Corporation (UV-1800 UV-Vis Spectrophotometer, UV-2600 UV-Vis Spectrophotometer)
-
Hach Company (DR 1900 Portable Spectrophotometer, DR6000 UV-Vis Spectrophotometer)
-
Xylem (ABS 200 Spectrophotometer, DS5.0 Spectrophotometer)
-
Horiba (U-2900 UV-Vis Spectrophotometer, FT-IR Spectrometer)
-
Hitachi HighTech (U-2900 UV-Vis Spectrophotometer, UH-4150 UV-Vis Spectrophotometer)
-
Jasco (V-630 UV-Vis Spectrophotometer, V-730 UV-Vis Spectrophotometer)
-
Agilent Technologies (Cary 60 UV-Vis Spectrophotometer, Cary 3500 UV-Vis Spectrophotometer)
-
Beckman Coulter (DU 800 UV-Vis Spectrophotometer, DU 730 Life Science UV-Vis Spectrophotometer)
-
Miltenyi Biotec (MACSQuant VYB, MACSQuant Analyzer 10)
-
Mettler Toledo (SevenExcellence pH/Ion/Conductivity Meter, UV5 Spectrophotometer)
-
Bruker (Optics FT-IR Spectrophotometer, ALPHA II FT-IR Spectrometer)
-
Thermo Fisher Scientific (Nicolet iS50 FT-IR Spectrometer, Evolution 260 Bio UV-Vis Spectrophotometer)
-
BioRad Laboratories (SmartSpec Plus Spectrophotometer, NanoDrop One Microvolume UV-Vis Spectrophotometer)
-
ABB (UV-VIS Spectrophotometer, ACS800 UV Spectrometer)
-
Bausch & Lomb (Spectronic 200 Spectrophotometer, Spectronic 1201)
-
Oxford Instruments (FQS Series UV-Vis Spectrophotometer, X-Strahl UV Spectrometer)
-
Analytik Jena (Specord 200 UV-Vis Spectrophotometer, Specord 210 Plus)
-
Thermo Fisher Scientific (UV-Vis Spectrophotometer NanoDrop 8000, Thermo Scientific Genesys 30)
-
JASCO (V-570 UV-Vis-NIR Spectrophotometer, V-730 UV-Vis Spectrophotometer)
-
Teledyne Leeman Labs (Proton 4000 UV-Vis Spectrophotometer, SOLA UV-Vis Spectrophotometer)
Recent Developments:
-
In 2023, Shimadzu Corporation introduced the SolidSpec-3700i and SolidSpec-3700i DUV UV-Vis-NIR Spectrophotometers, which offer high sensitivity and wide measurement range, catering to industries such as optical, semiconductor, and flat-panel displays.
-
In 2024, Agilent Technologies launched the Cary 3500 Compact UV-Vis Spectrophotometer, offering high-performance measurements with a focus on sustainability and achieving the My Green Lab’s ACT label for environmental impact.
| Report Attributes | Details |
|---|---|
| Market Size in 2023 | USD 8.85 Billion |
| Market Size by 2032 | USD 14.87 Billion |
| CAGR | CAGR of 5.98% From 2024 to 2032 |
| Base Year | 2023 |
| Forecast Period | 2024-2032 |
| Historical Data | 2020-2022 |
| Report Scope & Coverage | Market Size, Segments Analysis, Competitive Landscape, Regional Analysis, DROC & SWOT Analysis, Forecast Outlook |
| Key Segments | • By Product Type (UV-Visible Spectrophotometers, Fluorescence Spectrophotometers, IR Spectrophotometers, Others) • By Component (Light Source, Detectors, Software, Cuvette Holders, Others) • By Application (Life Sciences and Biotechnology, Pharmaceuticals, Chemical Industry, Environmental Testing, Food and Beverage Industry, Academic and Research Institutes) |
| Regional Analysis/Coverage | North America (US, Canada, Mexico), Europe (Eastern Europe [Poland, Romania, Hungary, Turkey, Rest of Eastern Europe] Western Europe] Germany, France, UK, Italy, Spain, Netherlands, Switzerland, Austria, Rest of Western Europe]), Asia Pacific (China, India, Japan, South Korea, Vietnam, Singapore, Australia, Rest of Asia Pacific), Middle East & Africa (Middle East [UAE, Egypt, Saudi Arabia, Qatar, Rest of Middle East], Africa [Nigeria, South Africa, Rest of Africa], Latin America (Brazil, Argentina, Colombia, Rest of Latin America) |
| Company Profiles | PerkinElmer, Eppendorf, Shimadzu Corporation, Hach, Xylem, Horiba, Hitachi HighTech, Jasco, Agilent Technologies, Beckman Coulter, Miltenyi Biotec, Mettler Toledo, Bruker, Thermo Fisher Scientific, BioRad Laboratories, ABB, Bausch & Lomb, Oxford Instruments, Analytik Jena, Teledyne Leeman Labs |
Frequently Asked Questions
ANS: Technological advancements in precision, automation, and multi-cuvette functionality are key drivers.
ANS: Asia Pacific is expected to grow at the fastest CAGR of about 7.77% from 2024 to 2032.
ANS: The Life Sciences and Biotechnology segment accounted for the highest revenue share of around 31%.
ANS: The UV-Visible Spectrophotometers segment held the highest revenue share of around 45%.
ANS: Multi-Cuvette Spectrophotometer Market was valued at USD 8.85 billion in 2023 and is expected to reach USD 14.87 billion by 2032, growing at a CAGR of 5.98% from 2024-2032.
Get in Touch
