Smart Bicycle Tire Pressure Monitor Market Size Analysis:
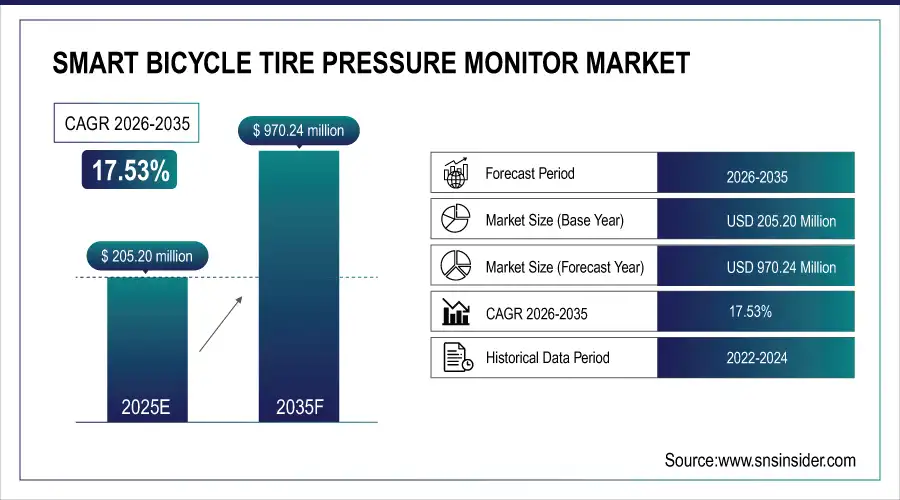
The Smart Bicycle Tire Pressure Monitor Market was valued at USD 205.20 million in 2025 and is expected to reach USD 970.24 million by 2035, growing at a CAGR of 17.53% from 2026-2035.
The Smart Bicycle Tire Pressure Monitor market is witnessing rapid growth driven by increasing adoption of connected cycling technologies and the rising focus on rider safety and performance optimization. Real-time tyre pressure monitoring with the help of advanced integrated and external sensors makes riding more convenient and efficient for users of mountain, road, hybrid and e-bikes. The market is driven by the expansion of retail online and specialty outlets, along with rising awareness of effective tyre care among selling circles, whether between casual cyclists or professional competitors.
Integrated Tyre Pressure Sensors: Zipp's 353 NSW and 303 SW wheels come with built-in AXS sensors that constantly monitor pressure, lighting green when good and red if too low. Exact readings are displayed through the AXS app or through compatible headunits from various brands.
Smart Bicycle Tire Pressure Monitor Market Size and Forecast
-
Market Size in 2025: USD 205.20 Million
-
Market Size by 2035: USD 970.24 Million
-
CAGR: 17.53% from 2026 to 2035
-
Base Year: 2025
-
Forecast Period: 2026–2035
-
Historical Data: 2022–2024
To Get more information On Smart Bicycle Tire Pressure Monitor Market - Request Free Sample Report
Smart Bicycle Tire Pressure Monitor Market Trends
-
Rising interest in cyclist safety and performance optimization is driving the smart bicycle tire pressure monitor market.
-
Growing adoption of connected cycling accessories and fitness technologies is boosting market growth.
-
Expansion of urban cycling, e-bikes, and recreational biking is fueling demand for real-time tire monitoring.
-
Increasing focus on preventing tire blowouts, improving ride comfort, and enhancing efficiency is shaping adoption trends.
-
Advancements in IoT sensors, Bluetooth connectivity, and mobile app integration are improving usability and accuracy.
-
Rising consumer awareness of preventive maintenance and smart mobility solutions is supporting market expansion.
-
Collaborations between cycling equipment manufacturers, sensor technology providers, and app developers are accelerating innovation and global adoption.
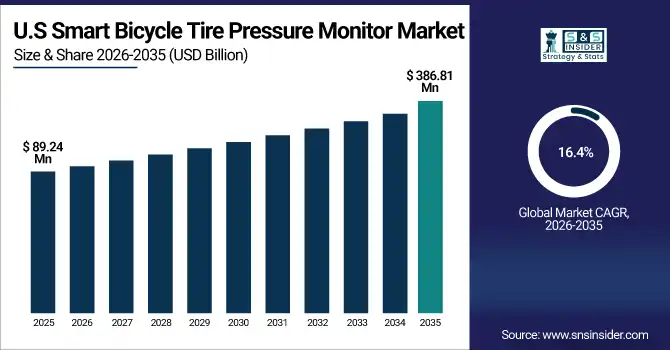
The U.S. Smart Bicycle Tire Pressure Monitor Market was valued at USD 89.24 million in 2025 and is expected to reach USD 386.81 million by 2035, growing at a CAGR of 16.4% from 2026-2035. The Smart Bicycle Tire Pressure Monitor market growth is driven by rising adoption of connected cycling technologies, increasing focus on rider safety, and growing demand for performance optimization in e-bikes, road, mountain, and hybrid bikes. Technological advancements in real-time tyre pressure monitoring and app integration further fuel Smart Bicycle Tire Pressure Monitor growth in the U.S.
Smart Bicycle Tire Pressure Monitor Market Growth Drivers:
-
Rising Safety and Performance Awareness Driving Smart Bicycle Tire Pressure Monitor Market Growth
The Smart Bicycle Tire Pressure Monitor market is being driven by increasing cyclist focus on safety, performance, and real-time data-driven riding insights. With advanced monitoring solutions, riders can monitor tyre pressure — paired with alerts when they deviate from the optimal range to help deliver better grip and handling across mountain, road, hybrid and e-bikes. Affordable, easy-to-install sensors that integrate seamlessly with apps or headunits are making their way into homes of more individual and competing cyclists. A more heightened awareness towards the importance of maintaining the right tyre pressures, together with the development of advanced wireless/Bluetooth-enabled monitoring systems, is providing lucrative opportunities.
Outrider Tire Pressure Sensor The Outrider is a super-affordable, Garmin-compatible sensor that tucks into tubeless tires to deliver live pressure updates and alerts and puncture warnings to help minimize bike safety and performance on almost any trail.
Smart Bicycle Tire Pressure Monitor Market Restraints:
-
High Costs and Compatibility Challenges Limiting Growth of the Smart Bicycle Tire Pressure Monitor Market
The Smart Bicycle Tire Pressure Monitor market faces several restraints that may limit growth despite rising adoption. The high upfront expense of sophisticated sensors and combined monitoring systems can repel single and recreational level cyclists. High level technical barriers and fragmentation between bike types, tubeless versus tube setups, and also differing head unit or app ecosystems. The limitations of battery life, the demands of maintaining the sensors, and sensor calibration errors are additional sensors challenges, too. This may be compounded by low awareness in the emerging markets and unwillingness to invest in performance-centric accessories to speed up adoption.
Smart Bicycle Tire Pressure Monitor Market Opportunities:
-
Technological Advancements Driving Opportunities in the Smart Bicycle Tire Pressure Monitor Market
The Smart Bicycle Tire Pressure Monitor market presents significant opportunities due to the increasing demand for advanced real-time monitoring solutions that enhance rider safety, performance, and efficiency. Advancements in tiny, mobile, and smart enabled embedded sensors enable cyclists to capture real-time data with dynamic ease, such as tire pressure, wheel speed, and various metrics over road, gravel, mountain and hybrid bikes. The increasing awareness regarding proper tire maintenance is intended to create opportunities for sensor manufacturers and accessory developers with e-bikes and connected cycling technologies becoming more popular.
SRAM Next-Gen Zipp Wheels Patent Launch A recent SRAM patent reveals plans for next-generation Zipp wheels with integrated real-time sensors monitoring tire pressure, wheel speed, lean angle, yaw, and road conditions, promising smarter, aero-optimized performance for road, gravel, and mountain bikes.
Smart Bicycle Tire Pressure Monitor Market Challenges:
-
Technical Limitations and Market Fragmentation Hinder Growth of the Smart Bicycle Tire Pressure Monitor Market
The Smart Bicycle Tire Pressure Monitor market faces key challenges that could slow its expansion despite growing demand. Technical limitations, including limited battery life, sensor calibration errors, and compatibility issues with different bike types and headunit or app systems, reduce user adoption. The lack of standardized protocol across vendors and market fragmentation leads to integration challenges. Further, costly device prices, maintenance specifications, and low awareness in developing areas hamper accessibility among casual and instinctive bike riders. These factors are further casting substantial road blocks in the growth of Smart Bicycle Tire Pressure Monitor across geographies owing to concerns regarding accuracy of data, durability during tough riding conditions, and low acceptance of performance based accessories.
Smart Bicycle Tire Pressure Monitor Market Segmentation Analysis:
By Product Type
In 2025, the Integrated Tire Pressure Monitors segment accounted for approximately 60% of the Smart Bicycle Tire Pressure Monitor market share, driven by rising demand for seamless, real-time monitoring solutions that enhance rider safety and performance. A bicycle tire pressure sensor is a new-age cycling technology solution essentially designed to assist cyclers in vehicle performance and efficiency, thus driving the surge in market growth on account of rising adoption of connected cycling technologies, preference for low maintenance and easy to install devices, and increase awareness amongst individual as well as professional cyclists towards optimal tire pressure.
The External Tire Pressure Monitors segment is expected to experience the fastest growth in the Smart Bicycle Tire Pressure Monitor market over 2026-2035 with a CAGR of 18.83%, due to the growing adoption of affordable, easy-to-install and portable monitors, which do not require modifications to the bike rim. The segment is being driven by increased adoption among casual riders, hobbyists and rental services along with technological advancements in wireless connectivity, real-time alerts and app integration. Due to the wide scope and flexibility of external monitors, they are expected to be one of the important contributors to the market growth, over the forecast period.
By Sensor Type
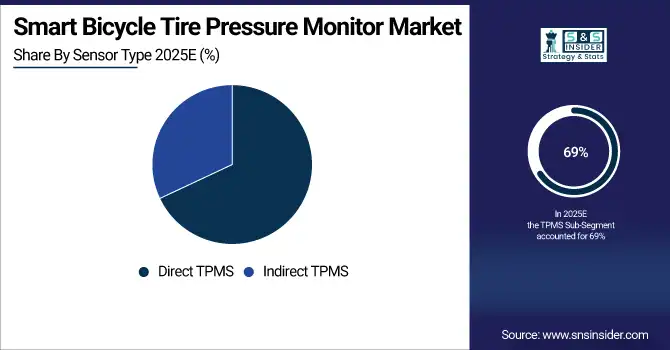
In 2025, the Direct TPMS segment accounted for approximately 69% of the Smart Bicycle Tire Pressure Monitor market share, owing to its function, which generates precise, timely tire pressure responses as well as ensure safety for riders. Increase adoption of connected cycling technologies, high-performance monitoring solutions, dynamic market knowledge among cyclists, and increasing awareness of cycling has fueled the overall growth of this market. The segment is fueled by technological advancements like wireless connectivity, app integration, and convenient installation, making Direct TPMS an essential part driving overall Smart Bicycle Tire Pressure Monitor market growth.
The Indirect TPMS segment is expected to experience the fastest growth in the Smart Bicycle Tire Pressure Monitor market over 2026-2035 with a CAGR of 20.69%, Indirect TPMS has gained immense popularity owing to their low cost, easy installation as the only requirement is to install & align the sensor with existing wheel speed sensors without customizing the tire or rim. The growth of the segment is supported for the increase in adoption among casual cyclists, hobbyists, and bike rental services, and the technological advancements of Bluetooth alerts, app integration, and live performance tracking. This, coupled with the growing popularity and cost efficiency of Indirect TPMS, is anticipated to be a major market growth propeller over the forecast period.
By Application
In 2025, the Direct TPMS segment accounted for approximately 69% of the Smart Bicycle Tire Pressure Monitor market share, is expected to experience the fastest growth over 2026-2035 with a CAGR of 18.56%, driven by increasing demand for highly accurate, real-time tire pressure monitoring that enhances rider safety and performance. Rising adoption among professional cyclists, e-bike users, and hobbyists, coupled with technological advancements such as wireless connectivity, app integration, and easy installation, is fueling the segment’s expansion. The reliability and precision of Direct TPMS make it a key contributor to overall market growth.
By End-User
In 2025, the Individual Cyclists segment accounted for approximately 40% of the Smart Bicycle Tire Pressure Monitor market share, driven by growing awareness of the importance of optimal tire pressure for safety and performance. Market growth is supported by increasing adoption of e-bikes, road, mountain, and hybrid bikes among recreational and fitness-focused cyclists. Technological advancements such as wireless connectivity, app integration, and easy-to-install sensors enhance convenience and usability.
The Bike Rental Services segment is expected to experience the fastest growth in the Smart Bicycle Tire Pressure Monitor market over 2026-2035 with a CAGR of 19.98%, due to the rising adoption of shared mobility services and the need for effective and real-time tire pressure monitoring solutions for rider safety and maintenance cost savings. The value of wireless sensors, app integration, and simple installation helps rental operators increase their operational efficiencies. This demand along with a growing demand for reliable and low-maintenance solutions in urban and tourist-centric areas is making the segment to grow and emergent Bike Rental Services as a major growth driver of the market.
By Distribution Channel
In 2025, the Online Stores segment accounted for approximately 38% of the Smart Bicycle Tire Pressure Monitor market share, driven by the growing preference for e-commerce platforms offering wider product choices, competitive pricing, and convenient doorstep delivery. The increasing penetration of smartphones, secure online payment systems, and promotional discounts have further boosted sales through digital channels. Additionally, partnerships between manufacturers and leading online retailers enhance product visibility and availability, while customer reviews and ratings influence purchasing decisions, solidifying online stores as a dominant distribution channel in the market.
The Specialty Stores segment is expected to experience the fastest growth in the Smart Bicycle Tire Pressure Monitor market over 2026-2035 with a CAGR of 18.91% . This growth is driven by increasing consumer preference for expert guidance, personalized service, and access to high-quality, performance-oriented cycling products. Specialty stores offer hands-on demonstrations, technical support, and installation services, enhancing customer confidence and adoption. Rising demand for premium bikes, e-bikes, and advanced monitoring solutions, coupled with growing awareness of rider safety and performance optimization, is fueling the expansion of specialty retail channels in the market.
Smart Bicycle Tire Pressure Monitor Market Regional Analysis:
Asia Pacific Smart Bicycle Tire Pressure Monitor Market Insights
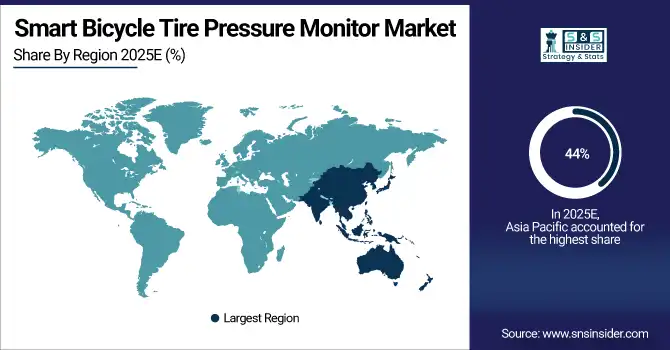
In 2025 Asia Pacific dominated the Smart Bicycle Tire Pressure Monitor Market and accounted for 44% of revenue share, growing with the rise in sales of e-bikes, mountain bikes, and road bikes in countries such as China, Japan, and India. An increase in urbanization, rising health and fitness consciousness, as well as support from the government by way of provisions for setting up cycling infrastructure, are all factors that are boosting demand, Market growth is further bolstered by increasing technology, decreasing costs, and growing retail channel availability both online and in specialty retail.
Get Customized Report as per Your Business Requirement - Enquiry Now
North America Smart Bicycle Tire Pressure Monitor Market Insights
North America is expected to witness the fastest growth in the Smart Bicycle Tire Pressure Monitor market over 2026-2035, with a projected CAGR of 19.37%, owing to rising usage of e-bikes, road bikes and mountain bikes in recreational and professional cycling. Demand is driven by increasing awareness of the rider's safety, performance optimization, and connected cycling technologies. Increasing technological developments such as Wireless Sensors (sensors connected to the internet), App Integration (the running of the application supporting the buyer), and Accessibility (the ability to easily install the product) have been promoting the development of ventilated warehousing & production system globally.
Europe Smart Bicycle Tire Pressure Monitor Market Insights
In 2025, Europe emerged as a promising region in the Smart Bicycle Tire Pressure Monitor market, driven by increasing adoption of e-bikes, road bikes, and hybrid bikes across countries such as Germany, France, and the Netherlands. Government initiatives promoting cycling infrastructure, sustainable transportation, and urban mobility solutions are fueling demand. Rising awareness of rider safety, performance optimization, and connected cycling technologies is further boosting market growth.
Middle East & Africa and Latin America Smart Bicycle Tire Pressure Monitor Market Insights
Latin America (LATAM) and the Middle East & Africa (MEA) regions are witnessing steady growth in the Smart Bicycle Tire Pressure Monitor market, driven by urbanization, health and fitness awareness, and growing cycling culture as an eco-friendly mode of transportation. Cycling infrastructure development, change in e-bike adoption trend and increases in disposable incomes are driving demand. The increase in awareness towards rider safety and improvement of performance of the vehicle along with the availability of low cost and easy to install monitoring solutions via online and specialty retail channels is aiding the growth of the market.
Smart Bicycle Tire Pressure Monitor Market Competitive Landscape:
Schrader Electronics
Schrader Electronics, a subsidiary of Sensata Technologies, is a global leader in tire pressure monitoring systems across automotive, two-wheelers, and emerging micromobility segments. Through its AIRsistant brand, Schrader extends TPMS expertise into bicycles and e-bikes, offering Bluetooth-enabled smart sensors for real-time pressure monitoring. The company leverages automotive-grade sensing technology, connectivity, and manufacturing scale to support safer, more efficient, and digitally connected cycling ecosystems.
-
In 2025, Schrader’s AIRsistant brand signed a distribution partnership with WITT A/S, expanding bike and e-bike Bluetooth TPMS availability across Nordic countries.
-
During 2024, AIRsistant maintained active bicycle TPMS promotion through official news updates, product demonstrations, and participation in cycling and micromobility events.
-
In 2023, Schrader continued showcasing its AIRsistant Bluetooth TPMS for bikes and e-bikes, following its initial unveiling at Eurobike as a connected cycling safety solution.
Key Players
Some of the Smart Bicycle Tire Pressure Monitor Market Companies
- Schrader Electronics
- FOBO
- Garmin Ltd.
- Sate Auto Electronic Co. Ltd.
- Orange Electronic Co. Ltd.
- Steelmate Co. Ltd.
- PressurePro
- Doran Manufacturing
- Sensata Technologies
- Continental AG
- Michelin
- Bosch
- Hutchinson SA
- CycloTrac
- TyreCare
- Nokeval
- Bartec USA LLC
- Sigfox
- TireMinder
- InnoSenT GmbH
| Report Attributes | Details |
|---|---|
| Market Size in 2025 | USD 205.20 Million |
| Market Size by 2035 | USD 970.24 Million |
| CAGR | CAGR of 17.53% From 2026 to 2035 |
| Base Year | 2025 |
| Forecast Period | 2026-2035 |
| Historical Data | 2022-2024 |
| Report Scope & Coverage | Market Size, Segments Analysis, Competitive Landscape, Regional Analysis, DROC & SWOT Analysis, Forecast Outlook |
| Key Segments | • By Product Type(Integrated Tire Pressure Monitors and External Tire Pressure Monitors) • By Sensor Type(Direct TPMS and Indirect TPMS) • By Application(Mountain Bikes, Road Bikes, Hybrid Bikes, E-Bikes and Others) • By End-User(Individual Cyclists, Professional Cyclists, Bike Rental Services and Others) • By Distribution Channel(Online Stores, Specialty Stores, Supermarkets/Hypermarkets and Others) |
| Regional Analysis/Coverage | North America (US, Canada), Europe (Germany, UK, France, Italy, Spain, Russia, Poland, Rest of Europe), Asia Pacific (China, India, Japan, South Korea, Australia, ASEAN Countries, Rest of Asia Pacific), Middle East & Africa (UAE, Saudi Arabia, Qatar, South Africa, Rest of Middle East & Africa), Latin America (Brazil, Argentina, Mexico, Colombia, Rest of Latin America). |
| Company Profiles | The Smart Bicycle Tire Pressure Monitor market Companies are Schrader Electronics, FOBO, Garmin Ltd., Sate Auto Electronic Co. Ltd., Orange Electronic Co. Ltd., Steelmate Co. Ltd., PressurePro, Doran Manufacturing, Sensata Technologies, Continental AG, Michelin, Bosch, Hutchinson SA, CycloTrac, TyreCare, Nokeval, Bartec USA LLC, Sigfox, TireMinder, InnoSenT GmbH and Others |
Frequently Asked Questions
Asia-Pacific dominated the Smart Bicycle Tire Pressure Monitor Market in 2025.
The “Integrated Tire Pressure Monitors” segment dominated the Smart Bicycle Tire Pressure Monitor Market
Increasing adoption of connected cycling technologies, rising focus on rider safety, and growing demand for performance optimization in both recreational and professional biking.
The Smart Bicycle Tire Pressure Monitor Market was valued at USD 205.20 million in 2025 and is expected to reach USD 970.24 million by 2035.
The Smart Bicycle Tire Pressure Monitor Market is expected to grow at a CAGR of 17.53% during 2026-2035.
Get in Touch
