Nano Positioning Systems Market Report Scope & Overview:
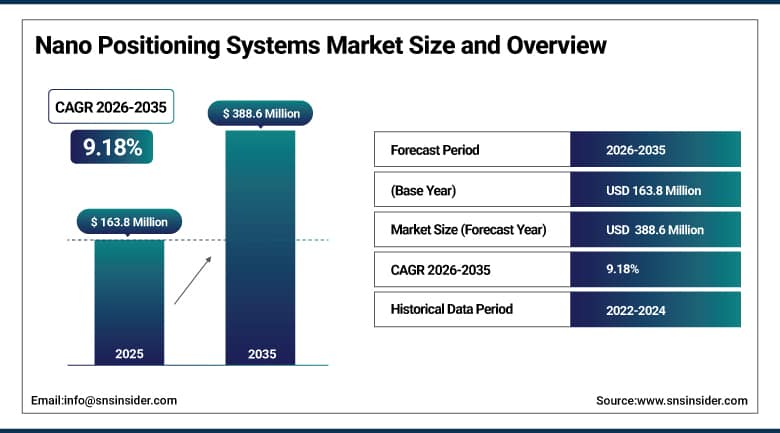
The Nano Positioning Systems Market was valued at USD 163.8 Million in 2025 and is expected to reach USD 388.6 Million by 2035, growing at a CAGR of 9.18% from 2026–2035.
Nano positioning systems move a probe, tool, sample, or component to a desired location with nanometer-level accuracy. This level of precision is measured in billionths of a meter, a spatial resolution that exceeds the wavelength of visible light and the practical positioning capability of even the best conventional mechanical systems. These systems achieve this accuracy through closed-loop motion control using capacitive, piezoelectric, or electromechanical actuators combined with high-resolution position feedback sensors. The combination of actuation and sensing creates a control loop that continuously corrects positioning errors, maintaining target position against thermal drift, vibration, and mechanical load changes that would otherwise cause unacceptable displacement in precision-critical applications. The market serves a growing range of industries where nanometer-scale positioning precision is not a technical luxury but an operational requirement. Semiconductor photolithography requires lens and wafer stages to position with precision far below the wavelength of the light being patterned. Electron and atomic force microscopy require nanometer-stable probe positioning to resolve and manipulate individual molecular and atomic structures.
Approximately 41% of research institutes exploring nano-scale drug delivery systems reported using nano positioning stages for precise alignment in 2024. This statistic reflects how the biomedical research sector has become one of the most commercially dynamic end-user categories in the nano positioning systems market globally.
Market Size and Forecast
-
Market Size in 2026E: USD 179.0 Million
-
Market Size by 2035: USD 388.6 Million
-
CAGR: 9.18% from 2026 to 2035
-
Fastest Growing Region: Asia Pacific
-
Largest Region: Asia Pacific
To Get More Information On Nano Positioning Systems Market - Request Free Sample Report
Nano Positioning Systems Market Trends
-
AI-enabled nano positioning systems are improving predictive drift compensation and automated calibration accuracy.
-
Semiconductor node shrinkage below 3 nm is increasing demand for ultra-precise positioning systems.
-
Cryo-compatible nano positioning systems are gaining adoption in quantum computing and advanced research applications.
-
Miniaturization is enabling integration of nano positioning systems into portable scientific instruments.
-
Rising defense modernization programs are driving demand for precision nano positioning technologies.
The U.S. Nano Positioning Systems Market Outlook
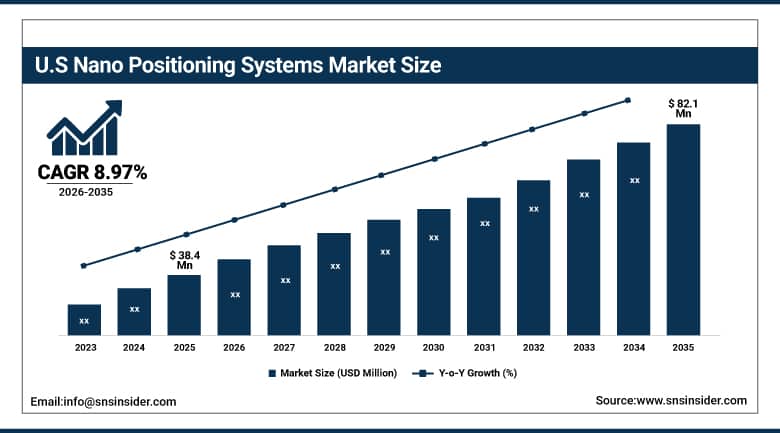
The U.S. Nano Positioning Systems Market was valued at approximately USD 38.4 Million in 2025 and is expected to reach approximately USD 82.1 Million by 2035, growing at a CAGR of 8.97%.
The United States is one of the world's two most significant nano positioning systems markets alongside Germany, driven by the extraordinary concentration of semiconductor manufacturing, advanced scientific research, aerospace, and defense applications that demand nanometer-scale precision motion control. American semiconductor manufacturers including Intel, Texas Instruments, GlobalFoundries, and the TSMC Arizona facility depend on nano positioning stages for photolithography, metrology, and inspection throughout their fabrication processes. U.S. research universities and national laboratories operating electron microscopy, atomic force microscopy, and scanning tunnelling microscopy maintain large installed bases of nano positioning systems that generate ongoing maintenance and upgrade procurement. DARPA and the U.S. defense services invest in nano positioning technology development through research contracts with academic institutions and defense industrial companies.
The CHIPS and Science Act's USD 52 billion investment in U.S. semiconductor manufacturing creates sustained demand for nano positioning systems as new fabrication and inspection equipment at advanced nodes requires precision positioning stages at specifications that only nano positioning technology can achieve reliably and repeatably.
Nano Positioning Systems Market Segment Analysis
-
By Technology, Capacitive Nano Positioning Systems led the market with approximately 38% share in 2025; Piezoelectric Nano Positioning Systems are the fastest-growing at a CAGR of 9.81% driven by technological advances and growing applications in biomedical research and aerospace.
-
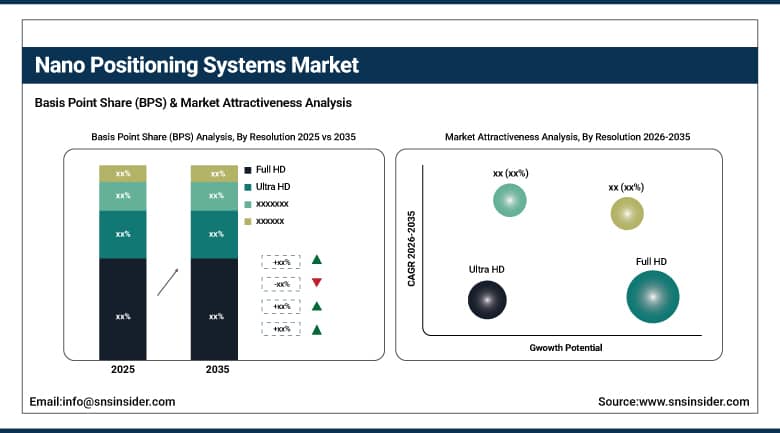
By Resolution, Full HD systems held approximately 32% share in 2025; Ultra HD systems are the fastest-growing at a CAGR of 9.63% through increasing demand for higher-resolution positioning in next-generation semiconductor and microscopy applications.
-
By End User, Automotive Manufacturers held approximately 31% share in 2025; Defense & Security Agencies are the fastest-growing end user at a CAGR of 9.59% through investment in defense modernization and precision targeting systems.
-
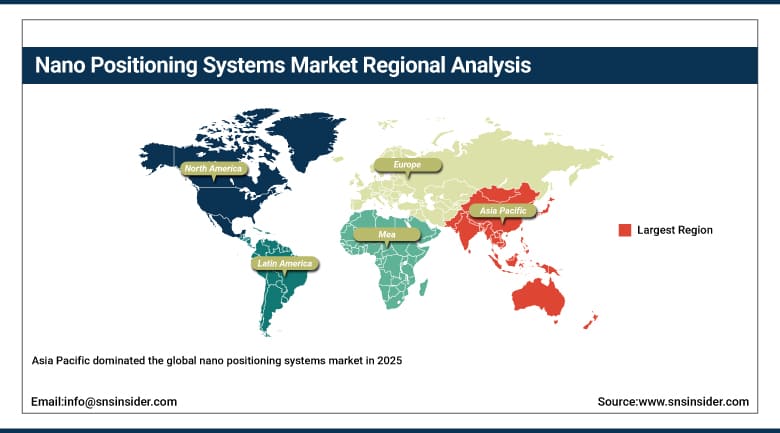
By Region, Asia Pacific dominated the market in 2025; North America held a significant share through advanced research infrastructure and strong defense, healthcare, and semiconductor sector investments.
By Resolution, Full HD systems dominate, Ultra HD grows fastest
Full HD nano positioning systems accounted for approximately 32% of the market in 2025, driven by their widespread adoption across semiconductor manufacturing, microscopy, biomedical research, and industrial automation applications. These systems provide an optimal balance between precision, imaging quality, and cost-effectiveness, making them the preferred choice for laboratories and production facilities requiring reliable nanoscale positioning without the higher investment associated with Ultra HD solutions. Their compatibility with existing imaging and motion-control infrastructures further supports continued market dominance.
Ultra HD nano positioning systems are projected to register the fastest CAGR of 9.63% during the forecast period, fueled by rising demand for superior imaging accuracy in next-generation semiconductor fabrication, advanced microscopy, photonics, and life sciences research. Higher-resolution positioning capabilities enable enhanced visualization and alignment at sub-nanometer levels, supporting increasingly complex manufacturing and analytical processes. The growing integration of AI-driven diagnostics, automated inspection systems, and high-precision metrology platforms is further accelerating adoption of Ultra HD technologies across research and industrial environments.
By Technology, capacitive systems dominate, piezoelectric grows fastest
The capacitive nano positioning system has captured about 38% share of the global nano positioning systems market. Commercially, the product's popularity can be attributed to its ability to offer exceptional precision, stability, and reliability for use in a wide array of applications. The operation of the capacitive sensing technology relies on the direct measurement of the distance between two conductive plates using electrical capacitance, which is achieved without physical contact, thereby avoiding frictional or wear-induced positioning errors. Non-contact sensing ensures that the resolution, linearity, and stability of this type of measurement system are all outstanding.
Piezoelectric nano positioning systems are the fast-growing technologies with a CAGR of 9.81%. Piezoelectricity involves direct energy conversion from electrical voltage into mechanical displacement. No movement of any sort, no gears, no motors, and no backlash are involved in the energy conversion process. This unique approach offers an unmatched step resolution of below nanometers and quick response time of milliseconds.
By End User, automotive manufacturers dominate, defense grows fastest
Automotive manufacturing companies constituted about 31% of the share in the nano-positioning system market in 2025. This is a result of the incorporation of very accurate motion control technology in applications such as sensor calibration, development of autonomous driving technologies, and testing of advanced driver assistance systems in automobiles. LiDAR sensor alignment in autonomous automobiles involves using nano-positioning stages due to their ability to meet the pointing accuracy required by automotive laser ranging technology. Camera calibration in ADAS involves use of nano-positioning stages.
The defense and security sector accounts for the fastest-growing end-user segment in the period 2025 – 2035 at a CAGR of 9.59%. Investments in military modernization are some of the factors fueling the use of nano positioning technology in precision targeting, advanced surveillance optics, and weapon pointing systems. Military optical systems of the future will depend on nano-positioning technology because of the ability of nano-positioning stages to offer high speed and accurate motion control during the tracking of targets.
Regional Analysis
|
Region |
Major Country |
Share within Region, 2025 (%) |
|---|---|---|
|
North America |
United States |
71.3% |
|
Europe |
Germany |
34.2% |
|
Asia Pacific |
China |
43.8% |
|
Middle East & Africa |
Israel |
28.4% |
|
Latin America |
Brazil |
38.7% |
Asia Pacific Nano Positioning Systems Market Insights
Asia Pacific dominated the global nano positioning systems market in 2025 through its combination of the world's largest semiconductor manufacturing ecosystem, rapidly expanding electronics production infrastructure, and growing defense and research investment across the region. China accounts for approximately 43.8% of Asia Pacific revenues as the world's most active semiconductor equipment market and a major investor in advanced scientific research infrastructure. The Chinese semiconductor industry's aggressive capacity expansion requires nano positioning systems for lithography, inspection, and metrology equipment throughout fabrication. Japan, South Korea, and Taiwan each maintain sophisticated nano positioning system user bases through their leading-edge semiconductor and precision electronics manufacturing operations.
Get Customized Report as Per Your Business Requirement - Enquiry Now
North America Nano Positioning Systems Market Insights
North America held a significant share of the global nano positioning systems market in 2025 through its concentration of advanced research infrastructure, semiconductor manufacturing facilities, aerospace and defense programmes, and life science research institutions that are intensive nano positioning system end users. The United States accounts for approximately 71.3% of North American revenues. American research universities and national laboratories including MIT, Caltech, Lawrence Berkeley, and Oak Ridge maintain extensive nano positioning system installations across electron microscopy, nanotechnology research, and quantum physics programmes. Canada contributes to North American market demand through its active photonics research sector, university nanotechnology research programmes, and growing biomedical research investment. The National Research Council of Canada and university-based nano science institutes use nano positioning systems in scanning probe microscopy, optical trapping, and nano fabrication research that generates ongoing equipment procurement and maintenance demand.
Europe Nano Positioning Systems Market Insights
Europe is a large and technically sophisticated nano positioning systems market driven by exceptional research institution density, strong photonics and precision optics industry, and significant pharmaceutical and biomedical research investment. Germany accounts for approximately 34.2% of European revenues through its concentration of precision technology companies, the Fraunhofer and Max Planck research institute networks, and the headquarters of Physik Instrumented, one of the world's most commercially significant nano positioning system manufacturers. European research funding programmes through Horizon Europe sustain laboratory nano positioning system procurement across hundreds of universities and institutional research programmes. Switzerland, the Netherlands, and Sweden are also significant European nano positioning markets through their concentrations of photonics companies, university research excellence in nanotechnology, and high-precision manufacturing industries. CERN and European Synchrotron Radiation Facility operations use sophisticated nano positioning systems in their particle physics and materials science experiments.
MEA & Latin America Nano Positioning Systems Market Insights
The Middle East and Africa and Latin America are smaller but growing nano positioning systems markets where defense technology investment, university research development, and precision manufacturing expansion are creating initial commercial traction. Israel leads MEA revenues at approximately 28.4% of the regional share through its extraordinary concentration of defense technology companies and semiconductor design firms whose precision manufacturing and test requirements include nano positioning system applications. Brazil leads Latin American revenues at approximately 38.7% through its university research programmes, growing aerospace and defense industrial base, and biomedical research investment that collectively sustain nano positioning system procurement.
Market Dynamics
Growth Drivers: Increasing demand for ultra-precise semiconductor manufacturing, expanding biomedical research, and rising defense modernization investments are driving nano positioning systems market growth.
Semiconductor manufacturing technology advancement is the most powerful structural driver of nano positioning system demand. Each generation of semiconductor fabrication technology reduces minimum feature size, requiring correspondingly higher precision in the positioning of optical elements, wafers, and inspection probes throughout the manufacturing process. The global semiconductor industry's sustained investment in advanced node capacity, catalysed by AI chip demand and government-funded reshoring programmes in the U.S. and Europe, is creating sustained demand for the nano positioning systems that advanced fabrication equipment depends on for its precision specifications. Biomedical research is one of the fastest-growing application areas for nano positioning systems. Single-molecule biology, cryo-electron microscopy for drug discovery, atomic force microscopy for cell mechanics studies, and patch-clamp electrophysiology for neuroscience research each require nano positioning precision for their core experimental methods.
Restraints: High system costs, thermal drift sensitivity, and the need for specialized integration expertise are limiting market growth.
The high cost of nano positioning systems is the most significant commercial adoption barrier. A research-grade nano positioning stage with controller and associated sensors typically costs USD 5,000 to USD 100,000 depending on travel range, axis count, and performance specifications. Multi-axis systems for complex scanning microscopy or semiconductor inspection applications can cost several hundred thousand dollars. These price levels restrict procurement to well-funded research institutions, large corporations with established precision technology budgets, and defense programmes with allocation for advanced equipment. Smaller research groups, startups, and institutions in lower-income markets are effectively excluded by cost from adopting nano positioning technology regardless of their technical need for it. Thermal drift is an inherent challenge for nano positioning systems operating at nanometer resolution in real-world laboratory environments. Temperature changes of fractions of a degree cause thermal expansion in the mechanical structures supporting nano positioning stages, creating position errors that closed-loop feedback cannot fully compensate if the drift rate exceeds the controller's correction bandwidth.
Opportunities: AI-integrated nano positioning platforms, expanding quantum computing applications, and rising defense precision targeting requirements are creating major nano positioning systems market growth opportunities.
AI-integrated autonomous nano positioning platforms represent the most commercially transformative opportunity in the market. Automated nano-scale experimental systems that independently navigate complex experimental parameter spaces, optimize positioning protocols in real time, and process results without constant expert operator supervision are becoming commercially available. These platforms dramatically increase experimental throughput and reduce the specialist expertise barrier to nano positioning adoption. Research institutions that previously required a nano positioning specialist to run experiments can operate automated platforms with general laboratory personnel, expanding the addressable market for nano positioning systems into smaller and less specialized research groups. Quantum computing hardware fabrication is creating a new and rapidly growing nano positioning application category. Superconducting qubit chips, trapped ion quantum computers, and photonic quantum systems each require nano positioning precision in their fabrication, alignment, and testing processes.
Recent Developments:
-
May 2025: Aerotech launched the second generation of its ANT nano positioning stages with enhanced piezo performance, improved thermal stability, and updated controller software enabling faster scan rates for high-throughput microscopy and semiconductor inspection applications.
-
2025: Physik Instrumented expanded its product range with new multi-axis nano positioning systems supporting cryo-compatible operation down to 4 Kelvin, addressing the growing need for ultra-precise positioning in quantum computing hardware development and cryo-electron microscopy.
-
2025: Mad City Labs extended its cryo-compatible nano positioner platform with new models achieving 14% higher precision than the previous generation, validated in physics and spectroscopy research applications at partner research institutions.
Nano Positioning Systems Market Key Players are:
-
Aerotech Inc.
-
Physik Instrumente (PI) GmbH & Co. KG
-
Cedrat Technologies SA
-
Dynamic Structures & Materials LLC
-
Mad City Labs Inc.
-
SmarAct GmbH
-
Thorlabs Inc.
-
Piezosystem Jena GmbH
-
Prior Scientific Instruments Ltd.
-
MKS Instruments Inc.
-
Novanta Inc.
-
Allied Motion Technologies Inc.
-
OWIS GmbH
-
OME Technology Co. Ltd.
-
MICRONIX USA
-
3D Systems Corporation
-
WITTENSTEIN SE
-
Grayfield Optical Inc.
-
ISP System
-
Harbin Core Tomorrow Science and Technology Co. Ltd.
Nano Positioning Systems Market Report Scop:
| Report Attributes | Details |
|---|---|
| Market Size in 2025 | USD 163.8 Billion |
| Market Size by 2035 | USD 388.6 Billion |
| CAGR | CAGR of 9.18% From 2026 to 2035 |
| Base Year | 2025 |
| Forecast Period | 2026-2035 |
| Historical Data | 2022-2024 |
| Report Scope & Coverage | Market Size, Segments Analysis, Competitive Landscape, Regional Analysis, DROC & SWOT Analysis, Forecast Outlook |
| Key Segments | • By Technology (Capacitive Nano Positioning Systems, Piezoelectric Nano Positioning Systems, Piezoresistive Nano Positioning Systems, Electromechanical Nano Positioning Systems, Others) • By Resolution (Full HD, Ultra HD, Standard Definition) • By End User (Automotive Manufacturers, Aerospace & Defense Agencies, Healthcare & Biomedical Research Institutions, Semiconductor Manufacturers, Others) |
| Regional Analysis/Coverage | North America (US, Canada), Europe (Germany, UK, France, Italy, Spain, Russia, Poland, Rest of Europe), Asia Pacific (China, India, Japan, South Korea, Australia, ASEAN Countries, Rest of Asia Pacific), Middle East & Africa (UAE, Saudi Arabia, Qatar, South Africa, Rest of Middle East & Africa), Latin America (Brazil, Argentina, Mexico, Colombia, Rest of Latin America). |
| Company Profiles | Aerotech Inc., Physik Instrumente (PI) GmbH & Co. KG, Cedrat Technologies SA, Dynamic Structures & Materials LLC, Mad City Labs Inc., SmarAct GmbH, Thorlabs Inc., Piezosystem Jena GmbH, Prior Scientific Instruments Ltd., MKS Instruments Inc., Novanta Inc., Allied Motion Technologies Inc., OWIS GmbH, OME Technology Co. Ltd., MICRONIX USA, 3D Systems Corporation, WITTENSTEIN SE, Grayfield Optical Inc., ISP System, and Harbin Core Tomorrow Science and Technology Co. Ltd. |
Frequently Asked Questions
Asia Pacific dominated the Nano Positioning Systems Market in 2025.
Capacitive Nano Positioning Systems dominated with approximately 38% of revenues in 2025.
Rising demand for ultra-precise motion control in semiconductor manufacturing and expanding biomedical research applications are the primary drivers. Defense modernization programmes requiring precision targeting and surveillance optics are accelerating growth in the fastest-growing end-user segment.
The Nano Positioning Systems Market was valued at USD 163.8 Million in 2025.
The Nano Positioning Systems Market is expected to grow at a CAGR of 9.18% from 2026 to 2035.
Get in Touch
