Nanosatellite and Microsatellite Market Report Scope & Overview:
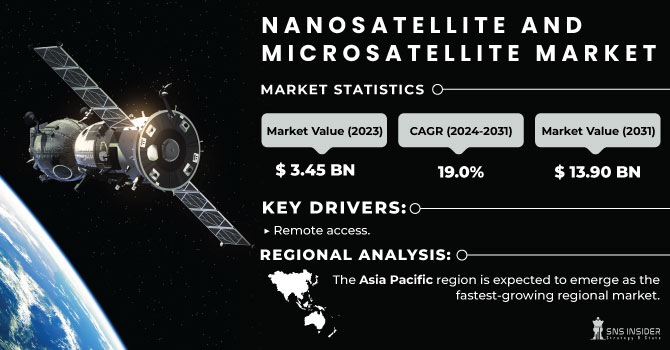
The Nanosatellite and Microsatellite Market Size was valued at US$ 3.45 billion in 2023 and is expected to reach USD 13.90 billion by 2031 with a growing CAGR of 19% over the forecast period 2024-2031.
Microsatellites and nanosatellites are more affordable than standard satellites and are utilized for different applications, for example, space examination, correspondence, and business purposes. There is an expansion in the interest for such satellites due to their quicker improvement cycles, lightweight attributes, high ability of executing complex registering position, and diminished sendoff costs. Key part like Gum-Space, Planet Labs, and Sierra Nevada Company, are sending off heavenly bodies of miniature and nanosatellites routinely to give a huge degree and scope of satellite-based administrations.
To get more information on Nanosatellite and MicrosatelliteMarket - Request Free Sample Report
Factors, for example, little size and weight in correlation with ordinary satellites and the ascent in assembling and send off of CubeSats are supposed to drive the development of the nanosatellite and microsatellite market. Notwithstanding, limits of little satellites in regards to payload convenience and rigid unofficial laws control the market development. Besides, an expansion popular for nanosatellites and microsatellites from the business area and an expansion sought after for satellite information are projected to offer rewarding learning experiences for the market players.
MARKET DYNAMICS
KEY DRIVERS
-
Remote access
RESTRAINTS
-
Access limited to space
-
High cost effective
OPPORTUNITIES
-
Non-government player
-
Disaster monitoring
CHALLENGES
-
Rising capital investment
IMPACT OF COVID-19
The COVID-19 epidemic has taught all organization’s a lot about being prepared for such unpredictable and unexpected times. Governments and businesses active in space are responding to the new scenario in a variety of ways. Certain satellite launches are proceeding, while others are not; some testing’s are ongoing, while others are postponed; some businesses remain open, while others have closed.
During the predicted period, the Software and Data Processing component of the Nanosatellite and Microsatellite Market is predicted to grow at a faster rate. This sector comprises revenue from various software packages as well as data processing suites that are necessary at the ground station for accepting and extracting useful information from raw satellite data. Revenues from onboard nanosatellite and microsatellite software are included. Nanosatellite market allows for enhanced development and collaboration of many platforms and services. Nanosatellite services assist in meeting numerous corporate difficulties, hence offering potential for growth and increasing technical innovation.
Nanosatellites and microsatellites save a lot of energy. This helps to remove barriers to reaching and exploring space, which has resulted in a spike in the popularity of small size and weight satellites since their introduction. Furthermore, depending on the needs, a small satellite may be manufactured and launched in orbit at a cheaper cost than regular satellites. Aside from the benefits of lighter weight and smaller size, the main advantage of small satellites is the short time it takes to create them. A regular or large satellite can take 5 to 15 years to create and put into orbit, whereas a nanosatellite can be developed and launched into the required orbit in less than 8 months. CubeSats, a subset of nanosatellites, are characterized by the CubeSat Plan Determination informally called the CubeSat standard. CubeSats are made by standard estimations, in units or U of 10 cm x 10 cm x 10 cm. They are typically underlying the arrangement of 1U/2U/3U/6U/12U or other in size, and as a rule weigh under 1.33 kg per unit. Making little satellites according to the CubeSat principles brings about the reducing of expenses related with the examination and specialized improvement stages, which has brought about a sharp expansion in the prominence of CubeSats since its presentation. Also, contingent upon the determinations, a CubeSat can be fabricated and situated in circle, which represents a little piece of complete expenses as contrasted and the expenses engaged with regular satellite missions. Such advantages related with CubeSats are expected to drive the development of the worldwide nanosatellite and microsatellite market during the conjecture time frame. Because of the increasing deployment of nanosatellites for Earth observation missions, the nanosatellites segment will account for more than 81 % of revenue in 2022 Earth observation satellite data has shown to be extremely useful for purposes such as improving water management, tracking refugee populations, conducting humanitarian activities, and national defense.
A nanosatellite has further advanced navigation and transportation capabilities, more efficient routes, resulting in better safety records and cheaper operational costs.
Nanosatellites are being developed for academic reasons and for conducting technological experiments in orbit by research organizations. For example, NASA's CubeSat effort has provided possibilities for educational institutions and non-governmental organizations to work on planned tiny satellite launches. NASA is providing CubeSat developers with a cost-effective way to conduct scientific studies and technological demonstrations in space through such creative technology partnerships.
KEY MARKET SEGMENTATION
By Orbit Type
-
Non-Polar Inclined
-
Polar
-
Sun-Synchronous
By End User
-
Civil
-
Government
-
Commercial
-
Military
By Application
-
Communications
-
Earth Observation
-
Space Science
-
Technology Demonstration
-
Technology Development
By Component
-
Hardware
-
Software & Data Processing
-
Services (Launch Services, Space Services)
By Type
-
Nanosatellite
-
Microsatellite
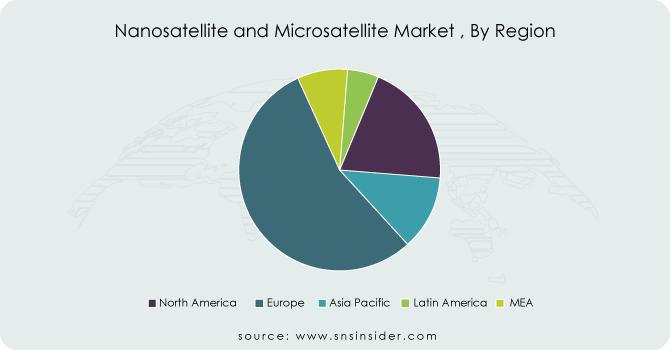
REGIONAL ANALYSIS
As economies in the region, such as Japan and India, continue to actively launch tiny satellites for communication and navigation, the Asia Pacific region is expected to emerge as the fastest-growing regional market. To fulfil the demand for miniaturization, Japan is researching tactics to tap into the demand for compact satellites and aircraft. Furthermore, countries like as South Korea and Singapore have entered the smallest production market in order to put their satellites into orbit, regardless of scale.
Need any customization research on Nanosatellite and Microsatellite Market - Enquiry Now
REGIONAL COVEREGE:
-
North America
-
USA
-
Canada
-
Mexico
-
-
Europe
-
Germany
-
UK
-
France
-
Italy
-
Spain
-
The Netherlands
-
Rest of Europe
-
-
Asia-Pacific
-
Japan
-
south Korea
-
China
-
India
-
Australia
-
Rest of Asia-Pacific
-
-
The Middle East & Africa
-
Israel
-
UAE
-
South Africa
-
Rest of Middle East & Africa
-
-
Latin America
-
Brazil
-
Argentina
-
Rest of Latin America
-
KEY PLAYERS
The Major Players are Astro Digital, AAC Clyde Space, Lockheed Martin Corporation, Planet Labs Inc., Surrey Satellite Technology Ltd., Swarm Technologies Inc., Tyvak Nano-Satellite Systems, Inc., L3Harris Technologies, Sierra Nevada Corpporation, Gomspace Inc, and other players
Astro Digital-Company Financial Analysis
| Report Attributes | Details |
|---|---|
| Market Size in 2023 | US$ 3.45 Billion |
| Market Size by 2031 | US$ 13.90 Billion |
| CAGR | CAGR of 19% From 2024 to 2031 |
| Base Year | 2023 |
| Forecast Period | 2024-2031 |
| Historical Data | 2020-2022 |
| Report Scope & Coverage | Market Size, Segments Analysis, Competitive Landscape, Regional Analysis, DROC & SWOT Analysis, Forecast Outlook |
| Key Segments | • By Orbit Type (Non-Polar Inclined, Polar, and Sun-Synchronous) • By End User (Civil, Government, Commercial, and Military) • By Application (Communications, Earth Observation, Space Science, Technology Demonstration, and Technology Development) • By Component (Hardware, Software & Data Processing, Launch Services, Space Services) • By Type (Nanosatellite, Microsatellite) • By Vertical (Government, Defense) |
| Regional Analysis/Coverage | North America (USA, Canada, Mexico), Europe (Germany, UK, France, Italy, Spain, Netherlands, Rest of Europe), Asia-Pacific (Japan, South Korea, China, India, Australia, Rest of Asia-Pacific), The Middle East & Africa (Israel, UAE, South Africa, Rest of Middle East & Africa), Latin America (Brazil, Argentina, Rest of Latin America) |
| Company Profiles | Astro Digital, AAC Clyde Space, Lockheed Martin Corporation, Planet Labs Inc., Surrey Satellite Technology Ltd., Swarm Technologies Inc., Tyvak Nano-Satellite Systems, Inc., L3Harris Technologies, Sierra Nevada Corpporation, Gomspace Inc, and other players. |
| DRIVERS | • Remote access |
| RESTRAINTS | • Access limited to space • High cost effective |
Frequently Asked Questions
The Nanosatellite and Microsatellite Market is segmented into 6 categories: By Type, By Orbit Type, By Components, By Verticals, By End-user, and By Application.
Asia-Pacific region is expected to grow with the highest CAGR during the forecast period.
The leading players in the Nanosatellite and Microsatellite Market include Astro Digital, AAC Clyde Space AB., Lockheed Martin Corporation, Planet Labs Inc., Surrey Satellite Technology Ltd., Swarm Technologies Inc., and Tyvak Nano-Satellite Systems, Inc., L3Harris Technologies, Sierra Nevada Corpporation, and Gomspace Inc.
The expected CAGR of the Nanosatellite and Microsatellite Market is 22% during the forecast period 2023-2030.
The market size for the Nanosatellite and Microsatellite Market was valued at USD 3.45 billion in 2023.
Get in Touch
