Native Advertising Market Report Scope & Overview:
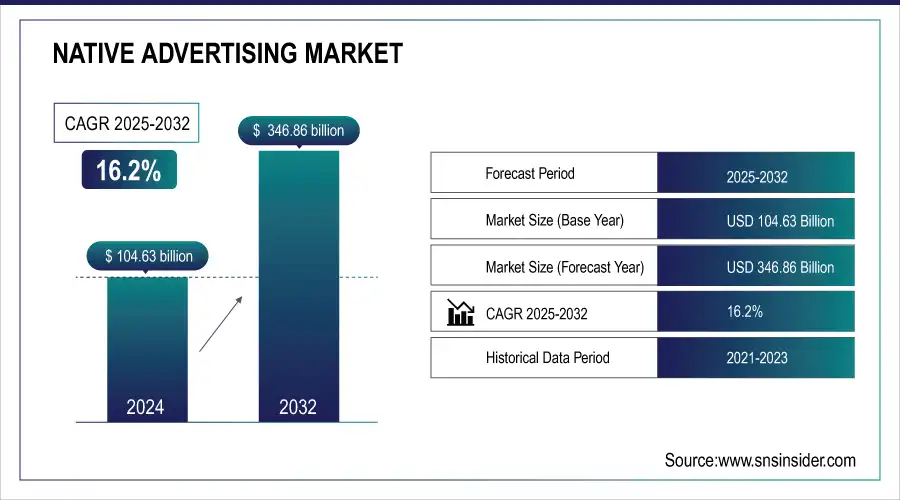
The Native Advertising Market size was valued at USD 104.63 billion in 2024 and is expected to reach USD 346.86 billion by 2032, expanding at a CAGR of 16.2% over the forecast period of 2025-2032.
With the non-intrusive, content-aligned form of marketing that enhances engagement and user trust, the advertising market is on the rise. It helps minimize ad fatigue and banner blindness by blending native ads seamlessly with digital content. Core formats include in-feed units, search ads, promoted listings, recommendation units, and in-ad custom content. Desktops continue to dominate the market, holding the largest share of device type, while mobile is the fastest-growing device type. Dominated by closed platforms like Facebook and Google, an increasing number of open and hybrid models have emerged.
To Get more information on Native Advertising Market - Request Free Sample Report
According to research, over 70% of native ad impressions occur on mobile, with users spending 52% more time engaging and conversion rates up to 18% higher than traditional display ads, highlighting native ads' effectiveness.
Market Size and Forecast
-
Market Size in 2024: USD 104.63 Billion
-
Market Size by 2032: USD 346.86 Billion
-
CAGR: 16.2% from 2025 to 2032
-
Base Year: 2024
-
Forecast Period: 2025–2032
-
Historical Data: 2021–2023
Native Advertising Market Trends
-
Rising demand for non-intrusive, engaging marketing content is driving native advertising adoption.
-
Integration with AI and programmatic platforms is enhancing targeting, personalization, and ROI measurement.
-
Growing use across social media, video, and mobile platforms is boosting market growth.
-
Increasing focus on content-driven marketing strategies is improving consumer engagement and brand recall.
-
Expansion of e-commerce and digital publishing is widening advertising opportunities.
-
Adoption of analytics and performance tracking tools is optimizing campaign effectiveness.
-
Collaborations between brands, publishers, and technology providers are accelerating innovation and campaign reach.
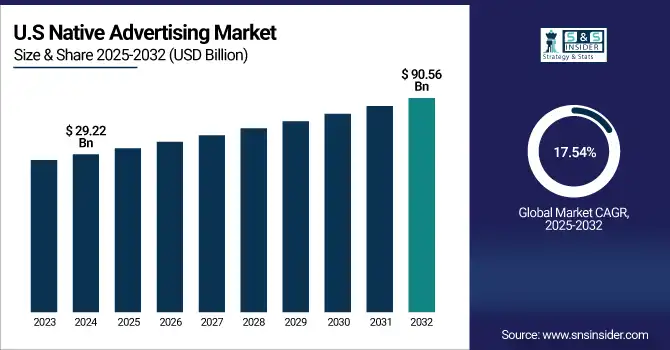
The U.S Native Advertising Market size reached USD 29.22 billion in 2024 and is expected to reach USD 90.56 billion in 2032 at a CAGR of 17.54% from 2025 to 2032.
With mature digital capabilities, well-developed infrastructure, social media saturation, and being the first country that adopt programmatic advertising, the U.S. is a global leader. With significant players like Taboola, Outbrain, and Share rampant in the region, it encourages innovation and leadership in the market. Rapid demand for non-disruptive advertising, popularity of mobile and video, and the increasing effectiveness of AI-powered content personalization are among the key drivers.
In addition to this, native ad formats are becoming increasingly relevant thanks to robust investments from advertisers in retail, finance, media, and beyond.
Native Advertising Market Growth Drivers:
-
Growing Demand for Personalized and Contextually Relevant Content Enhances User Engagement and Drives Market Expansion.
One of the most important drivers of growth for the native advertising sector is the immense need for personalized native advertisements and contextual relevance. Consumers are more attracted to user-centric advertisements If their ads are placed according to their interest and integrate well with their content consumption process. The effect of machine learning and AI is that AI and machine learning algorithms allow advertisers to provide the most appropriate native ads to the correct people to enhance user interaction and conversion. There is a current trend where personalization is being introduced and driven by AI, where platforms offer their ad space on a real-time basis based on the user's data points.
Native Advertising Market Restraints:
-
Concerns Over Transparency and Potential for Misleading Content Pose Challenges to Consumer Trust.
One of the biggest limitations of the native advertising ecosystem is the concern of transparency and deceptive content. If native ads are written too closely like an editorial for too little disclosure, that can confuse consumers and breed distrust in the publisher and advertiser. In light of this, however, regulatory bodies have once again underscored the need for marketers to clearly designate content as sponsored for the safety of consumers. However, inconsistencies in disclosure practices still exist, making it difficult to maintain consumer trust and putting native advertising sure to grow on the fast track, it is not adequately addressed.
Native Advertising Market Opportunities:
-
Integration of Programmatic Advertising Technologies Presents Opportunities for Enhanced Targeting and Efficiency.
The infusion of programmatic advertising technologies within native advertising platforms will provide considerable growth opportunities within the overall market. Programmatic advertising is an automated way of placing ads through data-driven techniques for precise targeting and efficient campaign management. This technology enables real-time bidding and dynamic ad insertion that can help ensure ads are hitting the right native delivery at the right time. The rise of programmatic native advertising has been noticed recently, and a lot of advertisers are adopting it as a perfect solution for campaigns, because they just need it to be scalable and cheap.
Native Advertising Market Challenges:
-
Challenges in Measuring Effectiveness and Return on Investment Complicate Campaign Optimization.
One of the biggest problems in the native advertising market is measuring campaign performance and ROI. However, most native ads attempt to blend into content, only making it more difficult to track user interactions where the conversion channel is the ad. Campaign performance is always impossible to measure without a shared metric or attribution model, this totally throws a wrench into optimization. Advertisers struggle to confirm native ad spend with uncertain backing, emphasizing the requirement for better measurement and transparency.
Native Advertising Market Segment Analysis
By Type, The In-feed Ad Units segment dominates the Native Advertising Market. The In-ad (custom content) segment is expected to grow fastest.
The In-feed Ad Units segment takes the lead with a 35.44% market share in 2024, supported by the ease of ad integration within social media feeds and content streams. The ads increase user engagement through the simulation of organic content, particularly on platforms such as Facebook, Instagram, and LinkedIn. Taboola and Outbrain have further developed their in-feed formats into dynamic, video-based, and interactive content. Rising mobile content consumption and the seamless, personalized nature of in-feed formats drive their dominance in native advertising across various native advertising industry and global markets.
The In-ad (custom content) segment will witness the fastest CAGR of 19.40% due to rising demand for visually engaging, immersive content that combines storytelling and brand. Such ad formats tend to incorporate native videos, branded articles, or interactive banners that have been created to fit the look and feel of the platform but serve the purpose of transmitting high-impact messages. Brands such as Nativo and Sharethrough are spending on AI to personalize creativity. Brands favor in-ad formats for high engagement and retention, driven by content-rich experiences and a focus on engagement over impressions.
By Platform, The Closed Platform segment dominates the Native Advertising Market. The Hybrid Platforms segment is expected to grow fastest.
The closed platform segment market leaders will have a 24.79% revenue share. Offering to hand-pick high-performing spaces and highly sophisticated target tools attracts marketers who are concerned about ROI. Massive user data, sophisticated ad algorithms, and ease of ad placements in-feed make closed ecosystems a prominent leader. Meta's ongoing investment in AI-driven ad personalization and LinkedIn's new Sponsored Content capabilities are significant advancements. As native advertising market companies focus on measurable and conversion-driven advertising, closed platforms are the preferred option of choice, solidifying their position as leaders in the native advertising universe.
The Hybrid platforms are expected to grow with the fastest CAGR of 22.25%, which combines the open nature of networks with the targeting abilities of closed platforms. This helps advertisers to reach a broader audience while retaining control of campaign-level settings and audience segments. MGID and Sharethrough are increasing hybrid capabilities by combining premium content delivery with real-time bidding. The growth of programmatic native advertisement and the higher demand for scalable and cost-effective campaigns are the primary factors.
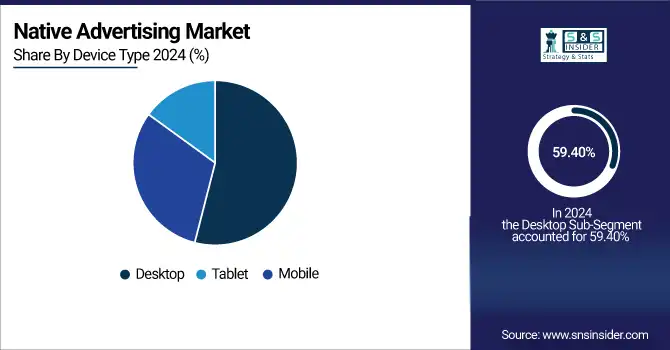
By Device Type, The Desktop segment dominates the Native Advertising Market. The Mobile segment is expected to grow fastest.
Desktop is the leading device type with 59.40% revenue share in 2024, owing mainly to its robust performance in content-dense settings such as news websites, blogs, and B2B sites. Native advertising on desktops enjoys greater screen space and longer dwell time. Companies like Outbrain and Taboola have pushed content recommendation widgets maximized for the desktop layout to boost clicks and interaction. Desktop ad formats still survive on the need for rich content and professional surfing. Content marketing is continuing to excel, and desktop is a reliable platform for long-form, context-based native advertising strategies.
The Mobile is the fastest-growing device type is expected to grow at a CAGR of 19.62% as the accessibility of smartphones and mobile-first media consumption continues to rise. Mobile native ads, particularly in-feed and in-app, boast better engagement and integration. TikTok and Instagram are also bolstering their native ad formats with AR and shoppable content. As users are spending increasingly more time on mobile devices using all sorts of apps, and advertisers are optimizing their content for smaller screen sizes, mobile native advertising has become a very strategic focus, growing rapidly across all verticals.
Native Advertising Market Regional Analysis
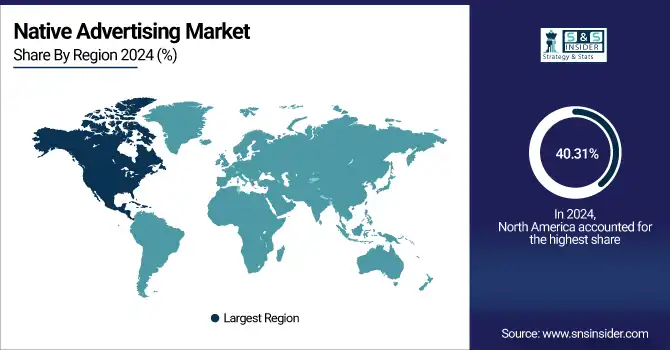
North America Native Advertising Market Insights
North America was the country accounting for the largest native advertising market share of 40.31%. The reason for this dominance is the developed digital infrastructure, high internet penetration, and diversified acceptance of content-based marketing strategies in the region. Top players like Taboola, Outbrain, and Verizon Media are major players in the region and are constantly innovating and entering content recommendation technologies.
The United States is the leading nation in this region owing to its enormous digital advertisement budget, mature tech ecosystem, and cutting-edge data-driven personalization strategies practiced by top brands.
Get Customized Report as per Your Business Requirement - Enquiry Now
Europe Native Advertising Market Insights
Europe is an established market for native advertising, with higher demand fueled by GDPR-compliant customized content and cross-channel initiatives. Robust media and publishing sectors in Germany, the UK, and France are driving higher use of native ad formats in digital media and e-commerce sites.
The UK leads the way in the region, thanks to its vibrant digital advertising ecosystem, regulatory transparency, and significant investments in content-led ad campaigns in finance, retail, and entertainment categories.
Asia Pacific Native Advertising Market Insights
Asia Pacific is projected to be the fastest-growing region with a CAGR of 20.28% in the forecast period. The native advertising market growth drivers are high-speed smartphones and internet penetration, growing digital consumption, and expanding e-commerce ecosystem, especially in India, China, and Indonesia. Smart brands are choosing native ads to fit into our lives by delivering relevant, seamless, and non-disruptive content targeting mobile-first consumers.
This region is dominated by China, to an unprecedented amount of users and a mobile-first economy, along with innovative integration of native ads into platforms, such as WeChat, Douyin, and Taobao.
Middle East & Africa and Latin America Native Advertising Market Insights
The Middle East & Africa and Latin America markets remain steady, but there are disparity in natural fenders on development for native advertising as led by the growth of the web infrastructure, increments in mobile penetration, and youth involvement. This is evidence that the UAE and Brazil are front-runners when it comes to high digital literacy and mobile-first content.
Native Advertising Market Competitive Landscape:
Taboola
Taboola is a global leader in native advertising and content discovery, enabling publishers and marketers to deliver personalized, AI-driven content recommendations. Its platform leverages advanced algorithms to enhance engagement, optimize monetization, and expand audience reach across digital channels. Taboola focuses on integrating generative AI, performance marketing, and cross-platform solutions to deliver measurable outcomes for advertisers and content providers worldwide.
-
2025 – Taboola introduced Realize, a new technology platform enabling performance advertising across publisher apps and sites extending beyond classic native formats to provide AI-driven, outcome-oriented campaigns at scale.
-
2025 – Taboola launched DeeperDive, a generative AI search engine for publishers (beta with Gannett/USA Today and The Independent), integrating AI-powered search with native ad monetization.
-
2025 – Taboola secured agreement with Microsoft to sell display ads across MSN, Outlook, Games, and Office Suite expanding beyond native offerings via its Realize platform.
-
2024 – Taboola signed a global deal with Apple to manage native advertising within Apple News and Stocks apps, widening its content-reselling distribution.
Key Players
Some of the Native Advertising Market Companies
-
Adyoulike
-
Polar
-
Dianomi
-
Ligatus
-
StackAdapt
-
Teads
-
ZergNet
-
Bidtellect
-
SmartyAds
-
RevX
-
NativeX
-
Adikteev
-
Celtra
-
Sovrn
-
Nativo Inc.
-
Taboola
-
Outbrain
-
Sharethrough
-
MGID
-
Verizon Media
| Report Attributes | Details |
|---|---|
| Market Size in 2024 | USD 104.63 Billion |
| Market Size by 2032 | USD 346.86 Billion |
| CAGR | CAGR of 16.2% From 2025 to 2032 |
| Base Year | 2024 |
| Forecast Period | 2025-2032 |
| Historical Data | 2021-2023 |
| Report Scope & Coverage | Market Size, Segments Analysis, Competitive Landscape, Regional Analysis, DROC & SWOT Analysis, Forecast Outlook |
| Key Segments | •By Type (In-feed Ad Units, Search Ads, Promoted Listings, Recommendation Units, In-ad (Custom Content)) •By Platform (Closed Platforms, Open Platforms, Hybrid Platforms) •By Device Type (Desktop, Mobile, Tablet) |
| Regional Analysis/Coverage | North America (US, Canada, Mexico), Europe (Germany, France, UK, Italy, Spain, Poland, Turkey, Rest of Europe), Asia Pacific (China, India, Japan, South Korea, Singapore, Australia, Rest of Asia Pacific), Middle East & Africa (UAE, Saudi Arabia, Qatar, South Africa, Rest of Middle East & Africa), Latin America (Brazil, Argentina, Rest of Latin America) |
| Company Profiles | Adyoulike, Polar, Dianomi, Ligatus, StackAdapt, Teads, ZergNet, Bidtellect, SmartyAds, RevX, NativeX, Adikteev, Celtra, Sovrn, Nativo Inc., Taboola, Outbrain, Sharethrough, MGID, Verizon Media |
Frequently Asked Questions
Ans: North America dominated the Native Advertising Market in 2024, accounting for the largest market share of 40.31%.
Ans: The In-feed Ad Units segment dominated the Native Advertising Market by type, holding a 35.44% market share in 2024.
Ans: The major growth factor driving the Native Advertising Market is the growing demand for personalized and contextually relevant content, which enhances user engagement and market expansion through AI and machine learning-enabled targeted ads.
Ans: The Native Advertising Market size was valued at USD 104.63 billion in 2024.
Ans: The expected CAGR of the Native Advertising Market from 2025 to 2032 is 16.2%.
Get in Touch
