Network-as-a-Service (Naas) Market Report Scope & Overview:
Get more nformation on Network-as-a-Service (Naas) Market - Request Sample Report
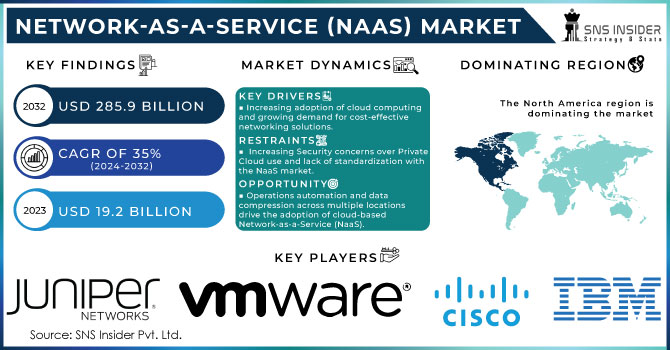
Network-as-a-Service (Naas) Market size was recorded at USD 19.2 billion in 2023 and is expected to reach USD 285.9 billion by 2032, growing at a CAGR of 35% over the forecast period of 2024-2032.
This rapid growth of the Network-as-a-Service market has mostly occurred due to widespread cloud-based services, and proliferation of IoT devices that require a decent network infrastructure, and a desire for scalable networks. Enterprises are adopting Network-as-a-Service to simplify operations, lower costs and provide the flexibility needed as business demands evolve. Additionally, the surge in remote work and digital transformation projects are also driving business needs for NaaS offerings. In Addition to that, Software-defined networking summarizes the lower-level functionality as it relates to network services as it is a major milestone in network architecture that helps enable unified communications and collaboration (UC&C) applications. It has evaded hardware approaches with software solutions and streamlined network management, and decouples the control and data plane, thus enabling programmable as well as software-driven networks. All these factors together contribute to accelerating the market growth of the NaaS model.
As most of the organizations have stated approx. 75% of their work is held by Cloud in 2023. Cisco System (2023) disclosed that cloud-native technologies such as DevOps & CloudOps are used in 91% of their apps. Accordingly, with over 30% of the market for cloud-based services, Amazon Web Service (AWS) is the industry leader.
Of the 33,000 cloud service providers worldwide, over 17,000 are situated in the United States. These companies use cutting-edge technology like artificial intelligence (AI), machine learning (ML), virtual reality (VR), and so forth.
Market Dynamics
Key Drivers:
- Increasing adoption of cloud computing and growing demand for cost-effective networking solutions.
As cloud-based services are growing in usage since more and more applications work in a browser. With increasing investments by SMEs, cloud computing is being adopted. Based on data provided by Cisco Systems, in 2023 the IP traffic was predicted to approach around 20,407 Exabytes for global cloud data centers. Therefore, the cloud services segment is anticipated to drive market growth. In addition, as businesses are becoming more reliant on cloud infrastructure services to operate their applications and store data in the cloud, there is a growing trend for business use of cloud-based VPN services.
Restraints:
- Increasing Security concerns over Private Cloud use and lack of standardization with the NaaS market.
Opportunities:
- Operations automation and data compression across several locations resulted in the switch to cloud-based Network-as-a-Service.
The primary drivers for cloud-based Network as a Service adoption are the need to enable enterprises seamless connectivity and access corporate resources from anywhere and anytime in a hybrid work model. Cost-efficient, scalable, and flexible networking solutions demand led by on-prem CapEx shifting to OpEx model used via cloud network infrastructure service providers such as Microsoft Azure Cloud Networking, AWS Virtual Private Networks & GCP Google Global Net. Latest technology trends such as Software Defined networks SDNs + programmable networking provide centralized management and control of network resources across multiple sites, and scalability to adapt as you grow or your business changes.
Challenges:
- Data privacy and security concerns
- Loss of WAN (wide area network) connection
The medium-sized companies with significant costs in distant, regional campuses and data center connectivity and security infrastructure, switching to NaaS will be a challenge and time-intensive task. Because Network-as-a-Service relies on fast, low-latency internet providers, any loss of the WAN connection can seriously hinder or even stop the operation of the business network.
Market Segmentation:
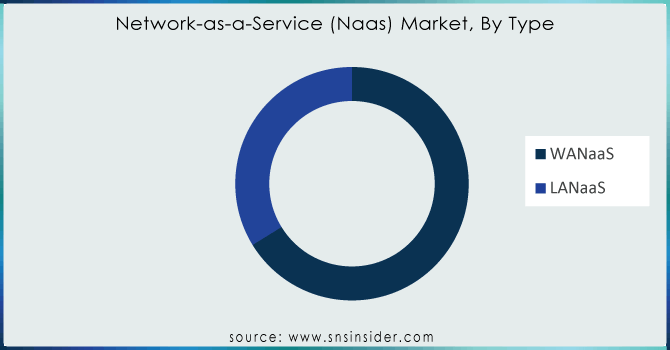
By Type
- WANaaS
- LANaaS
The WANaaS segment dominated the market with the largest revenue share of around 66.3% in 2023, as WAN services are one of the most commonly adopted solutions for enterprises across different industry sectors. All those are integrated resources that you use to build a chain of communication and finally bring together multiple mobile phones, and computers with remote offices into 1 system called the data center. WAN connection can be configured to support public or private gateway connections depending on the customer's requirements.
Need any customization research on Network-as-a-Service (Naas) Market - Enquire Now
By Enterprise Size
- Large Enterprises
- SMEs
The large enterprise segment led the global cloud orchestration market with more than 40% of revenue share in 2023, as organizations across sectors are increasingly moving towards NaaS and Platform as a Service. For large enterprises, virtualization enables companies to conduct extensive control over these resources and is especially useful for managing connections between distant branches of a company or rising support for the BYOD (bring your device) trend that allows users can also configure their devices. Since these technologies reduce the cost of investment and allow companies to invest in other areas, it is expected that networks as a service will be adopted faster.
The small and medium-sized enterprise segment is expected to grow at a significant rate, as it would not depend on high infrastructure costs. Low-cost cloud services and as-a-service models have been prompting SMEs to concentrate on digital transformation to benefit from emerging technologies like cloud, SDN, analytics –IoT.
By Industry
- Healthcare
- BFSI
- IT & Telecommunication
- Manufacturing
- Retail
- Others (Transportation)
The IT & Telecommunication segment led the market with 27% of the market share in 2023. Because of the large financial benefits, IT & telecommunication businesses are replacing their traditional enterprise networks with virtualization technology. This segment describes how cloud-enabled virtualization techniques can enable telecom carriers and network service providers to deliver services quickly over existing infrastructures while tackling bandwidth scarcity considerations at the same time. For Instance, Marco and Pouzin said the market will grow with cloud implementation and the adoption of networking technologies that enable service providers to offer on-demand network services, thus reducing capital expenditure through acquisition-cost savings for IT equipment.
The adoption of Network 5G in recent times has boosted the market as it reached around USD 2 billion in 2023. The major reason to push the adoption is the ongoing function of the Industries, Logistic, Healthcare, and smart cities.
By Application
- Bandwidth on Demand
- Virtual Private Network
- Cloud-based Services
- Wide Area network
- Others
Wide Area Network is the most dominant type of Technology holding a share of around 35% in 2023, due to growing use in Enterprise mobility. Mobile personal computers (smartphones, laptops, tablets) are entering corporate networks in increasing numbers. According to research, 63 million PCs were shipped in 2023, a 0.3% increase following a prolonged period of decrease in 2022.
The need for parallel processing across multiple servers and smooth interfaces to handle the increased size of mobile datasets. Hence this has resulted in an increased adoption rate of SD-WAN (software-defined wide area network). Transmissions from on-premise modules to cloud-based services and increasing investments in cloud-related services by several end-use industries are contributing towards the growth of the highest CAGR for the segment, i.e. Cloud-Based Services during the forecast period.
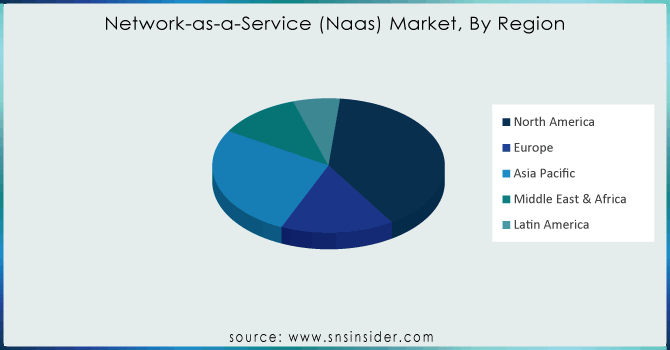
REGIONAL ANALYSIS:
North America is leading the world in revenue share with over 39.5% in 2023, due to the quick uptake of network solutions as a service. A significant component contributing to the growth of this market is the existence of many major companies, including Palo Alto, Amdocs, Megaport, Akamai, and Cisco Systems Inc. The big businesses are making significant investments in data center R&D, leveraging network infrastructure to support the expansion. NaaS use is projected to increase in the region due to the penetration of cloud computing, more advanced IT infrastructure, and a higher concentration of network virtualization solution providers.
It is anticipated that Asia Pacific will expand at a very high compound annual growth rate of 35.5%. A large and diverse customer base fuels the need forNaaS. Demand for NaaS is being driven by a large and diverse client base in China and India, which is also opening up new opportunities.
REGIONAL COVERAGE:
North America
- US
- Canada
- Mexico
Europe
- Eastern Europe
- Poland
- Romania
- Hungary
- Turkey
- Rest of Eastern Europe
- Western Europe
- Germany
- France
- UK
- Italy
- Spain
- Netherlands
- Switzerland
- Austria
- Rest of Western Europe
Asia Pacific
- China
- India
- Japan
- South Korea
- Vietnam
- Singapore
- Australia
- Rest of Asia Pacific
Middle East & Africa
- Middle East
- UAE
- Egypt
- Saudi Arabia
- Qatar
- Rest of Middle East
- Africa
- Nigeria
- South Africa
- Rest of Africa
Latin America
- Brazil
- Argentina
- Colombia
- Rest of Latin America
KEY PLAYERS:
The major key players are Juniper Networks, Inc., Cisco Systems, Inc., IBM Corporation, VMware Inc., NEC Corporation, Aryaka Networks, Inc., AT&T, Inc., Alcatel Lucent S.A, Brocade Communication Systems, Inc., Ciena Corporation & Other Players
Recent Developments:
- In March 2023, Akamai Technologies, a company that provides cloud-based storage technologies (and has been aggressively moving into stateful applications with Akamai EdgeWorkers), agreed to purchase Ondat.
- In May 2023, Cloudflare Inc. announced an arrangement with IT services company Kyndryl to deliver a new managed WAN as a service, offering through Cloud ISV on its edge network platform. They will be utilizing technology from Versa Networks, one of the market leaders in this arena today which is hosted at locations across the Canary Capital Islands (CCI).
| Report Attributes | Details |
|---|---|
| Market Size in 2023 | US$ 19.2 Billion |
| Market Size by 2032 | US$ 285.9 Billion |
| CAGR | CAGR 35 % From 2024 to 2032 |
| Base Year | 2023 |
| Forecast Period | 2024-2032 |
| Historical Data | 2020-2022 |
| Report Scope & Coverage | Market Size, Segments Analysis, Competitive Landscape, Regional Analysis, DROC & SWOT Analysis, Forecast Outlook |
| Key Segments | • By Type (WANaaS, LANaaS) • By Enterprise size (Large Enterprises, SMEs) • By Industry (Healthcare, BFSI, IT & Telecommunication, Manufacturing, Retail,Others) • By Application (Bandwidth on Demand, Virtual Private Network, Cloud-based Services, Wide Area network, Others) |
| Regional Analysis/Coverage | North America (US, Canada, Mexico), Europe (Eastern Europe [Poland, Romania, Hungary, Turkey, Rest of Eastern Europe] Western Europe] Germany, France, UK, Italy, Spain, Netherlands, Switzerland, Austria, Rest of Western Europe]), Asia Pacific (China, India, Japan, South Korea, Vietnam, Singapore, Australia, Rest of Asia Pacific), Middle East & Africa (Middle East [UAE, Egypt, Saudi Arabia, Qatar, Rest of Middle East], Africa [Nigeria, South Africa, Rest of Africa], Latin America (Brazil, Argentina, Colombia, Rest of Latin America) |
| Company Profiles | Cisco Systems, Inc., Juniper Networks, Inc., IBM Corporation, NEC Corporation, VMware Inc., Aryaka Networks, Inc., AT&T, Inc., Alcatel Lucent S.A, Brocade Communication Systems, Inc, Ciena Corporation |
| Key Drivers | • Accelerated cloud service adoption among major and small businesses. • For mission-critical business applications, high dependability and security are required. |
| Market Restraints | • In the NaaS market, there is a lack of uniformity. |
Frequently Asked Questions
Ans: - The primary growth tactics of Network-as-a-Service (Naas) market participants include merger and acquisition, business expansion, and product launch.
Ans: - North America dominates the managed network services market and will maintain its dominance throughout the projected period.
Ans: - The segments covered in the Network-as-a-Service (Naas) Market report for study are based on Type, Enterprise Size, and Types of Industry, and application.
Ans: - The Network-as-a-Service (Naas) Market is to grow at CAGR of 35 % over the forecast period 2024-2031
Ans: The Network-as-a-Service (Naas) Market was valued at USD 19.2 billion in 2023.
Get in Touch
