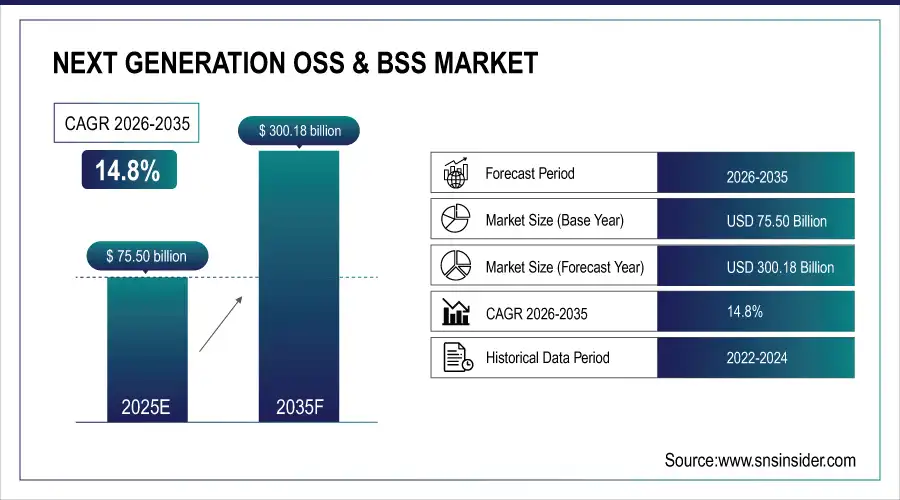
The Next Generation OSS & BSS Market size was valued at USD 65.77 billion in 2024 and is expected to reach USD 197.81 billion by 2032, expanding at a CAGR of 14.8% over the forecast period of 2025-2032.
Telecom operators across the globe are rapidly next next-generation OSS & BSS solutions to modernize their legacy systems and support advanced services such as 5G, 5G IoT, AI, cloud, real-time analytics, and big data-driven cloud monetization approach, leading to high growth in the telecom OSS and BSS market. These next-generation, cloud-native, AI-enabled, and API-driven platforms automate network operations and enhance customer engagement. OSS contains functions such as service assurance and network management, whereas BSS consists of billing, CRM, and revenue management. The advantage of reduced time to market, operational efficiency, and enhanced user experience is positively affecting the growth of the market. This aggregation of OSS and BSS into a single set of platforms is transforming how service providers innovate, scale, and compete in the highly connected digital landscape of the future.
According to research, in 2024, 62% of OSS/BSS deployments used microservices, driving 50 %+ process automation, 60% zero-touch provisioning, and 37% faster issue resolution through AI integration across telecom networks.
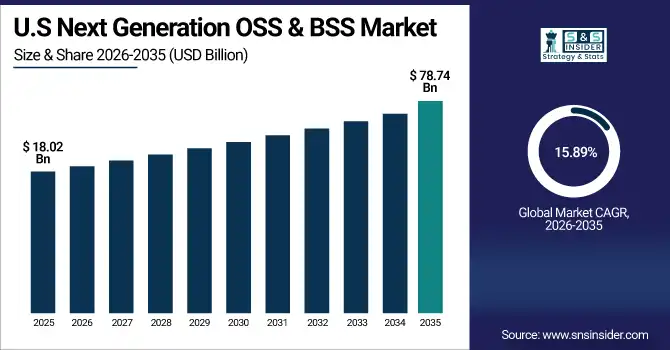
The U.S Next Generation OSS & BSS Market size reached USD 15.55 billion in 2024 and is expected to reach USD 43.67 billion in 2032 at a CAGR of 15.89% from 2025 to 2032.
A robust telecommunications infrastructure, early 5G adoption, and the presence of leading OSS/BSS vendors like Oracle and IBM, as well as Hewlett-Packard Enterprise, have made the U.S. a dominant global market. The major drivers for the market are growing requirements for real-time billing and customer management, ongoing digital transformation among telecom operators, and the emergence of AI, cloud-native platforms, and API-based ecosystems. Moreover, increasing investments in automation and virtualization of networks are fostering the uptake of scalable and flexible OSS/BSS solutions in the country.
Drivers:
Increasing Demand for Cloud-Native and AI-Integrated Platforms Accelerates Digital Transformation in Telecom Operations.
The combination of emerging Cloud-native OSS and BSS platforms, together with AI is driving fundamental changes in the ground dynamics of telecoms. These drive real-time analytics, dynamic service activation, predictive fault management enhanced customer engagement capabilities. As a result, 5G networks are growing extremely fast, pushing operators to provide agile, scalable, and intelligent telecommunications. Domestically, global trends are emerging with increasing partnerships of telecom providers with cloud vendors such as AWS and Microsoft Azure, as many operators are moving toward microservices-based architectures and containerized OSS/BSS solutions to future-proof their systems.
Restraints:
Legacy System Integration Complexity and High Transition Costs Restrict Technological Shift in Telecom Infrastructure.
The next generation OSS & BSS market growth is hindered by high complexity in integrating next-generation OSS and BSS with legacy systems. Most telecom operators run on legacy infrastructure, and it makes any project to modernize such infrastructure both technically complex and financially expensive. This shift typically involves costly upfront investments, long implementation times, and disruption risk to existing services. The challenges of transformation only complex when new platforms must also map to existing operational workflows and regulatory requirements. Smaller operators with limited IT budgets struggle to justify costly digital overhauls without immediate performance gains or measurable ROI.
Opportunities:
Expanding 5G Network Deployments Create Lucrative Opportunities for Scalable, Real-Time OSS and BSS Solutions.
The 5G rollout around the world is opening enormous windows for telecom operators to develop next-gen OSS and BSS platforms. With 5G bringing ultra-low latency, massive IoT, and network slicing, operators require extremely scalable, near real-time, and intelligent back-end systems to manage service complexity and customer expectations. Dynamic pricing is a new model that comes with modern BSS solutions, which unlock new revenue streams like network-as-a-service and edge computing. Key trends include growing OSS/BSS automation for 5G monetization and adoption of open architectures like TM Forum’s Open Digital Framework.
Challenges:
Rising Cybersecurity Risks and Data Privacy Concerns Pose Major Challenges for Platform Adoption and Regulatory Compliance.
With telecom operators digitizing their operations, customer data flowing through cloud-native OSS and BSS platforms, enterprise customers gaining more control, and the growth of the IoT ecosystem, concerns about cybersecurity and data privacy have grown tremendously. Cyber-attacks are becoming more common on next-generation systems due to their open API-dependent architecture. Legacy system integration complexity is a key restraint in the Next Generation OSS & BSS Industry.
Furthermore, the associated strict regulations like GDPR, CCPA and other vertical-specific data localization laws require effective compliance, which adds to the operational overhead.
By Architecture
The Service Fulfilment segment will account for the largest revenue share of 23.86%, as telecom operators start adopting automated solutions to meet demand requirements. Cloud Native and AI imbued, Intelligent service fulfilment platforms have been launched by large organisations such as Amdocs and Ericsson, who are relishing orchestration and provisioning augmentation. Such innovations allow new services to be rolled out faster, driving down operational costs while improving customer satisfaction.
The Account Management segment is expected to grow at the fastest CAGR of 18.35% as prominent players are focusing on supporting advanced customer data management, billing precision, and service personalisation. Analysts aside, dynamic pricing touted as AI account management automation is making its way into the enterprise in the form of accounts receivable and collections solutions from vendors like Oracle and IBM that automate invoice delivery and customer engagement to create an immediacy index affecting revenue assurance and churn.
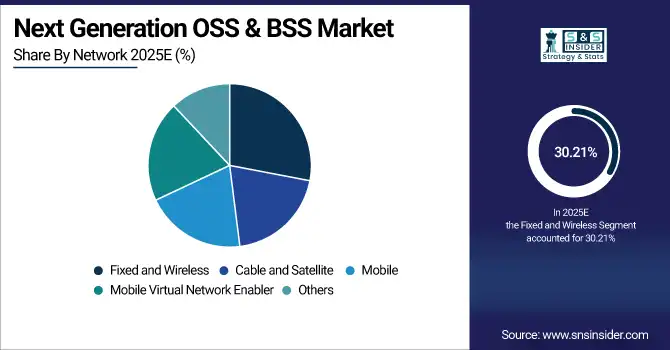
By Network
The Fixed and Wireless segment has the largest next-generation OSS & BSS market share at 30.21% in 2024, fueled by strong broadband penetration and wireless proliferation. Integrated next-generation OSS/BSS market Companies like Huawei and Nokia have this integrated OSS/BSS for wireless and fixed-optical networks, delivering broadband services and doing network service deliveries. This segment benefits from an increased demand for high-speed internet, as seen by the remote work trend and smart city initiatives. Those drivers are in line with the next generation OSS & BSS market trends of scaling flexible solutions to support heterogeneous network infrastructures.
The Mobile Virtual Network Enabler (MVNE) segment is the fastest-growing at a 21.27% CAGR as virtualised network services gain traction and mobile virtual network operators deploy in more regions. Here has been the emergence of MVNE-specific OSS/BSS platforms from companies like Sigma Software, or configuration agnostic OSS/BSS platforms focused on MVNE capabilities from companies like CSG Systems, focusing on multi-tenant, metered billing and rapid service launch. This growth can be attributed to telecom providers needing to diversify revenue streams and reduce CapEx through virtualisation.
North America is expected to continue its Lead Position in the OSS & BSS Market with a Market Share of 39.30% in 2024. The leadership of the region is somewhat due to the availability of advanced telecommunication infrastructure in this region, the early adoption of 5G technology in this region, and the presence of major OSS/BSS solution providers such as Oracle, IBM, and Hewlett-Packard Enterprise.
The U.S. dominates North America due to its leadership in telecom technology innovation, early 5G rollouts, and the presence of key OSS/BSS vendors, driving rapid adoption of advanced digital platforms.
Asia Pacific is the fastest-growing telecommunications region with a CAGR of 18.29% over the forecast period, attributable to increasing urbanization, an increase in mobile subscriber areas, and 5G network rollout in China, India, and Southeast Asia. To accommodate the exponential rise in data traffic generation and the proliferation of complex and diverse service demands, governments and private players are investing heavily in digital infrastructure and cloud-native OSS/BSS platforms.
China is dominating the Asia Pacific region due to its vast mobile subscriber base, aggressive 5G rollout, strong government support, and leading telecom firms like Huawei driving OSS/BSS advancements.
Europe is moving ahead on Network Virtualization and Automation with GDPR-Compliant OSS/BSS increasing 5G deployments and AI adoption, spurring investment in scalable and interoperable platforms to improve operational efficiency and enhance customer experience across wide service portfolios.
Germany leads Europe owing to its robust telecom infrastructure, extensive 5G coverage, and significant investments by operators to modernize OSS/BSS systems for improved service delivery.
The Middle East & Africa and Latin America are also moving ahead in developing telecom infrastructure through 5G, cloud-native OSS/BSS adoption, and digital initiatives. Regional leaders UAE and Brazil, the UAE leads the MENA region, supported by significant investments, growth in mobile, and a proactive approach towards digital transformation.
The major key players of the Next Generation OSS & BSS Market are Hewlett-Packard Enterprise Development LP, Huawei Technologies Co., Ltd., Capgemini, Accenture, Amdocs, Oracle, IBM, CSG Systems, Inc., Sigma Software, CHR Solutions, and others.
In September 2024, Amdocs introduced its Cloud BSS Platform, combining automation, real-time analytics, and customer journey orchestration that empowers telecom operators to provide a better customer experience and faster service deployment.
In June 2024, IBM partnered with Telefónica Tech to strengthen AI, Analytics, and Data Governance Solutions in Spain. The two organizations plan to deliver the open hybrid multi-cloud platform powered by IBM Watson AI and Data platform
Report Attributes | Details |
---|---|
Market Size in 2024 | USD 65.77 Billion |
Market Size by 2032 | USD 197.81 Billion |
CAGR | CAGR of 14.8% From 2025 to 2032 |
Base Year | 2024 |
Forecast Period | 2025-2032 |
Historical Data | 2021-2023 |
Report Scope & Coverage | Market Size, Segments Analysis, Competitive Landscape, Regional Analysis, DROC & SWOT Analysis, Forecast Outlook |
Key Segments | •By Architecture (revenue management, service fulfilment, customer management, account management, service assurance, network management systems) •By Network (cable and satellite, fixed and wireless, mobile, mobile virtual network enabler, others) |
Regional Analysis/Coverage | North America (US, Canada, Mexico), Europe (Germany, France, UK, Italy, Spain, Poland, Turkey, Rest of Europe), Asia Pacific (China, India, Japan, South Korea, Singapore, Australia, Rest of Asia Pacific), Middle East & Africa (UAE, Saudi Arabia, Qatar, South Africa, Rest of Middle East & Africa), Latin America (Brazil, Argentina, Rest of Latin America) |
Company Profiles | Hewlett-Packard Enterprise Development LP, Huawei Technologies Co., Ltd., Capgemini, Accenture, Amdocs, Oracle, IBM, CSG Systems, Inc., Sigma Software, CHR Solutions,and others. |
Ans: The market is expected to grow at a CAGR of 14.8% during the forecast period from 2025 to 2032.
Ans: The market size was valued at USD 65.77 billion in 2024.
Ans: Increasing demand for cloud-native, AI-integrated platforms accelerating telecom digital transformation and 5G network expansion is the primary growth driver of the market.
Ans: The Service Fulfilment segment dominated with the largest revenue share of 23.86%, as telecom operators adopt automated, cloud-native, and AI-driven solutions to enhance service delivery.
Ans: North America dominated with a market share of 39.30%, driven by advanced telecom infrastructure, early 5G adoption, and major vendors like Oracle, IBM, and Hewlett-Packard Enterprise.
Table of Content
1. Introduction
1.1 Market Definition
1.2 Scope (Inclusion and Exclusions)
1.3 Research Assumptions
2. Executive Summary
2.1 Market Overview
2.2 Regional Synopsis
2.3 Competitive Summary
3. Research Methodology
3.1 Top-Down Approach
3.2 Bottom-up Approach
3.3. Data Validation
3.4 Primary Interviews
4. Market Dynamics Impact Analysis
4.1 Market Driving Factors Analysis
4.1.2 Drivers
4.1.2 Restraints
4.1.3 Opportunities
4.1.4 Challenges
4.2 PESTLE Analysis
4.3 Porter’s Five Forces Model
5. Statistical Insights and Trends Reporting
5.1 Time-to-Market Acceleration Metrics
5.2 Zero-Touch Automation Impact
5.3 AI/ML-Driven Decision Support Penetration
5.4 Cloud-Native Transition Rate
6. Competitive Landscape
6.1 List of Major Companies, By Region
6.2 Market Share Analysis, By Region
6.3 Product Benchmarking
6.3.1 Product specifications and features
6.3.2 Pricing
6.4 Strategic Initiatives
6.4.1 Marketing and promotional activities
6.4.2 Distribution and supply chain strategies
6.4.3 Expansion plans and new product launches
6.4.4 Strategic partnerships and collaborations
6.5 Technological Advancements
6.6 Market Positioning and Branding
7. Next Generation OSS & BSS Market Segmentation, By Architecture
7.1 Chapter Overview
7.2 Revenue Management
7.2.1 50.8 mm or 2 " Market Trends Analysis (2021-2032)
7.2.2 50.8 mm or 2 " Market Size Estimates and Forecasts to 2032 (USD Million)
7.3 Service Fulfilment
7.3.1 Service Fulfilment" Market Trends Analysis (2021-2032)
7.3.2 Service Fulfilment" Market Size Estimates and Forecasts to 2032 (USD Million)
7.4.1Customer Management
7.4.1 1Customer Management Market Trends Analysis (2021-2032)
7.4.2 1Customer Management Market Size Estimates and Forecasts to 2032 (USD Million)
7.5.1Account Management
7.5.1 1 Account Management Market Trends Analysis (2021-2032)
7.5.2 1Account Management Market Size Estimates and Forecasts to 2032 (USD Million)
7.6.1Service Assurance
7.6.1 Service Assurance Market Trends Analysis (2021-2032)
7.6.2 Service Assurance Market Size Estimates and Forecasts to 2032 (USD Million)
7.7.1 Network Management Systems
7.7.1 Network Management Systems Market Trends Analysis (2021-2032)
7.7.2 Network Management Systems Market Size Estimates and Forecasts to 2032 (USD Million)
8. Next Generation OSS & BSS Market Segmentation, By Network
8.1 Chapter Overview
8.2 Cable and Satellite
8.2.1 Cable and Satellite Market Trends Analysis (2021-2032)
8.2.2 Cable and Satellite Market Size Estimates and Forecasts to 2032 (USD Million)
8.3 Fixed and Wireless
8.3.1 Fixed and Wireless Market Trends Analysis (2021-2032)
8.3.2 Fixed and Wireless Market Size Estimates and Forecasts to 2032 (USD Million)
8.4 Mobile
8.4.1 Mobile Market Trends Analysis (2021-2032)
8.4.2 Mobile Market Size Estimates and Forecasts to 2032 (USD Million)
8.5 Mobile Virtual Network Enabler (MVNE)
8.5.1 Mobile Virtual Network Enabler (MVNE) Market Trends Analysis (2021-2032)
8.5.2 Mobile Virtual Network Enabler (MVNE) Market Size Estimates and Forecasts to 2032 (USD Million)
8.6 Others
8.6.1 Others Market Trends Analysis (2021-2032)
8.6.2 Others Market Size Estimates and Forecasts to 2032 (USD Million)
9. Regional Analysis
9.1 Chapter Overview
9.2 North America
9.2.1 Trends Analysis
9.2.2 North America Next Generation OSS & BSS Market Estimates and Forecasts, by Country (2021-2032) (USD Million)
9.2.3 North America Next Generation OSS & BSS Market Estimates and Forecasts, By Architecture (2021-2032) (USD Million)
9.2.4 North America Next Generation OSS & BSS Market Estimates and Forecasts, By Network (2021-2032) (USD Million)
9.2.5 USA
9.2.5.1 USA Next Generation OSS & BSS Market Estimates and Forecasts, By Architecture (2021-2032) (USD Million)
9.2.5.2 USA Next Generation OSS & BSS Market Estimates and Forecasts, By Network (2021-2032) (USD Million)
9.2.6 Canada
9.2.6.1 Canada Next Generation OSS & BSS Market Estimates and Forecasts, By Architecture (2021-2032) (USD Million)
9.2.6.2 Canada Next Generation OSS & BSS Market Estimates and Forecasts, By Network (2021-2032) (USD Million)
9.2.7 Mexico
9.2.7.1 Mexico Next Generation OSS & BSS Market Estimates and Forecasts, By Architecture (2021-2032) (USD Million)
9.2.7.2 Mexico Next Generation OSS & BSS Market Estimates and Forecasts, By Network (2021-2032) (USD Million)
9.3 Europe
9.3.1 Trends Analysis
9.3.2 Europe Next Generation OSS & BSS Market Estimates and Forecasts, by Country (2021-2032) (USD Million)
9.3.3 Europe Next Generation OSS & BSS Market Estimates and Forecasts, By Architecture (2021-2032) (USD Million)
9.3.4 Europe Next Generation OSS & BSS Market Estimates and Forecasts, By Network (2021-2032) (USD Million)
9.3.5 Germany
9.3.5.1 Germany Next Generation OSS & BSS Market Estimates and Forecasts, By Architecture (2021-2032) (USD Million)
9.3.5.2 Germany Next Generation OSS & BSS Market Estimates and Forecasts, By Network (2021-2032) (USD Million)
9.3.6 France
9.3.6.1 France Next Generation OSS & BSS Market Estimates and Forecasts, By Architecture (2021-2032) (USD Million)
9.3.6.2 France Next Generation OSS & BSS Market Estimates and Forecasts, By Network (2021-2032) (USD Million)
9.3.7 UK
9.3.7.1 UK Next Generation OSS & BSS Market Estimates and Forecasts, By Architecture (2021-2032) (USD Million)
9.3.7.2 UK Next Generation OSS & BSS Market Estimates and Forecasts, By Network (2021-2032) (USD Million)
9.3.8 Italy
9.3.8.1 Italy Next Generation OSS & BSS Market Estimates and Forecasts, By Architecture (2021-2032) (USD Million)
9.3.8.2 Italy Next Generation OSS & BSS Market Estimates and Forecasts, By Network (2021-2032) (USD Million)
9.3.9 Spain
9.3.9.1 Spain Next Generation OSS & BSS Market Estimates and Forecasts, By Architecture (2021-2032) (USD Million)
9.3.9.2 Spain Next Generation OSS & BSS Market Estimates and Forecasts, By Network (2021-2032) (USD Million)
9.3.10 Poland
9.3.10.1 Poland Next Generation OSS & BSS Market Estimates and Forecasts, By Architecture (2021-2032) (USD Million)
9.3.10.2 Poland Next Generation OSS & BSS Market Estimates and Forecasts, By Network (2021-2032) (USD Million)
9.3.11 Turkey
9.3.11.1 France Next Generation OSS & BSS Market Estimates and Forecasts, By Architecture (2021-2032) (USD Million)
9.3.11.2 France Next Generation OSS & BSS Market Estimates and Forecasts, By Network (2021-2032) (USD Million)
9.3.12 Rest of Europe
9.3.12.1 UK Next Generation OSS & BSS Market Estimates and Forecasts, By Architecture (2021-2032) (USD Million)
9.3.12.2 UK Next Generation OSS & BSS Market Estimates and Forecasts, By Network (2021-2032) (USD Million)
9.4 Asia-Pacific
9.4.1 Trends Analysis
9.4.2 Asia-Pacific Next Generation OSS & BSS Market Estimates and Forecasts, by Country (2021-2032) (USD Million)
9.4.3 Asia-Pacific Next Generation OSS & BSS Market Estimates and Forecasts, By Architecture (2021-2032) (USD Million)
9.4.4 Asia-Pacific Next Generation OSS & BSS Market Estimates and Forecasts, By Network (2021-2032) (USD Million)
9.4.5 China
9.4.5.1 China Next Generation OSS & BSS Market Estimates and Forecasts, By Architecture (2021-2032) (USD Million)
9.4.5.2 China Next Generation OSS & BSS Market Estimates and Forecasts, By Network (2021-2032) (USD Million)
9.4.6 India
9.4.5.1 India Next Generation OSS & BSS Market Estimates and Forecasts, By Architecture (2021-2032) (USD Million)
9.4.5.2 India Next Generation OSS & BSS Market Estimates and Forecasts, By Network (2021-2032) (USD Million)
9.4.5 Japan
9.4.5.1 Japan Next Generation OSS & BSS Market Estimates and Forecasts, By Architecture (2021-2032) (USD Million)
9.4.5.2 Japan Next Generation OSS & BSS Market Estimates and Forecasts, By Network (2021-2032) (USD Million)
9.4.6 South Korea
9.4.6.1 South Korea Next Generation OSS & BSS Market Estimates and Forecasts, By Architecture (2021-2032) (USD Million)
9.4.6.2 South Korea Next Generation OSS & BSS Market Estimates and Forecasts, By Network (2021-2032) (USD Million)
9.4.7 Singapore
9.4.7.1 Singapore Next Generation OSS & BSS Market Estimates and Forecasts, By Architecture (2021-2032) (USD Million)
9.4.7.2 Singapore Next Generation OSS & BSS Market Estimates and Forecasts, By Network (2021-2032) (USD Million)
9.4.8 Australia
9.4.8.1 Australia Next Generation OSS & BSS Market Estimates and Forecasts, By Architecture (2021-2032) (USD Million)
9.4.8.2 Australia Next Generation OSS & BSS Market Estimates and Forecasts, By Network (2021-2032) (USD Million)
9.4.9 Rest of Asia-Pacific
9.4.9.1 Rest of Asia-Pacific Next Generation OSS & BSS Market Estimates and Forecasts, By Architecture (2021-2032) (USD Million)
9.4.9.2 Rest of Asia-Pacific Next Generation OSS & BSS Market Estimates and Forecasts, By Network (2021-2032) (USD Million)
9.5 Middle East and Africa
9.5.1 Trends Analysis
9.5.2 Middle East and Africa Next Generation OSS & BSS Market Estimates and Forecasts, by Country (2021-2032) (USD Million)
9.5.3 Middle East and Africa Next Generation OSS & BSS Market Estimates and Forecasts, By Architecture (2021-2032) (USD Million)
9.5.4 Middle East and Africa Next Generation OSS & BSS Market Estimates and Forecasts, By Network (2021-2032) (USD Million)
9.5.5 UAE
9.5.5.1 UAE Next Generation OSS & BSS Market Estimates and Forecasts, By Architecture (2021-2032) (USD Million)
9.5.5.2 UAE Next Generation OSS & BSS Market Estimates and Forecasts, By Network (2021-2032) (USD Million)
9.5.6 Saudi Arabia
9.5.6.1 Saudi Arabia Next Generation OSS & BSS Market Estimates and Forecasts, By Architecture (2021-2032) (USD Million)
9.5.6.2 Saudi Arabia Next Generation OSS & BSS Market Estimates and Forecasts, By Network (2021-2032) (USD Million)
9.5.7 Qatar
9.5.7.1 Qatar Next Generation OSS & BSS Market Estimates and Forecasts, By Architecture (2021-2032) (USD Million)
9.5.7.2 Qatar Next Generation OSS & BSS Market Estimates and Forecasts, By Network (2021-2032) (USD Million)
9.5.8 South Africa
9.5.8.1 South Africa Next Generation OSS & BSS Market Estimates and Forecasts, By Architecture (2021-2032) (USD Million)
9.5.8.2 South Africa Next Generation OSS & BSS Market Estimates and Forecasts, By Network (2021-2032) (USD Million)
9.5.9 Rest of Middle East & Africa
9.5.9.1 Rest of Middle East & Africa Next Generation OSS & BSS Market Estimates and Forecasts, By Architecture (2021-2032) (USD Million)
9.5.9.2 Rest of Middle East & Africa Next Generation OSS & BSS Market Estimates and Forecasts, By Network (2021-2032) (USD Million)
9.6 Latin America
9.6.1 Trends Analysis
9.6.2 Latin America Next Generation OSS & BSS Market Estimates and Forecasts, by Country (2021-2032) (USD Million)
9.6.3 Latin America Next Generation OSS & BSS Market Estimates and Forecasts, By Architecture (2021-2032) (USD Million)
9.6.4 Latin America Next Generation OSS & BSS Market Estimates and Forecasts, By Network (2021-2032) (USD Million)
9.6.5 Brazil
9.6.5.1 Brazil Next Generation OSS & BSS Market Estimates and Forecasts, By Architecture (2021-2032) (USD Million)
9.6.5.2 Brazil Next Generation OSS & BSS Market Estimates and Forecasts, By Network (2021-2032) (USD Million)
9.6.6 Argentina
9.6.6.1 Argentina Next Generation OSS & BSS Market Estimates and Forecasts, By Architecture (2021-2032) (USD Million)
9.6.6.2 Argentina Next Generation OSS & BSS Market Estimates and Forecasts, By Network (2021-2032) (USD Million)
9.6.7 Rest of Latin America
9.6.7.1 Rest of Latin America Next Generation OSS & BSS Market Estimates and Forecasts, By Architecture (2021-2032) (USD Million)
9.6.7.2 Rest of Latin America Next Generation OSS & BSS Market Estimates and Forecasts, By Network (2021-2032) (USD Million)
10. Company Profiles
10.1 Hewlett-Packard Enterprise Development LP
10.1.1 Company Overview
10.1.2 Financial
10.1.3 Products/ Services Offered
10.1.4 SWOT Analysis
10.2 Huawei Technologies Co., Ltd.
10.2.1 Company Overview
10.2.2 Financial
10.2.3 Products/ Services Offered
10.2.4 SWOT Analysis
10.3 Capgemini
10.3.1 Company Overview
10.3.2 Financial
10.3.3 Products/ Services Offered
10.3.4 SWOT Analysis
10.4 Accenture
10.4.1 Company Overview
10.4.2 Financial
10.4.3 Products/ Services Offered
10.4.4 SWOT Analysis
10.5 Amdocs
10.5.1 Company Overview
10.5.2 Financial
10.5.3 Products/ Services Offered
10.5.4 SWOT Analysis
10.6 Oracle
10.6.1 Company Overview
10.6.2 Financial
10.6.3 Products/ Services Offered
10.6.4 SWOT Analysis
10.7 IBM
10.7.1 Company Overview
10.7.2 Financial
10.7.3 Products/ Services Offered
10.7.4 SWOT Analysis
10.8 CSG Systems, Inc.
10.8.1 Company Overview
10.8.2 Financial
10.8.3 Products/ Services Offered
10.8.4 SWOT Analysis
10.9 Sigma Software
10.9.1 Company Overview
10.9.2 Financial
10.9.3 Products/ Services Offered
10.9.4 SWOT Analysis
10.10 CHR Solutions
10.10.1 Company Overview
10.10.2 Financial
10.10.3 Products/ Services Offered
10.10.4 SWOT Analysis
11. Use Cases and Best Practices
12. Conclusion
An accurate research report requires proper strategizing as well as implementation. There are multiple factors involved in the completion of good and accurate research report and selecting the best methodology to compete the research is the toughest part. Since the research reports we provide play a crucial role in any company’s decision-making process, therefore we at SNS Insider always believe that we should choose the best method which gives us results closer to reality. This allows us to reach at a stage wherein we can provide our clients best and accurate investment to output ratio.
Each report that we prepare takes a timeframe of 350-400 business hours for production. Starting from the selection of titles through a couple of in-depth brain storming session to the final QC process before uploading our titles on our website we dedicate around 350 working hours. The titles are selected based on their current market cap and the foreseen CAGR and growth.
The 5 steps process:
Step 1: Secondary Research:
Secondary Research or Desk Research is as the name suggests is a research process wherein, we collect data through the readily available information. In this process we use various paid and unpaid databases which our team has access to and gather data through the same. This includes examining of listed companies’ annual reports, Journals, SEC filling etc. Apart from this our team has access to various associations across the globe across different industries. Lastly, we have exchange relationships with various university as well as individual libraries.
Step 2: Primary Research
When we talk about primary research, it is a type of study in which the researchers collect relevant data samples directly, rather than relying on previously collected data. This type of research is focused on gaining content specific facts that can be sued to solve specific problems. Since the collected data is fresh and first hand therefore it makes the study more accurate and genuine.
We at SNS Insider have divided Primary Research into 2 parts.
Part 1 wherein we interview the KOLs of major players as well as the upcoming ones across various geographic regions. This allows us to have their view over the market scenario and acts as an important tool to come closer to the accurate market numbers. As many as 45 paid and unpaid primary interviews are taken from both the demand and supply side of the industry to make sure we land at an accurate judgement and analysis of the market.
This step involves the triangulation of data wherein our team analyses the interview transcripts, online survey responses and observation of on filed participants. The below mentioned chart should give a better understanding of the part 1 of the primary interview.
Part 2: In this part of primary research the data collected via secondary research and the part 1 of the primary research is validated with the interviews from individual consultants and subject matter experts.
Consultants are those set of people who have at least 12 years of experience and expertise within the industry whereas Subject Matter Experts are those with at least 15 years of experience behind their back within the same space. The data with the help of two main processes i.e., FGDs (Focused Group Discussions) and IDs (Individual Discussions). This gives us a 3rd party nonbiased primary view of the market scenario making it a more dependable one while collation of the data pointers.
Step 3: Data Bank Validation
Once all the information is collected via primary and secondary sources, we run that information for data validation. At our intelligence centre our research heads track a lot of information related to the market which includes the quarterly reports, the daily stock prices, and other relevant information. Our data bank server gets updated every fortnight and that is how the information which we collected using our primary and secondary information is revalidated in real time.
Step 4: QA/QC Process
After all the data collection and validation our team does a final level of quality check and quality assurance to get rid of any unwanted or undesired mistakes. This might include but not limited to getting rid of the any typos, duplication of numbers or missing of any important information. The people involved in this process include technical content writers, research heads and graphics people. Once this process is completed the title gets uploader on our platform for our clients to read it.
Step 5: Final QC/QA Process:
This is the last process and comes when the client has ordered the study. In this process a final QA/QC is done before the study is emailed to the client. Since we believe in giving our clients a good experience of our research studies, therefore, to make sure that we do not lack at our end in any way humanly possible we do a final round of quality check and then dispatch the study to the client.
Key Segments:
By Architecture
Revenue Management
Service Fulfilment
Customer Management
Account Management
Service Assurance
Network Management Systems
By Network
Cable and Satellite
Fixed and Wireless
Mobile
Mobile Virtual Network Enabler (MVNE)
Others
Request for Segment Customization as per your Business Requirement: Segment Customization Request
Regional Coverage:
North America
US
Canada
Mexico
Europe
Germany
France
UK
Italy
Spain
Poland
Turkey
Rest of Europe
Asia Pacific
China
India
Japan
South Korea
Singapore
Australia
Rest of Asia Pacific
Middle East & Africa
UAE
Saudi Arabia
Qatar
South Africa
Rest of Middle East & Africa
Latin America
Brazil
Argentina
Rest of Latin America
Request for Country Level Research Report: Country Level Customization Request
Available Customization
With the given market data, SNS Insider offers customization as per the company’s specific needs. The following customization options are available for the report:
Detailed Volume Analysis
Criss-Cross segment analysis (e.g. Product X Application)
Competitive Product Benchmarking
Geographic Analysis
Additional countries in any of the regions
Customized Data Representation
Detailed analysis and profiling of additional market players