Non-Viral Gene Delivery Technologies Market Report Scope & Overview:

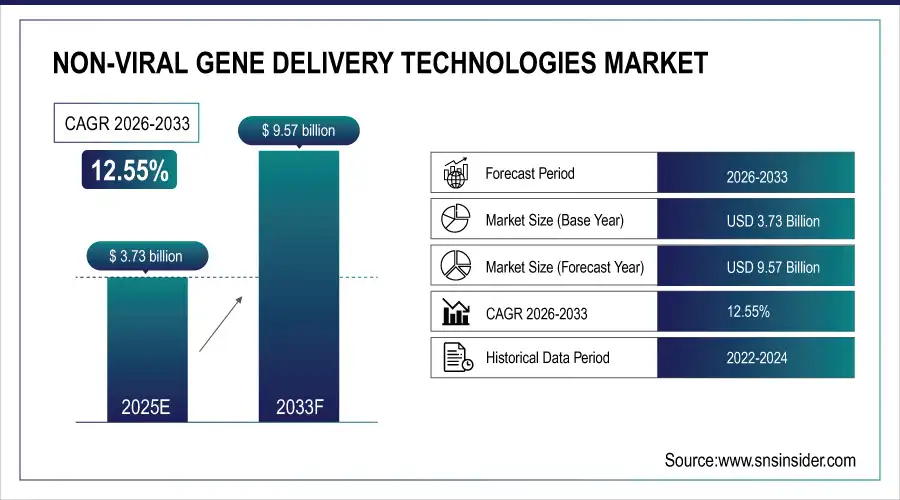
The non-viral gene delivery technologies market size was valued at USD 3.73 billion in 2024 and is expected to reach USD 9.57 billion by 2032, growing at a CAGR of 12.55% over the forecast period of 2025-2032.

The global non-viral gene delivery technologies market is growing rapidly due to the continuous increase in demand for these non-covalent alternatives to gene therapy is a significant factor contributing to the existence of the non-viral gene delivery technologies. These platforms described below provide a less immunogenic and safer profile as compared to viral vectors, which makes them suitable for therapeutic and research purposes. A growing number of applications of nanotechnology, a boom in biotechnology research & development, and an increase in the occurrence of genetic disorders further propel the adoption of molecular diagnostics. In addition, the change from in vitro to in vivo and ex vivo delivery methods is likely to allow global penetration of the clinical market.
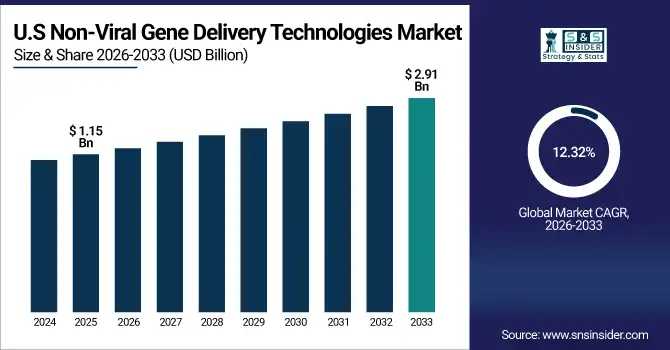
The U.S. non-viral gene delivery technologies market size was valued at USD 1.15 billion in 2024 and is expected to reach USD 2.91 billion by 2032, growing at a CAGR of 12.32% over the forecast period of 2025-2032.

The U.S. dominated the North American non-viral gene delivery technologies market owing to the presence of a well-established biotechnology sector, high investment in R&D activities, and early adoption of gene therapy technologies in the country. Hence, the presence of key market players along with supportive regulatory frameworks strengthens the position of the country in this domain.
Market Dynamics:

Drivers

  • Rising Demand for Safer Gene Therapy Alternatives is Driving the Market Growth

Non-viral means of gene delivery are getting attractive as they represent promising safer alternatives to standard viral vectors, which may face issues such as immunogenicity, insertional mutagenesis, and manufacturing difficulties. However, with the advent of gene therapy in the mainstream gene delivery field, there is a greater bias towards non-viral systems as they are generally less toxic and can easily avoid adverse immune responses. This change is most pertinent in therapeutic contexts with chronic or repeat dosing. This directly drives the non-viral platforms' growth since they are safer, more controllable, and customizable delivery mechanisms.


Viral vectors have historically been the standard for gene delivery, but recently, non-viral methods have gained traction as the preferred mode of gene delivery, due to lower immunogenicity, lack of insertional mutagenesis risk, and superior scalability for clinical applications.

Non-viral vectors are considered to have safer profiles than their viral counterparts, especially in neurological and systemic gene delivery settings, which is ideal for clinical translation (ScienceDirect).

  • The Market Growth is Accompanied by Growth in CRISPR and Genome Editing Technologies

The increase in genome editing technologies (especially CRISPR-Cas systems) has raised the demand for efficient gene delivery tools. These non-viral carriers, such as lipid nanoparticles, polymeric carriers, and electroporation, have never been so attractive in CRISPR areas since they have low cytotoxicity and are highly compatible with delivering CRISPR into cells. With the increase in research and therapeutic applications of genome editing in areas such as cancer, rare diseases, and regenerative medicine, the need for non-viral delivery solutions to effectively and safely deliver gene-editing tools is rising, creating a high market demand.

The emergence of lipid nanoparticle (LNP)-based non-viral carriers for CRISPR and RNA delivery is owing to their abundant biocompatibility and low toxicity.

Over 90% accuracy has been achieved on predictive delivery efficiency via machine-learning optimization of LNP design, expediting the development of effective formulations.       

Restraint

  • Low Transfection Efficiency Compared to Viral Vectors is Restraining the Market from Growing

Non-viral gene delivery technologies possess low transfection efficiency, which has been one of the restraints for the non-viral gene delivery technologies market growth, though these are considered for clinical application. Although non-viral strategies such as lipid-based carriers, polymers, and physical methods are more versatile than viral vectors, they encounter some limitations in delivering genetic material into the target cells. In contrast, viral vectors evolved to enter cells effectively and guarantee gene expression, while non-viral systems are less specific or effective in getting genes into and expressed in target cells. This has greatly affected their utility as therapeutics, since these applications often require a high and continuous level of gene expression. As a result, viral vectors are much more appealing to researchers and clinicians alike, which is subsequently preventing widespread use of non-viral delivery technologies.

Segmentation Analysis:

By Mode

The physical segment showed a significant share of the non-viral gene delivery technologies market in 2024, owing to the effectiveness of direct gene transfer along with the high efficiency associated with incorporation in the target cell, with less risk of immunogenicity. Methods including electroporation, microinjection, and gene gun delivery have gained traction in experimental and clinical settings as they permit specific and efficient delivery of genetic information to target cells. This included the notable increased market share in therapeutic development and academic research, as these are especially favored methods for hard-to-transfected cells, which require special considerations in the methods used and development of the RNA-based treatment ex vivo.

The chemical segment is anticipated to grow at the fastest rate during the forecast period, owing to the rapid development of nanotechnology and the design of novel chemical vectors that are more efficient and less toxic. Recent advancements under development for systemic delivery of nucleic acid payloads include lipid-based carriers, polymers, and inorganic nanoparticles, which have potential for in vitro and in vivo application owing to their ease of synthesis/scalability and ability to accommodate large genetic payloads.

By Application

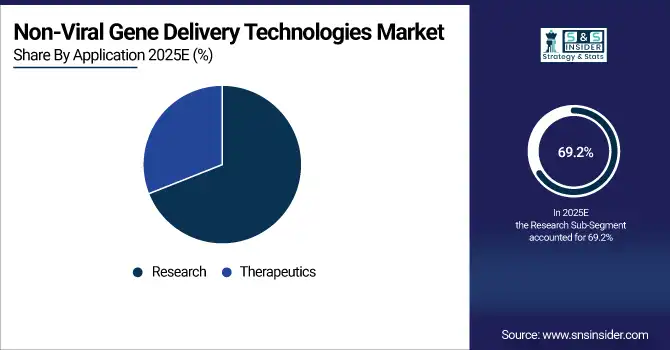
The research segment dominated the non-viral gene delivery technologies market share with around 69.2% in 2024 due to the high use of gene delivery tools in academic and preclinical research. Due to lower toxicity and higher transfection efficiency in vitro, non-viral research systems, primarily of research institutions and biotechnology companies, are increasingly being explored in gene function, regulation, and expression. This is due to non-viral vectors are suitable for a range of laboratory-based applications where enhanced scalability, economy, and safety are essential, and lend themselves to basic genetic studies and high-throughput screening, and also within molecular biology and genetic engineering.

Due to increased general interest in gene-based therapies directed towards chronic and genetic diseases such as cancer and rare diseases, the therapeutics segment is expected to grow the fastest over the forecast period. The use of non-viral delivery biopharmaceuticals in therapy is accelerating due to the development of increasingly efficient and tissue-specific delivery systems, especially in fields such as personalized medicine and CRISPR gene-editing platforms. The continuous number of clinical trials and the regulatory support for innovations in gene therapy are also allowing the segment to expand rapidly over the forecast years.
By Method

The ex vivo segment held the largest share by method of non-viral gene delivery technologies market in 2024, attributed to the better-controlled environment and higher efficiency in gene modification as compared to in vivo. In this process, cells are taken from a patient, they are then genetically engineered outside of the body using non-viral delivery methods, and then the cells are returned to the patient. The precise control of the environment, stability, and safety of organoids increases the cell viability, which is critical for both research and early application of organoids as therapy.

The In Vivo segment is expected to witness substantial growth across the forecast years owing to its scope of direct and relatively less invasive therapeutic applications. Unlike ex vivo delivery methods, wherein cells need to be transduced outside the body followed by reinfusion into the patient, In Vivo delivery methods provide genetic cargo directly within the body of the patient. This approach is being used more frequently for systemic diseases and genetic conditions that require systemic or tissue-specific gene delivery. Emerging targeting technologies, novel nanocarrier development, and biocompatible chemical delivery systems are facilitating efficient and safer In Vivo delivery.

By End Use

By end use, the non-viral gene delivery technologies market share was led by the research and academic institutes segment in 2024, with around 45.6% due to significant utilization of non-viral gene delivery techniques in fundamental research, specifically in areas concerning investigations of gene roles, cell biology, and diseases with cellular genetic components. These technologies have been extensively adopted by academic institutions and public research bodies, due to their lower immunogenicity and greater safety profile relative to viral vectors, and their applications for in vitro studies. Moreover, both government and private funders have supported genomics and cell biology research, which has further driven demand from this segment.

The biotechnology and biopharmaceutical company segment is expected to show significant growth, owing to the growing usage of L-glutamine during the forecast period. Factors such as an increased interest in clinical translation of gene therapy and the advancement of new non-viral delivery platforms for therapeutic applications within the fields of cancer immunotherapy, rare genetic disease, and regenerative medicine are driving this growth. These companies are rapidly scaling delivery technologies that are safe and commercially viable or compliant with the regulatory landscape, and thus moving non-viral vectors from bench to bedside. In addition, existing collaborations of biotech companies and academic research institutes are driving innovation and adoption in therapeutic pipelines.

Regional Analysis:

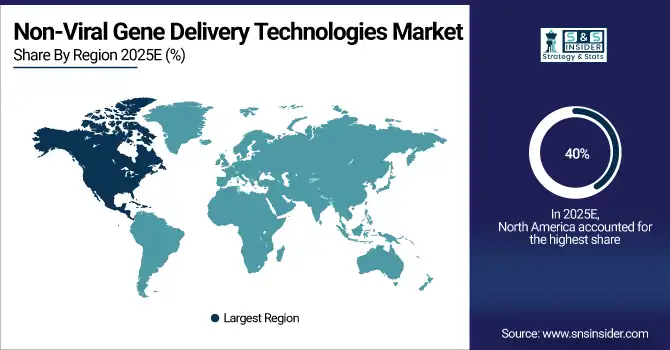
North America is dominated by advanced research infrastructure, high healthcare spending, and a strong presence of key biotech and pharmaceutical companies in the non-viral gene delivery technologies market trend, with around 40% in 2024. There is solid public and private funding for gene therapy research across the region. Moreover, the U.S. and Canada also offer a conducive regulatory framework and early adoption of novel technologies, which allows non-viral gene delivery platforms to complete their development and commercialization cycle easily. North America further stimulates innovation through clinical trials and academic research institutions.
The significant growth of the non-viral gene delivery technologies market in Asia Pacific is attributed to the rising investments in biotechnology, improving the healthcare infrastructure, and significant emphasis on precision medicine. China, Japan, and India are enhancing their research and development (R&D) capabilities and establishing international collaborations for developing effective gene delivery technologies. In addition, several government initiatives to support innovations in biotechnology, increasing demand for personalized therapies, coupled with the rising prevalence of genetic disorders, among others, are propelling the growth of the market in the region.

Europe is growing the non-viral gene delivery technologies market analysis due to a long history of strong academic research, availability of large pharmaceutical companies, and has benefited from a high level of genomics and gene therapy funding. Regulatory agencies in the region, such as the EMA, have created an optimal ecosystem for conducting clinical trials and getting novel therapies approved. Likewise, combined efforts across different countries and increasing investments in the biotech sector are driving the adoption of non-viral gene delivery technologies in regions such as Germany, the UK, and France.

The non-viral gene delivery technologies market shows moderate growth in Latin America and the Middle East & Africa (MEA) regions. Rise in the awareness towards gene therapy and rise in healthcare infrastructure are the major drivers for the growth of the non-viral gene delivery technologies market, along with the slow introduction of newer biotechnologies, are also expected to boost the market growth within the projected period. With an always-growing research output and government initiatives to boost the life sciences sector, Brazil and South Africa will be among the early and most important contributors.

Key Players:

The non-viral gene delivery technologies market companies are Polyplus-transfection SA, Mirus Bio LLC, Altogen Biosystems, SignaGen Laboratories, OZ Biosciences, MaxCyte Inc., IBA GmbH, Thermo Fisher Scientific, Merck KGaA, QIAGEN N.V., Takara Bio Inc., Biontex Laboratories GmbH, Promega Corporation, Bio-Rad Laboratories Inc., GenScript Biotech Corporation, Lonza Group AG, Agilent Technologies Inc., EMD Millipore, OriGene Technologies Inc., Bio-Techne Corporation, and other players.

Recent Developments:

  • March 2024 – Sartorius has added to its plasmid offering with the introduction of RPLUS, AAV-RC2, a Bercar plasmid for the manufacture of adeno-associated virus vector 2 (AAV2) that extends the company's ability to respond to a wider number of AAV serotypes, enabling more advanced gene therapy applications.

  • September 2024 – ProBio and UCI Therapeutics entered into a strategic memorandum of understanding (MOU) with the goal of developing NK cell gene introduction technologies. The MOU envisions a commitment to work together to develop both viral and non-viral gene delivery technologies, enhancing cell and gene therapy innovation.

    Non-Viral Gene Delivery Technologies Market Report Scope:

    Report Attributes Details
    Market Size in 2024 USD 3732.04 million 
    Market Size by 2032 USD 9573.31  million 
    CAGR CAGR of 12.55 % From 2025 to 2032
    Base Year 2024
    Forecast Period 2025-2032
    Historical Data 2021-2023
    Report Scope & Coverage Market Size, Segments Analysis, Competitive Landscape, Regional Analysis, DROC & SWOT Analysis, Forecast Outlook
    Key Segments • By Mode (Chemical, Physical)
    • By Application (Research, Therapeutics)
    • By Method (Ex Vivo, In Vivo, In Vitro)
    • By End Use (Biotechnology and Biopharmaceutical Companies, Research and Academic Institutes, Others)
    Regional Analysis/Coverage North America (US, Canada, Mexico), Europe (Germany, France, UK, Italy, Spain, Poland, Turkey, Rest of Europe), Asia Pacific (China, India, Japan, South Korea, Singapore, Australia, Rest of Asia Pacific), Middle East & Africa (UAE, Saudi Arabia, Qatar, South Africa, Rest of Middle East & Africa), Latin America (Brazil, Argentina, Rest of Latin America)
    Company Profiles The non-viral gene delivery technologies market companies are Polyplus-transfection SA, Mirus Bio LLC, Altogen Biosystems, SignaGen Laboratories, OZ Biosciences, MaxCyte Inc., IBA GmbH, Thermo Fisher Scientific, Merck KGaA, QIAGEN N.V., Takara Bio Inc., Biontex Laboratories GmbH, Promega Corporation, Bio-Rad Laboratories Inc., GenScript Biotech Corporation, Lonza Group AG, Agilent Technologies Inc., EMD Millipore, OriGene Technologies Inc., Bio-Techne Corporation, and other players.

Table Of Contents

1. Introduction

1.1 Market Definition & Scope

 1.2 Research Assumptions & Abbreviations

 1.3 Research Methodology

2. Executive Summary

2.1 Market Snapshot

 2.2 Market Absolute $ Opportunity Assessment & Y-o-Y Analysis, 2021–2032

 2.3 Market Size & Forecast, By Segmentation, 2021–2032

  2.3.1 Market Size By Mode

  2.3.2 Market Size By Application

         2.3.2 Market Size By Method

         2.3.2 Market Size By End Use

 2.4 Market Share & Bps Analysis By Region, 2024

 2.5 Industry Growth Scenarios – Conservative, Likely & Optimistic

 2.6 Industry CxO’s Perspective

3. Market Overview

3.1 Market Dynamics

  3.1.1 Drivers

  3.1.2 Restraints

  3.1.3 Opportunities

  3.1.4 Key Market Trends

 3.2 Industry PESTLE Analysis

 3.3 Key Industry Forces (Porter’s) Impacting Market Growth

 3.4 Industry Supply Chain Analysis

  3.4.1 Raw Material Suppliers

  3.4.2 Manufacturers

  3.4.3 Distributors/Suppliers

  3.4.4 Customers/End-Users

 3.5 Industry Life Cycle Assessment

 3.6 Parent Market Overview

 3.7 Market Risk Assessment

4. Statistical Insights & Trends Reporting

4.1. Incidence and Prevalence (2024)
 4.1.1. Prevalence of Genetic Disorders Requiring Gene Therapy
 4.1.2. Incidence of Chronic Diseases Driving Non-Viral Delivery Research
 4.1.3. Rise in Cancer and Rare Diseases: Key Target for Non-Viral Gene Delivery
 4.1.4. Regional Distribution of Relevant Disease Burden (North America, Europe, Asia Pacific, etc.)

4.2. Research and Clinical Trial Trends (2024)
 4.2.1. Number of Ongoing Preclinical and Clinical Trials Involving Non-Viral Vectors
 4.2.2. Publications and Research Output by Region
 4.2.3. Government and Academic Funding Trends
 4.2.4. Institutional Collaborations and Innovation Hubs

4.3. Technology Adoption and Volume Trends (2020–2032)
 4.3.1. Device and Technology Adoption Volume, by Year
 4.3.2. Comparison Between Non-Viral and Viral Vector Usage Trends
 4.3.3. Volume Share, by Application (Research, Therapeutics)
 4.3.4. Growth in Ex Vivo vs. In Vivo vs. In Vitro Delivery Method Usage

4.4. Healthcare and R&D Spending, by Region (2024)
 4.4.1. Government Healthcare Expenditure in Gene Delivery Research
 4.4.2. Private Sector and Biotech Investment in Non-Viral Technologies
 4.4.3. Out-of-Pocket Spending on Gene-Based Therapeutics (Patient Perspective)

 5. Non-Viral Gene Delivery Technologies Market Segmental Analysis & Forecast, By Mode, 2021 – 2032, Value (USD Billion)

5.1 Introduction

 5.2 Chemical

  5.2.1 Key Trends

  5.2.2 Market Size & Forecast, 2021 – 2032

5.2.3 LNPs

  5.2.3.1 Key Trends

  5.2.3.2 Market Size & Forecast, 2021 – 2032

5.2.4 Polymers

  5.2.4.1 Key Trends

  5.2.4.2 Market Size & Forecast, 2021 – 2032

5.2.5Others

  5.2.5.1 Key Trends

  5.2.5.2 Market Size & Forecast, 2021 – 2032

 5.3 Physical

  5.3.1 Key Trends

  5.3.2 Market Size & Forecast, 2021 – 2032

5.3.3 Electroporation

  5.3.3.1 Key Trends

  5.3.4.2 Market Size & Forecast, 2021 – 2032

5.3.5 Microinjection

  5.3.5.1 Key Trends

  5.3.5.2 Market Size & Forecast, 2021 – 2032

5.3.5 Others

  5.3.5.1 Key Trends

  5.3.5.2 Market Size & Forecast, 2021 – 2032

6. Non-Viral Gene Delivery Technologies Market Segmental Analysis & Forecast, By Application, 2021 – 2032, Value (USD Billion)

    6.1 Introduction

 6.2 Research

  6.2.1 Key Trends

  6.2.2 Market Size & Forecast, 2021 – 2032

 6.3.3 Therapeutics

  6.3.3.1 Key Trends

  6.3.3.2 Market Size & Forecast, 2021 – 2032

 6.3.4 Gene Therapy

  6.3.4.1 Key Trends

  6.3.4.2 Market Size & Forecast, 2021 – 2032

 6.3.5 Cell Therapy

  6.3.5.1 Key Trends

  6.3.5.2 Market Size & Forecast, 2021 – 2032

 6.3.6 Vaccines

  6.3.6.1 Key Trends

  6.3.6.2 Market Size & Forecast, 2021 – 2032

7. Non-Viral Gene Delivery Technologies Market Segmental Analysis & Forecast, By Method, 2021 – 2032, Value (USD Billion)

    7.1 Introduction

 7.2 Ex Vivo

  7.2.1 Key Trends

  7.2.2 Market Size & Forecast, 2021 – 2032

 7.3 In Vivo

  7.3.1 Key Trends

  7.3.2 Market Size & Forecast, 2021 – 2032

 7.4 In Vitro

  7.4.1 Key Trends

  7.4.2 Market Size & Forecast, 2021 – 2032

8. Non-Viral Gene Delivery Technologies Market Segmental Analysis & Forecast, By End Use, 2021 – 2032, Value (USD Billion)

    8.1 Introduction

 8.2 Biotechnology and Biopharmaceutical Companies

  8.2.1 Key Trends

  8.2.2 Market Size & Forecast, 2021 – 2032

 8.3 Research and Academic Institutes

  8.3.1 Key Trends

  8.3.2 Market Size & Forecast, 2021 – 2032

 8.4 Others

  8.4.1 Key Trends

  8.4.2 Market Size & Forecast, 2021 – 2032

9. Non-Viral Gene Delivery Technologies Market Segmental Analysis & Forecast By Region, 2021 – 2025, Value (USD Billion)

9.1 Introduction

9.2 North America

 9.2.1 Key Trends

 9.2.2 Non-Viral Gene Delivery Technologies Market Size & Forecast, By Mode, 2021 – 2032

 9.2.3 Non-Viral Gene Delivery Technologies Market Size & Forecast, By Application, 2021 – 2032

 9.2.4 Non-Viral Gene Delivery Technologies Market Size & Forecast, By Method, 2021 – 2032

 9.2.5 Non-Viral Gene Delivery Technologies Market Size & Forecast, By End Use, 2021 – 2032

 9.2.6 Non-Viral Gene Delivery Technologies Market Size & Forecast, By Country, 2021 – 2032

  9.2.6.1 USA

   9.2.6.1.1 Non-Viral Gene Delivery Technologies Market Size & Forecast, By Mode, 2021 – 2032

   9.2.6.1.2 Non-Viral Gene Delivery Technologies Market Size & Forecast, By Application, 2021 – 2032

   9.2.6.1.3 Non-Viral Gene Delivery Technologies Market Size & Forecast, By Method, 2021 – 2032

   9.2.6.1.4 Non-Viral Gene Delivery Technologies Market Size & Forecast, By End Use, 2021 – 2032

  9.2.6.2 Canada

   9.2.6.2.1 Non-Viral Gene Delivery Technologies Market Size & Forecast, By Mode, 2021 – 2032

   9.2.6.2.2 Non-Viral Gene Delivery Technologies Market Size & Forecast, By Application, 2021 – 2032

   9.2.6.2.3 Non-Viral Gene Delivery Technologies Market Size & Forecast, By Method, 2021 – 2032

   9.2.6.2.4 Non-Viral Gene Delivery Technologies Market Size & Forecast, By End Use, 2021 – 2032

9.3 Europe

 9.3.1 Key Trends

 9.3.2 Non-Viral Gene Delivery Technologies Market Size & Forecast, By Mode, 2021 – 2032

 9.3.3 Non-Viral Gene Delivery Technologies Market Size & Forecast, By Application, 2021 – 2032

 9.3.4 Non-Viral Gene Delivery Technologies Market Size & Forecast, By Method, 2021 – 2032

 9.3.5 Non-Viral Gene Delivery Technologies Market Size & Forecast, By End Use, 2021 – 2032

 9.3.6 Non-Viral Gene Delivery Technologies Market Size & Forecast, By Country, 2021 – 2032

  9.3.6.1 Germany

   9.3.6.1.1 Non-Viral Gene Delivery Technologies Market Size & Forecast, By Mode, 2021 – 2032

   9.3.6.1.2 Non-Viral Gene Delivery Technologies Market Size & Forecast, By Application, 2021 – 2032

   9.3.6.1.3 Non-Viral Gene Delivery Technologies Market Size & Forecast, By Method, 2021 – 2032

   9.3.6.1.4 Non-Viral Gene Delivery Technologies Market Size & Forecast, By End Use, 2021 – 2032

  9.3.6.2 UK

   9.3.6.2.1 Non-Viral Gene Delivery Technologies Market Size & Forecast, By Mode, 2021 – 2032

   9.3.6.2.2 Non-Viral Gene Delivery Technologies Market Size & Forecast, By Application, 2021 – 2032

   9.3.6.2.3 Non-Viral Gene Delivery Technologies Market Size & Forecast, By Method, 2021 – 2032

   9.3.6.2.4 Non-Viral Gene Delivery Technologies Market Size & Forecast, By End Use, 2021 – 2032

  9.3.6.3 France

   9.3.6.3.1 Non-Viral Gene Delivery Technologies Market Size & Forecast, By Mode, 2021 – 2032

   9.3.6.3.2 Non-Viral Gene Delivery Technologies Market Size & Forecast, By Application, 2021 – 2032

   9.3.6.3.3 Non-Viral Gene Delivery Technologies Market Size & Forecast, By Method, 2021 – 2032

   9.3.6.3.4 Non-Viral Gene Delivery Technologies Market Size & Forecast, By End Use, 2021 – 2032

  9.3.6.4 Italy

   9.3.6.4.1 Non-Viral Gene Delivery Technologies Market Size & Forecast, By Mode, 2021 – 2032

   9.3.6.4.2 Non-Viral Gene Delivery Technologies Market Size & Forecast, By Application, 2021 – 2032

   9.3.6.4.3 Non-Viral Gene Delivery Technologies Market Size & Forecast, By Method, 2021 – 2032

   9.3.6.4.4 Non-Viral Gene Delivery Technologies Market Size & Forecast, By End Use, 2021 – 2032

  9.3.6.5 Spain

   9.3.6.5.1 Non-Viral Gene Delivery Technologies Market Size & Forecast, By Mode, 2021 – 2032

   9.3.6.5.2 Non-Viral Gene Delivery Technologies Market Size & Forecast, By Application, 2021 – 2032

   9.3.6.5.3 Non-Viral Gene Delivery Technologies Market Size & Forecast, By Method, 2021 – 2032

   9.3.6.5.4 Non-Viral Gene Delivery Technologies Market Size & Forecast, By End Use, 2021 – 2032

  9.3.6.6 Russia

   9.3.6.6.1 Non-Viral Gene Delivery Technologies Market Size & Forecast, By Mode, 2021 – 2032

   9.3.6.6.2 Non-Viral Gene Delivery Technologies Market Size & Forecast, By Application, 2021 – 2032

   9.3.6.6.3 Non-Viral Gene Delivery Technologies Market Size & Forecast, By Method, 2021 – 2032

   9.3.6.6.4 Non-Viral Gene Delivery Technologies Market Size & Forecast, By End Use, 2021 – 2032

  9.3.6.7 Poland

   9.3.6.7.1 Non-Viral Gene Delivery Technologies Market Size & Forecast, By Mode, 2021 – 2032

   9.3.6.7.2 Non-Viral Gene Delivery Technologies Market Size & Forecast, By Application, 2021 – 2032

   9.3.6.7.3 Non-Viral Gene Delivery Technologies Market Size & Forecast, By Method, 2021 – 2032

   9.3.6.7.4 Non-Viral Gene Delivery Technologies Market Size & Forecast, By End Use, 2021 – 2032

  9.3.6.8 Rest of Europe

   9.3.6.8.1 Non-Viral Gene Delivery Technologies Market Size & Forecast, By Mode, 2021 – 2032

   9.3.6.8.2 Non-Viral Gene Delivery Technologies Market Size & Forecast, By Application, 2021 – 2032

   9.3.6.8.3 Non-Viral Gene Delivery Technologies Market Size & Forecast, By Method, 2021 – 2032

   9.3.6.8.4 Non-Viral Gene Delivery Technologies Market Size & Forecast, By End Use, 2021 – 2032   

9.4 Asia-Pacific

 9.4.1 Key Trends

 9.4.2 Non-Viral Gene Delivery Technologies Market Size & Forecast, By Mode, 2021 – 2032

 9.4.3 Non-Viral Gene Delivery Technologies Market Size & Forecast, By Application, 2021 – 2032

 9.4.4 Non-Viral Gene Delivery Technologies Market Size & Forecast, By Method, 2021 – 2032

 9.4.5 Non-Viral Gene Delivery Technologies Market Size & Forecast, By End Use, 2021 – 2032

 9.4.6 Non-Viral Gene Delivery Technologies Market Size & Forecast, By Country, 2021 – 2032

  9.4.6.1 China

   9.4.6.1.1 Non-Viral Gene Delivery Technologies Market Size & Forecast, By Mode, 2021 – 2032

   9.4.6.1.2 Non-Viral Gene Delivery Technologies Market Size & Forecast, By Application, 2021 – 2032

   9.4.6.1.3 Non-Viral Gene Delivery Technologies Market Size & Forecast, By Method, 2021 – 2032

   9.4.6.1.4 Non-Viral Gene Delivery Technologies Market Size & Forecast, By End Use, 2021 – 2032

  9.4.6.2 India

   9.4.6.2.1 Non-Viral Gene Delivery Technologies Market Size & Forecast, By Mode, 2021 – 2032

   9.4.6.2.2 Non-Viral Gene Delivery Technologies Market Size & Forecast, By Application, 2021 – 2032

   9.4.6.2.3 Non-Viral Gene Delivery Technologies Market Size & Forecast, By Method, 2021 – 2032

   9.4.6.2.4 Non-Viral Gene Delivery Technologies Market Size & Forecast, By End Use, 2021 – 2032

  9.4.6.3 Japan

   9.4.6.3.1 Non-Viral Gene Delivery Technologies Market Size & Forecast, By Mode, 2021 – 2032

   9.4.6.3.2 Non-Viral Gene Delivery Technologies Market Size & Forecast, By Application, 2021 – 2032

   9.4.6.3.3 Non-Viral Gene Delivery Technologies Market Size & Forecast, By Method, 2021 – 2032

   9.4.6.3.4 Non-Viral Gene Delivery Technologies Market Size & Forecast, By End Use, 2021 – 2032

  9.4.6.4 South Korea

   9.4.6.4.1 Non-Viral Gene Delivery Technologies Market Size & Forecast, By Mode, 2021 – 2032

   9.4.6.4.2 Non-Viral Gene Delivery Technologies Market Size & Forecast, By Application, 2021 – 2032

   9.4.6.4.3 Non-Viral Gene Delivery Technologies Market Size & Forecast, By Method, 2021 – 2032

   9.4.6.4.4 Non-Viral Gene Delivery Technologies Market Size & Forecast, By End Use, 2021 – 2032

  9.4.6.5 Australia

   9.4.6.5.1 Non-Viral Gene Delivery Technologies Market Size & Forecast, By Mode, 2021 – 2032

   9.4.6.5.2 Non-Viral Gene Delivery Technologies Market Size & Forecast, By Application, 2021 – 2032

   9.4.6.5.3 Non-Viral Gene Delivery Technologies Market Size & Forecast, By Method, 2021 – 2032

   9.4.6.5.4 Non-Viral Gene Delivery Technologies Market Size & Forecast, By End Use, 2021 – 2032

  9.4.6.6 ASEAN Countries

   9.4.6.6.1 Non-Viral Gene Delivery Technologies Market Size & Forecast, By Mode, 2021 – 2032

   9.4.6.6.2 Non-Viral Gene Delivery Technologies Market Size & Forecast, By Application, 2021 – 2032

   9.4.6.6.3 Non-Viral Gene Delivery Technologies Market Size & Forecast, By Method, 2021 – 2032

   9.4.6.6.4 Non-Viral Gene Delivery Technologies Market Size & Forecast, By End Use, 2021 – 2032

  9.4.6.7 Rest of Asia-Pacific

   9.4.6.7.1 Non-Viral Gene Delivery Technologies Market Size & Forecast, By Mode, 2021 – 2032

   9.4.6.7.2 Non-Viral Gene Delivery Technologies Market Size & Forecast, By Application, 2021 – 2032

   9.4.6.7.3 Non-Viral Gene Delivery Technologies Market Size & Forecast, By Method, 2021 – 2032

   9.4.6.7.4 Non-Viral Gene Delivery Technologies Market Size & Forecast, By End Use, 2021 – 2032

9.5 Latin America

 9.5.1 Key Trends

 9.5.2 Non-Viral Gene Delivery Technologies Market Size & Forecast, By Mode, 2021 – 2032

 9.5.3 Non-Viral Gene Delivery Technologies Market Size & Forecast, By Application, 2021 – 2032

 9.5.4 Non-Viral Gene Delivery Technologies Market Size & Forecast, By Method, 2021 – 2032

 9.5.5 Non-Viral Gene Delivery Technologies Market Size & Forecast, By End Use, 2021 – 2032

 9.5.6 Non-Viral Gene Delivery Technologies Market Size & Forecast, By Country, 2021 – 2032

  9.5.6.1 Brazil

   9.5.6.1.1 Non-Viral Gene Delivery Technologies Market Size & Forecast, By Mode, 2021 – 2032

   9.5.6.1.2 Non-Viral Gene Delivery Technologies Market Size & Forecast, By Application, 2021 – 2032

   9.5.6.1.3 Non-Viral Gene Delivery Technologies Market Size & Forecast, By Method, 2021 – 2032

   9.5.6.1.4 Non-Viral Gene Delivery Technologies Market Size & Forecast, By End Use, 2021 – 2032

  9.5.6.2 Argentina

   9.5.6.2.1 Non-Viral Gene Delivery Technologies Market Size & Forecast, By Mode, 2021 – 2032

   9.5.6.2.2 Non-Viral Gene Delivery Technologies Market Size & Forecast, By Application, 2021 – 2032

   9.5.6.2.3 Non-Viral Gene Delivery Technologies Market Size & Forecast, By Method, 2021 – 2032

   9.5.6.2.4 Non-Viral Gene Delivery Technologies Market Size & Forecast, By End Use, 2021 – 2032

  9.5.6.3 Mexico

   9.5.6.3.1 Non-Viral Gene Delivery Technologies Market Size & Forecast, By Mode, 2021 – 2032

   9.5.6.3.2 Non-Viral Gene Delivery Technologies Market Size & Forecast, By Application, 2021 – 2032

   9.5.6.3.3 Non-Viral Gene Delivery Technologies Market Size & Forecast, By Method, 2021 – 2032

   9.5.6.3.4 Non-Viral Gene Delivery Technologies Market Size & Forecast, By End Use, 2021 – 2032

  9.5.6.4 Colombia

   9.5.6.4.1 Non-Viral Gene Delivery Technologies Market Size & Forecast, By Mode, 2021 – 2032

   9.5.6.4.2 Non-Viral Gene Delivery Technologies Market Size & Forecast, By Application, 2021 – 2032

   9.5.6.4.3 Non-Viral Gene Delivery Technologies Market Size & Forecast, By Method, 2021 – 2032

   9.5.6.4.4 Non-Viral Gene Delivery Technologies Market Size & Forecast, By End Use, 2021 – 2032

  9.5.6.5 Rest of Latin America

   9.5.6.5.1 Non-Viral Gene Delivery Technologies Market Size & Forecast, By Mode, 2021 – 2032

   9.5.6.5.2 Non-Viral Gene Delivery Technologies Market Size & Forecast, By Application, 2021 – 2032

   9.5.6.5.3 Non-Viral Gene Delivery Technologies Market Size & Forecast, By Method, 2021 – 2032

   9.5.6.5.4 Non-Viral Gene Delivery Technologies Market Size & Forecast, By End Use, 2021 – 2032

9.6 Middle East & Africa

 9.6.1 Key Trends

 9.6.2 Non-Viral Gene Delivery Technologies Market Size & Forecast, By Mode, 2021 – 2032

 9.6.3 Non-Viral Gene Delivery Technologies Market Size & Forecast, By Application, 2021 – 2032

 9.6.4 Non-Viral Gene Delivery Technologies Market Size & Forecast, By Method, 2021 – 2032

 9.6.5 Non-Viral Gene Delivery Technologies Market Size & Forecast, By End Use, 2021 – 2032

 9.6.6 Non-Viral Gene Delivery Technologies Market Size & Forecast, By Country, 2021 – 2032

  9.6.6.1 UAE

   9.6.6.1.1 Non-Viral Gene Delivery Technologies Market Size & Forecast, By Mode, 2021 – 2032

   9.6.6.1.2 Non-Viral Gene Delivery Technologies Market Size & Forecast, By Application, 2021 – 2032

   9.6.6.1.3 Non-Viral Gene Delivery Technologies Market Size & Forecast, By Method, 2021 – 2032

   9.6.6.1.4 Non-Viral Gene Delivery Technologies Market Size & Forecast, By End Use, 2021 – 2032

  9.6.6.2 Saudi Arabia

   9.6.6.2.1 Non-Viral Gene Delivery Technologies Market Size & Forecast, By Mode, 2021 – 2032

   9.6.6.2.2 Non-Viral Gene Delivery Technologies Market Size & Forecast, By Application, 2021 – 2032

   9.6.6.2.3 Non-Viral Gene Delivery Technologies Market Size & Forecast, By Method, 2021 – 2032

   9.6.6.2.4 Non-Viral Gene Delivery Technologies Market Size & Forecast, By End Use, 2021 – 2032

  9.6.6.3 Qatar

   9.6.6.3.1 Non-Viral Gene Delivery Technologies Market Size & Forecast, By Mode, 2021 – 2032

   9.6.6.3.2 Non-Viral Gene Delivery Technologies Market Size & Forecast, By Application, 2021 – 2032

   9.6.6.3.3 Non-Viral Gene Delivery Technologies Market Size & Forecast, By Method, 2021 – 2032

   9.6.6.3.4 Non-Viral Gene Delivery Technologies Market Size & Forecast, By End Use, 2021 – 2032

  9.6.6.4 Egypt

   9.6.6.4.1 Non-Viral Gene Delivery Technologies Market Size & Forecast, By Mode, 2021 – 2032

   9.6.6.4.2 Non-Viral Gene Delivery Technologies Market Size & Forecast, By Application, 2021 – 2032

   9.6.6.4.3 Non-Viral Gene Delivery Technologies Market Size & Forecast, By Method, 2021 – 2032

   9.6.6.4.4 Non-Viral Gene Delivery Technologies Market Size & Forecast, By End Use, 2021 – 2032

  9.6.6.5 South Africa

   9.6.6.5.1 Non-Viral Gene Delivery Technologies Market Size & Forecast, By Mode, 2021 – 2032

   9.6.6.5.2 Non-Viral Gene Delivery Technologies Market Size & Forecast, By Application, 2021 – 2032

   9.6.6.5.3 Non-Viral Gene Delivery Technologies Market Size & Forecast, By Method, 2021 – 2032

   9.6.6.5.4 Non-Viral Gene Delivery Technologies Market Size & Forecast, By End Use, 2021 – 2032

  9.6.6.6 Rest of Middle East & Africa

   9.6.6.6.1 Non-Viral Gene Delivery Technologies Market Size & Forecast, By Mode, 2021 – 2032

   9.6.6.6.2 Non-Viral Gene Delivery Technologies Market Size & Forecast, By Application, 2021 – 2032

   9.6.6.6.3 Non-Viral Gene Delivery Technologies Market Size & Forecast, By Method, 2021 – 2032

   9.6.6.6.4 Non-Viral Gene Delivery Technologies Market Size & Forecast, By End Use, 2021 – 2032

10. Competitive Landscape

 10.1 Key Players' Positioning

 10.2 Competitive Developments

  10.2.1 Key Strategies Adopted (%), By Key Players, 2024

  10.2.2 Year-Wise Strategies & Development, 2021 – 2025

  10.2.3 Number Of Strategies Adopted By Key Players, 2024

 10.3 Market Share Analysis, 2024

 10.4 Product/Service & Application Benchmarking

  10.4.1 Product/Service Specifications & Features By Key Players

  10.4.2 Product/Service Heatmap By Key Players

  10.4.3 Application Heatmap By Key Players

 10.5 Industry Start-Up & Innovation Landscape

 10.6 Key Company Profiles

10.6 Key Company Profiles

 10.6.1 Polyplus-transfection SA
  
10.6.1.1 Company Overview & Snapshot
  10.6.1.2 Product/Service Portfolio
  10.6.1.3 Key Company Financials
  10.6.1.4 SWOT Analysis

 10.6.2 Mirus Bio LLC
  
10.6.2.1 Company Overview & Snapshot
  10.6.2.2 Product/Service Portfolio
  10.6.2.3 Key Company Financials
  10.6.2.4 SWOT Analysis

 10.6.3 Altogen Biosystems
  10.6.3.1 Company Overview & Snapshot
  10.6.3.2 Product/Service Portfolio
  10.6.3.3 Key Company Financials
  10.6.3.4 SWOT Analysis

 10.6.4 SignaGen Laboratories
  
10.6.4.1 Company Overview & Snapshot
  10.6.4.2 Product/Service Portfolio
  10.6.4.3 Key Company Financials
  10.6.4.4 SWOT Analysis

 10.6.5 OZ Biosciences
  10.6.5.1 Company Overview & Snapshot
  10.6.5.2 Product/Service Portfolio
  10.6.5.3 Key Company Financials
  10.6.5.4 SWOT Analysis

 10.6.6 MaxCyte Inc.
  
10.6.6.1 Company Overview & Snapshot
  10.6.6.2 Product/Service Portfolio
  10.6.6.3 Key Company Financials
  10.6.6.4 SWOT Analysis

 10.6.7 IBA GmbH
  
10.6.7.1 Company Overview & Snapshot
  10.6.7.2 Product/Service Portfolio
  10.6.7.3 Key Company Financials
  10.6.7.4 SWOT Analysis

 10.6.8 Thermo Fisher Scientific
  
10.6.8.1 Company Overview & Snapshot
  10.6.8.2 Product/Service Portfolio
  10.6.8.3 Key Company Financials
  10.6.8.4 SWOT Analysis

 10.6.9 Merck KGaA
  
10.6.9.1 Company Overview & Snapshot
  10.6.9.2 Product/Service Portfolio
  10.6.9.3 Key Company Financials
  10.6.9.4 SWOT Analysis

 10.6.10 QIAGEN N.V.
  
10.6.10.1 Company Overview & Snapshot
  10.6.10.2 Product/Service Portfolio
  10.6.10.3 Key Company Financials
  10.6.10.4 SWOT Analysis

 10.6.11 Takara Bio Inc.
  
10.6.11.1 Company Overview & Snapshot
  10.6.11.2 Product/Service Portfolio
  10.6.11.3 Key Company Financials
  10.6.11.4 SWOT Analysis

 10.6.12 Biontex Laboratories GmbH
  10.6.12.1 Company Overview & Snapshot
  10.6.12.2 Product/Service Portfolio
  10.6.12.3 Key Company Financials
  10.6.12.4 SWOT Analysis

 10.6.13 Promega Corporation
  10.6.13.1 Company Overview & Snapshot
  10.6.13.2 Product/Service Portfolio
  10.6.13.3 Key Company Financials
  10.6.13.4 SWOT Analysis

 10.6.14 Bio-Rad Laboratories Inc.
  
10.6.14.1 Company Overview & Snapshot
  10.6.14.2 Product/Service Portfolio
  10.6.14.3 Key Company Financials
  10.6.14.4 SWOT Analysis

 10.6.15 GenScript Biotech Corporation
  
10.6.15.1 Company Overview & Snapshot
  10.6.15.2 Product/Service Portfolio
  10.6.15.3 Key Company Financials
  10.6.15.4 SWOT Analysis

 10.6.16 Lonza Group AG
  
10.6.16.1 Company Overview & Snapshot
  10.6.16.2 Product/Service Portfolio
  10.6.16.3 Key Company Financials
  10.6.16.4 SWOT Analysis

 10.6.17 Agilent Technologies Inc.
  
10.6.17.1 Company Overview & Snapshot
  10.6.17.2 Product/Service Portfolio
  10.6.17.3 Key Company Financials
  10.6.17.4 SWOT Analysis

 10.6.18 EMD Millipore
  10.6.18.1 Company Overview & Snapshot
  10.6.18.2 Product/Service Portfolio
  10.6.18.3 Key Company Financials
  10.6.18.4 SWOT Analysis

 10.6.19 OriGene Technologies Inc.
  
10.6.19.1 Company Overview & Snapshot
  10.6.19.2 Product/Service Portfolio
  10.6.19.3 Key Company Financials
  10.6.19.4 SWOT Analysis

 10.6.20 Bio-Techne Corporation
  10.6.20.1 Company Overview & Snapshot
  10.6.20.2 Product/Service Portfolio
  10.6.20.3 Key Company Financials
  10.6.20.4 SWOT Analysis

11. Analyst Recommendations

 11.1 SNS Insider Opportunity Map

 11.2 Industry Low-Hanging Fruit Assessment

 11.3 Market Entry & Growth Strategy

 11.4 Analyst Viewpoint & Suggestions On Market Growth

12. Assumptions

13. Disclaimer

14. Appendix

 14.1 List Of Tables

 14.2 List Of Figures

Key Segments:

By Mode

    • Chemical
      • LNPs
      • Polymers
      • Others
    • Physical
      • Electroporation
      • Microinjection
      • Others

By Application

    • Research
    • Therapeutics
      • Gene Therapy
      • Cell Therapy
      • Vaccines

By Method

  • Ex Vivo
  • In Vivo
  • In Vitro

By End Use

    • Biotechnology and Biopharmaceutical Companies
    • Research and Academic Institutes
    • Others

Request for Segment Customization as per your Business Requirement: Segment Customization Request

Regional Coverage: 

North America

  • US
  • Canada

Europe

  • Germany
  • France
  • UK
  • Italy
  • Spain
  • Russia
  • Poland
  • Rest of Europe

Asia Pacific

  • China
  • India
  • Japan
  • South Korea
  • Australia
  • ASEAN Countries
  • Rest of Asia Pacific

Middle East & Africa

  • UAE
  • Saudi Arabia
  • Qatar
  • Egypt
  • South Africa
  • Rest of Middle East & Africa

Latin America

  • Brazil
  • Argentina
  • Mexico
  • Colombia
  • Rest of Latin America

Request for Country Level Research Report: Country Level Customization Request

Available Customization 

With the given market data, SNS Insider offers customization as per the company’s specific needs. The following customization options are available for the report: 

  • Detailed Volume Analysis 
  • Criss-Cross segment analysis (e.g., Product X Application) 
  • Competitive Product Benchmarking 
  • Geographic Analysis 
  • Additional countries in any of the regions 
  • Customized Data Representation 
  • Detailed analysis and profiling of additional market players

An accurate research report requires proper strategizing as well as implementation. There are multiple factors involved in the completion of good and accurate research report and selecting the best methodology to compete the research is the toughest part. Since the research reports we provide play a crucial role in any company’s decision-making process, therefore we at SNS Insider always believe that we should choose the best method which gives us results closer to reality. This allows us to reach at a stage wherein we can provide our clients best and accurate investment to output ratio.

Each report that we prepare takes a timeframe of 350-400 business hours for production. Starting from the selection of titles through a couple of in-depth brain storming session to the final QC process before uploading our titles on our website we dedicate around 350 working hours. The titles are selected based on their current market cap and the foreseen CAGR and growth.


The 5 steps process:

Step 1: Secondary Research:

Secondary Research or Desk Research is as the name suggests is a research process wherein, we collect data through the readily available information. In this process we use various paid and unpaid databases which our team has access to and gather data through the same. This includes examining of listed companies’ annual reports, Journals, SEC filling etc. Apart from this our team has access to various associations across the globe across different industries. Lastly, we have exchange relationships with various university as well as individual libraries.

Secondary Research

Step 2: Primary Research

When we talk about primary research, it is a type of study in which the researchers collect relevant data samples directly, rather than relying on previously collected data.  This type of research is focused on gaining content specific facts that can be sued to solve specific problems. Since the collected data is fresh and first hand therefore it makes the study more accurate and genuine.

We at SNS Insider have divided Primary Research into 2 parts.

Part 1 wherein we interview the KOLs of major players as well as the upcoming ones across various geographic regions. This allows us to have their view over the market scenario and acts as an important tool to come closer to the accurate market numbers. As many as 45 paid and unpaid primary interviews are taken from both the demand and supply side of the industry to make sure we land at an accurate judgement and analysis of the market.

This step involves the triangulation of data wherein our team analyses the interview transcripts, online survey responses and observation of on filed participants. The below mentioned chart should give a better understanding of the part 1 of the primary interview.

Primary Research

Part 2: In this part of primary research the data collected via secondary research and the part 1 of the primary research is validated with the interviews from individual consultants and subject matter experts.

Consultants are those set of people who have at least 12 years of experience and expertise within the industry whereas Subject Matter Experts are those with at least 15 years of experience behind their back within the same space. The data with the help of two main processes i.e., FGDs (Focused Group Discussions) and IDs (Individual Discussions). This gives us a 3rd party nonbiased primary view of the market scenario making it a more dependable one while collation of the data pointers.

Step 3: Data Bank Validation

Once all the information is collected via primary and secondary sources, we run that information for data validation. At our intelligence centre our research heads track a lot of information related to the market which includes the quarterly reports, the daily stock prices, and other relevant information. Our data bank server gets updated every fortnight and that is how the information which we collected using our primary and secondary information is revalidated in real time.

Data Bank Validation

Step 4: QA/QC Process

After all the data collection and validation our team does a final level of quality check and quality assurance to get rid of any unwanted or undesired mistakes. This might include but not limited to getting rid of the any typos, duplication of numbers or missing of any important information. The people involved in this process include technical content writers, research heads and graphics people. Once this process is completed the title gets uploader on our platform for our clients to read it.

Step 5: Final QC/QA Process:

This is the last process and comes when the client has ordered the study. In this process a final QA/QC is done before the study is emailed to the client. Since we believe in giving our clients a good experience of our research studies, therefore, to make sure that we do not lack at our end in any way humanly possible we do a final round of quality check and then dispatch the study to the client.