Nutritional Supplements Market Report Scope & Overview:
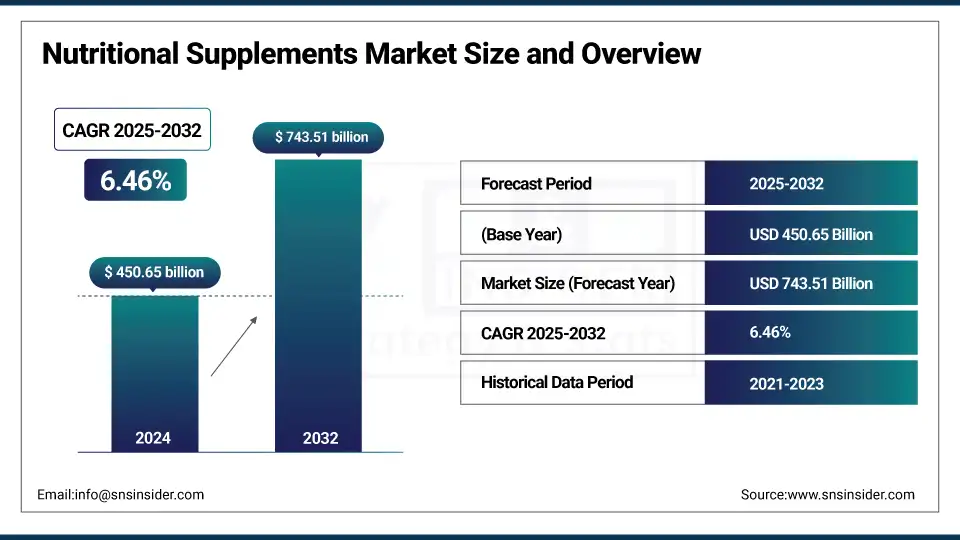
The Nutritional Supplements Market Size was valued at USD 450.65 billion in 2024 and is expected to reach USD 743.51 billion by 2032, growing at a CAGR of 6.46% over the forecast period of 2025-2032.
Nutritional Supplements market analysis points to rise in demand for fitness and sports nutrition-oriented products as greater numbers of consumers lead more active lifestyles and prioritize their physical performance. The consumption of supplements like protein powders, amino acids, pre-workouts, and recovery drinks is on a major uptrend. This is very popular among millennials, Gen Z youth, and urban populations, as many of them visit the gym to work out or do endurance sports daily. Fitness influencers, social media, and a growing muscle health-conscious mindset continue to drive the adoption of sports supplements as well. Further, a wider audience is now taking an interest in sports nutrition after the pandemic led to the growth of fitness centres and home workout culture, it says, which has resulted in sports nutrition becoming one of the fastest-growing sections within the market for nutritional supplements which drive the nutritional supplements market growth.
To Get more information On Nutritional Supplements Market - Request Free Sample Report
The CDC National Health Interview Survey (2020) shows that despite almost half of U.S. adults meeting the recommended aerobic activity guidelines, only 24.2% meet both aerobic and muscle‑strengthening guidelines. This would suggest that even a lot of ordinary exercisers are taking protein, amino acids, and recovery products to help preserve muscle mass and performance.
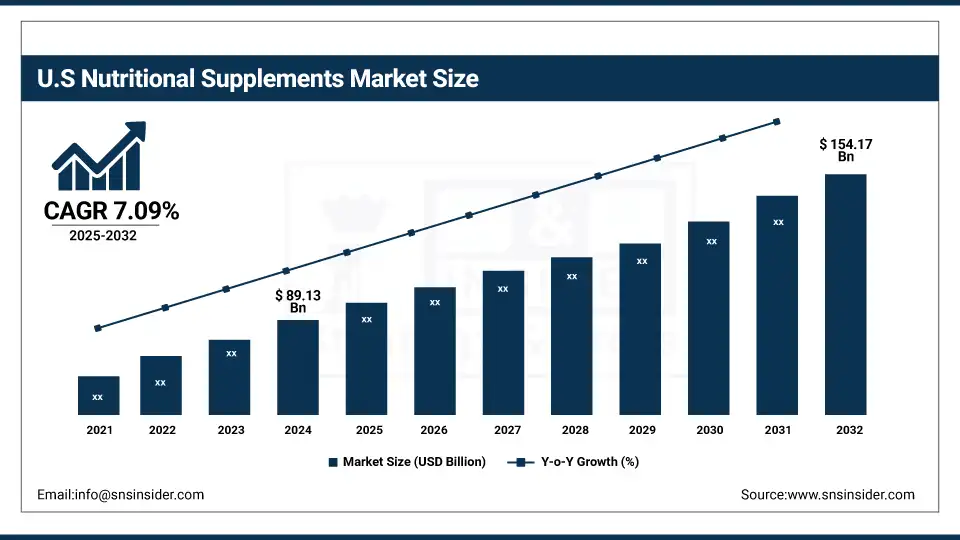
The U.S. Nutritional Supplements market size was USD 89.13 billion in 2024 and is expected to reach USD 154.17 billion by 2032 and grow at a CAGR of 7.09% over the forecast period of 2025-2032. The popularity of personalized supplements, clean-label products, and fitness stacks has grown rapidly, particularly among millennials and Gen Z. Increased demand post-pandemic for immune-boosting products continues to shape the market.
Market Dynamics
Key Drivers:
-
Rising Health Consciousness Among Consumers Drive the Market Growth
The growing awareness of preventive health, nutrition, and immunity has been a major driver of supplement adoption. Post-pandemic consumer behaviour shows a sustained interest in boosting physical and mental wellness through dietary support. Increasing fitness app usage, home workout culture, and personal health monitoring tools are reinforcing daily supplement routines. This shift is especially evident among millennials and Gen Z, who are turning to multivitamins, protein powders, and adaptogens to support performance and immunity. The trend is further amplified by lifestyle changes such as hybrid work and sedentary risks.
In 2023, Nestlé Health Science expanded its portfolio by acquiring “The Bountiful Company,” a leading vitamin brand, to capitalize on this long-term consumer health trend.
Restrain:
-
Consumer Skepticism & Misinformation, Which May Hamper the Market Growth
Despite market growth, many consumers remain skeptical about supplement efficacy, ingredient transparency, and product claims. Reports of unverified products, exaggerated marketing, or hidden ingredients damage the category’s credibility. Additionally, misinformation spread via influencers or unregulated platforms contributes to confusion.
Educating consumers with evidence-based benefits and scientific backing remains an ongoing challenge for both brands and regulators.
Opportunities:
-
Growth of Personalized Nutrition Solutions Creates an Opportunity for the Market
The personalized nutrition segment is rapidly transforming the nutritional supplements landscape by moving away from one-size-fits-all formulas. Consumers are increasingly seeking targeted and individualized health support based on their unique biological and lifestyle profiles. This demand is driven by a desire for better health outcomes, higher supplement efficacy, and improved consumer trust in product effectiveness.
Advancements in genomic testing, microbiome analysis, AI-driven algorithms, and wearable tech integration now allow companies to collect and interpret biomarkers such as DNA, blood nutrient levels, gut health, and metabolic rate. Based on this data, customized recommendations are made, and tailor-made supplement formulations are delivered, often via subscription services. This high level of personalization not only boosts adherence but also fosters brand loyalty, as users feel their specific needs are being addressed which drives the nutritional supplements market trends.
Segment Analysis:
By Product Type
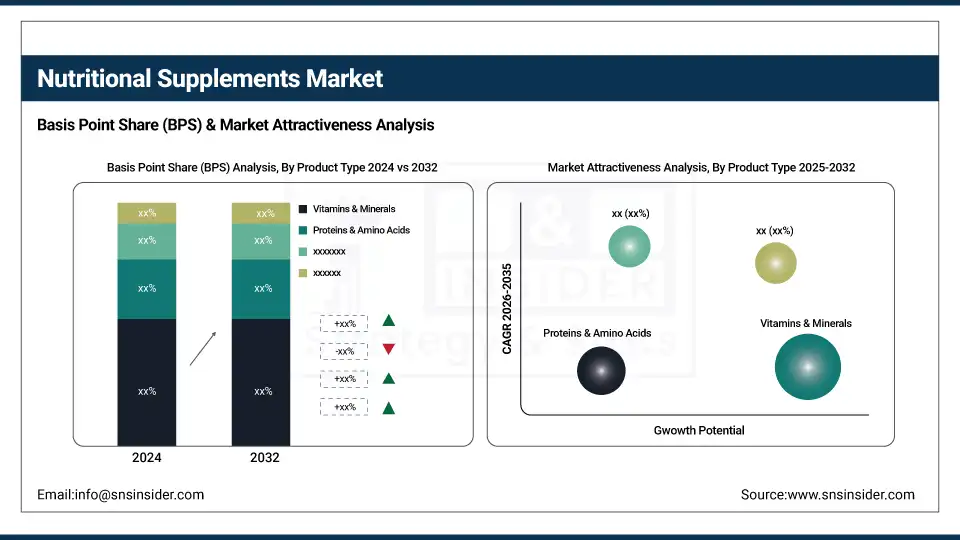
Vitamins & Minerals dominate the market, accounting for over 35% of total share, driven by their broad use across all age groups for immune and bone health. They're considered essential and are often the first supplements consumers adopt. Probiotics are the fastest-growing segment, fueled by rising digestive health awareness, microbiome research, and product launches in food and beverage formats.
By Form
Tablets hold the leading position with a market share of around 32%, owing to their stability, extended shelf life, and cost-effective manufacturing. They are also widely accepted by consumers who prioritize simplicity and convenience.
Gummies are growing fastest due to rising demand among children and adults who prefer chewable, flavored alternatives over traditional pills, supported by innovation in flavor, texture, and nutrient blend.
By Consumer Group
Adults are the primary consumer group, contributing to over 45% of market revenue, driven by increasing lifestyle diseases, stress-related deficiencies, and proactive self-health management.
Elderly Population is the fastest-growing group due to increased life expectancy and age-related health concerns like osteoporosis, joint health, and cognitive decline, prompting targeted supplement use.
By Distribution Channel
Pharmacies & Drug Stores dominate with a market share of around 40%, as they are trusted retail outlets and offer professional advice, especially for prescription-based or physician-recommended supplements.
Online Channels are growing fastest due to rising digital literacy, doorstep delivery, subscription models, and greater access to global brands, where e-commerce health purchases surged.
Regional Analysis:
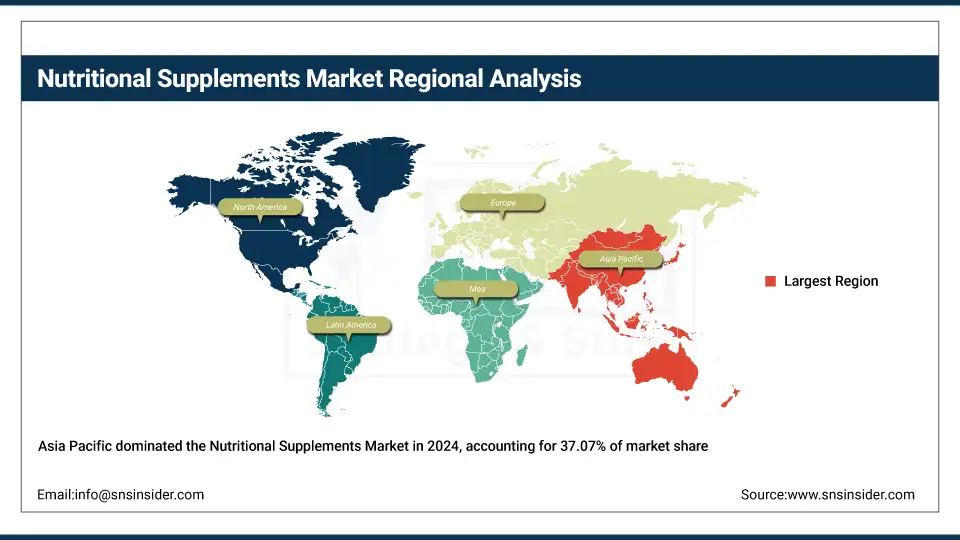
Asia Pacific held the largest Nutritional Supplements market share in 2024, around 37.07% 2024. It is due to its massive population base, rising disposable incomes, and growing awareness about preventive health. Countries like China, India, and Japan are witnessing a surge in supplement consumption, driven by aging demographics, urban lifestyle shifts, and a rise in chronic diseases. A shift toward Western dietary patterns has also increased the demand for products like probiotics and protein powders.
Get Customized Report as per Your Business Requirement - Enquiry Now
In 2024, Amway expanded its Nutrilite production facilities in China, aiming to meet growing local demand and accelerate personalized supplement innovation for Asian consumers.
The North America region is the fastest-growing market. The market is deeply penetrated, especially among adults and the aging population who actively use multivitamins and joint-health supplements. Regulatory clarity and access to trusted clinical brands also aid market retention.
Recent Development: In early 2025, Nestlé Health Science opened a new R&D facility in Canada focused on personalized nutrition and active-aging formulations, strengthening its North American portfolio.
In 2023, Pharmavite, maker of Nature Made, launched a direct-to-consumer personalized supplement platform using AI-driven health assessments, marking a shift toward data-backed nutrition services.
Europe maintains a significant share of the Nutritional Supplements market. It is shaped by aging populations, sustainability-conscious consumers, and well-established health standards. Germany, the UK, and France lead the region, with plant-based and gut health-related products gaining momentum. Consumers in Europe prefer supplements backed by clinical studies, and the demand for organic and vegan formulations is growing steadily.
In 2024, German firm BioHealth Nutrition entered a strategic partnership with French pharmacies to expand its distribution of clean-label, vegan-friendly supplements across Western Europe.
Key Players:
Major Nutritional Supplements companies are Amway, Nestlé Health Science, Abbott, Glanbia Nutritionals, Pfizer Consumer Healthcare, Bayer AG, Herbalife Nutrition, Nature’s Bounty, GNC Holdings, NOW Foods, Unilever, The Nature’s Way Company, Garden of Life, Blackmores, Himalaya Wellness, Otsuka Holdings, Arkopharma, Church & Dwight Co., MuscleTech, and Sami-Sabinsa Group.
Recent Development:
-
In April 2024, Glanbia plc finalized the acquisition of Flavor Producers LLC, a strategic move aimed at enhancing its innovation capabilities in functional nutrition. This acquisition strengthens Glanbia’s ability to deliver clean-label, plant-based flavor solutions across its supplement and performance nutrition portfolio.
-
In 2024, Abbott introduced its Protality high-protein nutrition shake, tailored for adults seeking to lose weight while maintaining lean muscle mass. This product reflects Abbott’s growing focus on clinical nutrition solutions that align with evolving health and wellness trends among aging and fitness-focused consumers.
| Report Attributes | Details |
| Market Size in 2024 | USD 450.65 Billion |
| Market Size by 2032 | USD 743.51 Billion |
| CAGR | CAGR of6.46% From 2025 to 2032 |
| Base Year | 2024 |
| Forecast Period | 2025-2032 |
| Historical Data | 2021-2023 |
| Report Scope & Coverage | Market Size, Segments Analysis, Competitive Landscape, Regional Analysis, DROC & SWOT Analysis, Forecast Outlook |
| Key Segments | • By Product Type (Vitamins & Minerals, Proteins & Amino Acids, Herbal Supplements, Omega Fatty Acids, Probiotics, Meal Replacements, Others (e.g., enzymes, fibers)) • By Form (Tablets, Capsules, Powder, Softgels, Gummies, Liquids, Others (e.g., effervescent, sprays)) • By Consumer Group (Infants, Children, Adults, Pregnant Women, and Elderly Population) • By Distribution Channel (Pharmacies & Drug Stores, Supermarkets & Hypermarkets, Online Channels, Specialty Stores, Direct Selling, Others (e.g., convenience stores, clinics)) |
| Regional Analysis/Coverage | North America (US, Canada), Europe (Germany, France, UK, Italy, Spain, Poland, Russsia, Rest of Europe), Asia Pacific (China, India, Japan, South Korea, Australia,ASEAN Countries, Rest of Asia Pacific), Middle East & Africa (UAE, Saudi Arabia, Qatar, Egypt, South Africa, Rest of Middle East & Africa), Latin America (Brazil, Argentina, Mexico, Colombia Rest of Latin America) |
| Company Profiles | Amway, Nestlé Health Science, Abbott, Glanbia Nutritionals, Pfizer Consumer Healthcare, Bayer AG, Herbalife Nutrition, Nature’s Bounty, GNC Holdings, NOW Foods, Unilever, The Nature’s Way Company, Garden of Life, Blackmores, Himalaya Wellness, Otsuka Holdings, Arkopharma, Church & Dwight Co., MuscleTech, Sami-Sabinsa Group. |
Frequently Asked Questions
Ans The market is seeing a surge in probiotic, vitamin C, zinc, and herbal-based formulations aimed at enhancing immune function post-pandemic.
Ans.Regulatory inconsistencies, lack of global standardization, and quality control issues pose major hurdles for manufacturers and consumers alike
Ans Key trends include personalized nutrition, plant-based supplements, clean-label demand, and functional blends targeting specific health goals.
Ans Vitamins & minerals lead the market with over 30% share due to widespread daily use and growing preventive health awareness.
Ans E-commerce is expanding market reach by enabling direct-to-consumer models, personalized subscriptions, and easy access to global brands.
Get in Touch
