Oilfield Equipment Rental Market Report Scope & Overview:
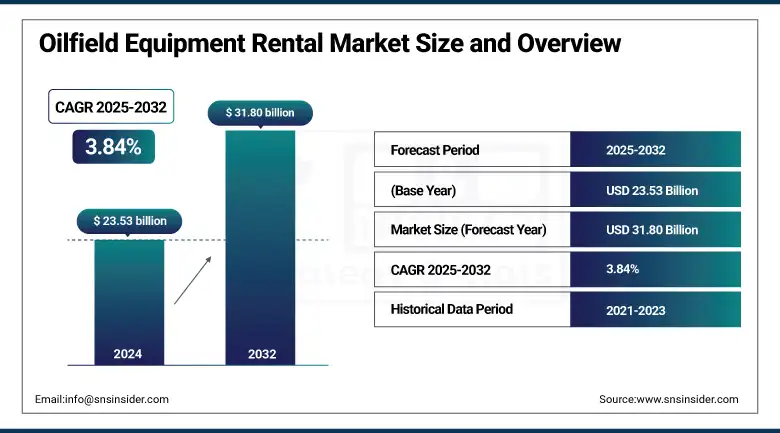
The Oilfield Equipment Rental Market size was valued at USD 23.53 billion in 2024 and is expected to reach USD 31.80 billion by 2032, growing at a CAGR of 3.84% over the forecast period of 2025-2032.
The Oilfield Equipment Rental Market has matured into a key enabler for exploration and production firms seeking flexibility without heavy upfront investment. With shifting oil prices, firms have been seen relying on rental solutions more than ever, with Equipment Mobilization Services at the forefront, whereby rigs, pumps, and support equipment are quickly mobilized to the site as demands dictate. As technological momentum continues to drive rental propositions with IoT-enabled monitoring, automation, and digital diagnostics tools that increase predictive maintenance and operational efficiency, which often comes with a premium price tag.
To Get more information On Oilfield Equipment Rental Market - Request Free Sample Report
Meanwhile, environmentally conscious and performance-based rental agreements bundling maintenance, safety compliance, and emissions monitoring are gaining traction, reflecting the sector’s pivot toward eco-friendly innovation. But rental providers face hurdles they need to upgrade fleets on an ongoing basis, deal with the logistics associated with Equipment Mobilization Services, and confront cyclical demand associated with oil-price fluctuations. Larger enterprises are the main drivers of rental volume, but proportionately do less to the bottom line, revealing an industry tilted toward a handful of higher value clients.
Offshore and onshore segments both see shifting preferences; modular, versatile equipment is favored for both environments, while deepwater and fracturing projects intensify demand for specialized systems. Over 65% of new additions to rental fleets are digitally monitored or automated, and outdoor utilization has averaged 72%, showing strong operational adoption. Cost-Efficient Service Models and Tech-Driven Services along with agile mobilization highlight Oilfield Equipment Rental Market Growth and new Oilfield Equipment Rental Market Trends.
In May 2025, the U.S. oilfield service giants including SLB, Halliburton, and Baker Hughes are bracing for a slowdown as oil prices drop to around USD 55 per barrel, prompting producers to cut drilling and capital expenditure. Companies, such as Diamondback and Coterra are scaling back operations, impacting demand for rental and mobilization services. Service firms are also facing tariff-related cost pressures and shifting focus toward sectors including LNG, power grids, and data centers to stabilize revenues.
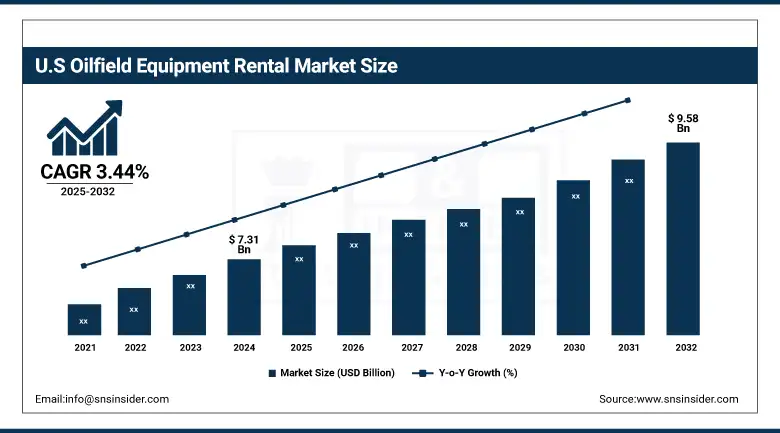
The U.S. dominates the Oilfield Equipment Rental Market in North America, growing from USD 7.31 billion in 2024 to USD 9.58 billion by 2032, with a CAGR of 3.44%. Strength in shale exploration, Equipment Mobilization Services demand, and increased focus on lowering capital costs through rentals have been the key drivers of growth.
Oilfield Equipment Rental Market Dynamics:
Drivers:
- Digital Transformation Drives Innovation in Oilfield Equipment Rental Industry, Enhancing Efficiency and ROI Through Smart Drilling Solutions
Technological developments and digitalization are altering the Oilfield Equipment Rental Industry, particularly the Drilling Equipment Rental segment. Modern equipment is equipped with Connected/IoT sensors, Remote Monitoring tools, and Predictive Maintenance, to quickly track the performance of the equipment in real-time and reduce downtime. To gain access to cutting-edge technology without heavy capital investment, operators rent high-tech assets. Digital twins, automated diagnostics, and smart analytics improve drilling accuracy, operational safety, and energy efficiency. Recent industry data shows that more than 60% of oilfield operators now prioritize rental equipment that is ready to be programmed to enhance efficiency and deliver better ROI. This transition will lead to efficiency gains and double down on compliance for stricter and stricter environmental and safety-related regulations, strengthening the value proposition of technology-enabled rental solutions.
Restraints:
- Oil Price Volatility Undermines Stability and Growth in the Oilfield Equipment Rental Market
Fluctuation of prices of oil is the single most prominent restraint on the global oilfield equipment rental market. Lower crude prices, including during the previous downturns, with WTI priced in the range of USD 55–USD 65 per barrel, typically result in E&P companies cutting capital expenditures, causing reduced drilling and demand for rental equipment. This cyclical character of the oil and gas industry provides an additional power for this impact as the utilization rates of rental companies may plunge during cycles of low-price phases. For instance, globally, rig counts fell almost 7% year-on-year in 2024 at a time when oil prices were trending downwards, which served to immediately deficit rental fleet utilization. That means rental providers face significant pressure over the reliability of revenues in an industry where margins are facing pressure and where investors need to invest in fleet upgrades or think long-term.
Oilfield Equipment Rental Market Segmentation Analysis:
By Type
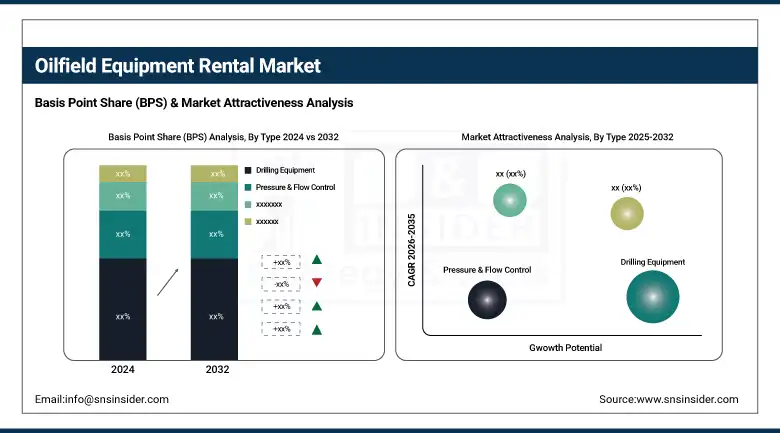
The Drilling equipment segment dominated the market and accounted for 48% of the Oilfield Equipment Rental market share. One of the key drivers of this dominance is the increasing demand for drill pipes, collars, and related components for exploration and production (E&P) activities. When drilling increases, especially in areas including the U.S. Permian Basin and Middle East, rental is a way for operators to limit capital expenses on high-priced equipment. Rental services have more flexibility, provide equipment returns faster, and take care of the maintenance, quickly reducing downtime. In addition, the growing horizontal and directional drilling technologies also increase demand for new drilling equipment and further strengthen its position in the market. Due to its functional importance and extensive usage, this segment is likely to continue to dominate the market.
Fishing equipment is emerging as the fastest-growing segment in the oilfield equipment rental market. The rise is predominantly driven by the complexity of drilling and equipment recovery activities stemming from difficulties with the wellbore. The frequency of stuck pipes, lost tools, or damaged assemblies is rising with wells experiencing age and operational risks, which augments demand for fishing tools. It enables operators to effectively handle unforeseen events without the burden of high ownership costs by renting such specialized equipment. Technological advancements in downhole sensors and intelligent fishing systems are several of the other factors that help that segment to grow rapidly due to they help high-quality, precise, and efficient recovery in the intelligence of the respective system and process of operations. This is especially true in the case of offshore and unconventional drilling environments.
By Application
Onshore applications dominate the oilfield equipment rental market, holding 69% of the market share in 2024. The prevalence of onshore drilling operations in regions such as North America, the Middle East, and Asia Pacific underpins this dominance. Onshore projects are typically less capital-intensive and easier to mobilize compared to offshore counterparts, leading to higher frequency and volume of operations. As a result, the demand for rental equipment, especially for short-term or exploratory wells, is significantly higher in onshore environments. Moreover, ongoing shale development in the U.S. and increasing investments in the Middle Eastern fields contribute to the consistent demand. The ease of logistics and access to infrastructure further make onshore operations the primary user of rental equipment.
Offshore applications are the fastest-growing segment within the oilfield equipment rental market, driven by renewed investment in deepwater and ultra-deepwater exploration projects. With oil prices normalizing, the leading E&P companies are returning to offshore development in some of the highest potential basins, such as Brazil's pre-salt, the GoM, and West Africa. The offshore projects need highly specialized, high-cost, and technical equipment, which can be rented cost-effectively for the operators. In addition, as offshore drilling becomes more complex and the demand for reliability and safety increases, so does the need for high-performance rental tools. Offshore rental equipment is projected to witness a tremendous growth, far more than onshore, in the forthcoming years, owing to the long-term project duration and high operational standards.
Oilfield Equipment Rental Market Regional Outlook:
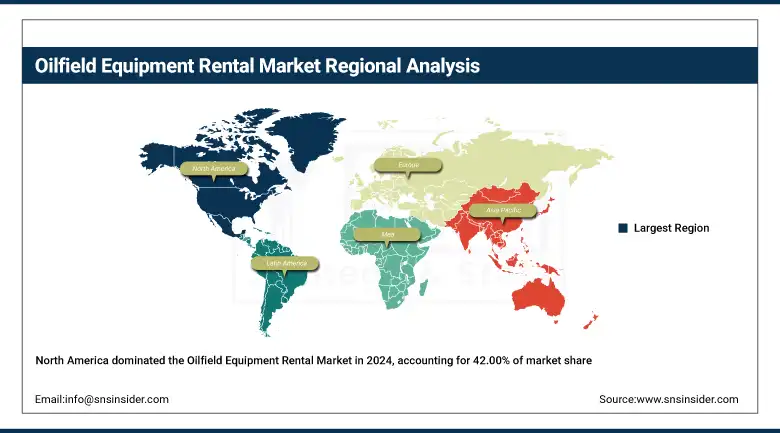
North America holds the dominant position in the Oilfield Equipment Rental Market, accounting for 42.00% of the overall market in 2024. Such dominance is attributed to the large number of onshore wells in North American, Middle Eastern, and Asia-Pacific countries. Onshore projects are cheaper and have a much easier mobilization procedure than an offshore project so that they can be run much more regularly, and in larger volumes. The onshore demand is very high, in particular for short-term, or exploratory, wells. Meanwhile, the U.S. shale plays and ongoing spending in Middle East fields guarantee steady demand. This is also the category that is burning most of the rental gear since the freight is simple and the roads are accessible.
Get Customized Report as per Your Business Requirement - Enquiry Now
Asia Pacific is the fastest-growing region in the Oilfield Equipment Rental Market, propelled by increasing offshore and onshore drilling activities in countries including China, India, Indonesia, and Australia. Increased consumption of energy, an expansion of upstream development, and new reserves of oil and gas are the major drivers for the regional market expansion. Domestic exploration is also being supported by governments, which in turn has resulted in dependence on equipment mobilization services and rental solutions for better cost-distribution. Finally, the combination of developing infrastructure and evolving regulation creates the perfect growth environment for international service providers, and historically, Asia Pacific has consistently been the most dynamic and fastest-growing global demand-side market.
China dominates the Asia-Pacific Oilfield Equipment Rental Market due to its extensive oil & gas exploration activities and strong domestic demand. Continued growth in the market can be attributed to its investment in advanced drilling technologies and increasing demand for Equipment Mobilization Services. The supportive policies by the government and its rapid expansion of offshore projects also boost its position in the region.
Europe holds a significant share in the Oilfield Equipment Rental Market due to its ongoing offshore drilling projects, especially in the North Sea. The region has a developed oil and gas industry with continued strong demand for oilfield equipment rental services in harsh and deepwater environments. Elsewhere, decently salted by the European countries, decarbonization is just as important through the partnership as a hydrocarbon development and a response granting an interest in gear rentals, rather than the capital purchased flowering. Tight environmental regulations pressure operators to utilize quality, code-compliant rental equipment. Europe keeps its strong position in the world in terms of those rentals, due to the availability of technical skills needed to maintain mature oilfields on a continual basis.
Oilfield Equipment Rental Companies are:
Halliburton, Technip, Baker Hughes, Transocean, Bechtel Corporation, National Oilwell Varco, Schlumberger, McDermott International Inc., COSL - China Oilfield Services Limited, and Petrofac.
Recent Developments:
In June 2024, Baker Hughes secured a contract from Petrobras to provide workover and plug-and-abandonment services for Brazil’s offshore pre-salt and post-salt fields. The operations are set to begin in early 2025, enhancing Baker Hughes’ presence in the Brazilian offshore market.
In October 2024, Baker Hughes beat Q3 profit estimates with an adjusted EPS of USD 0.67, driven by strong international demand and growth in its Industrial & Energy Technology segment. Despite missing revenue forecasts, the company saw solid performance in LNG and non-LNG contracts. CEO Lorenzo Simonelli reaffirmed confidence in meeting full-year EBITDA targets and improving margins going into 2025.
| Report Attributes | Details |
|---|---|
| Market Size in 2024 | USD 23.53 Billion |
| Market Size by 2032 | USD 31.80 Billion |
| CAGR | CAGR of 3.84% From 2025 to 2032 |
| Base Year | 2024 |
| Forecast Period | 2025-2032 |
| Historical Data | 2021-2023 |
| Report Scope & Coverage | Market Size, Segments Analysis, Competitive Landscape, Regional Analysis, DROC & SWOT Analysis, Forecast Outlook |
| Key Segments | • By Type (Drilling Equipment [Drill Pipe, Drill Collar, Hevi-Wate, Others], Pressure & Flow Control [Blow Out Preventer, Valves & Manifolds, Others], Fishing Equipment, Others) • By Application (Onshore, Offshore) |
| Regional Analysis/Coverage | North America (US, Canada, Mexico), Europe (Germany, France, UK, Italy, Spain, Poland, Turkey, Rest of Europe), Asia Pacific (China, India, Japan, South Korea, Singapore, Australia, Rest of Asia Pacific), Middle East & Africa (UAE, Saudi Arabia, Qatar, South Africa, Rest of Middle East & Africa), Latin America (Brazil, Argentina, Rest of Latin America) |
| Company Profiles | Halliburton, Technip, Baker Hughes, Transocean, Bechtel Corporation, National Oilwell Varco, Schlumberger, McDermott International Inc., COSL - China Oilfield Services Limited, Petrofac. |
Frequently Asked Questions
Ans: The North America region dominated the Oilfield Equipment Rental market in 2024.
Ans: The “Drilling equipment” segment dominated the Oilfield Equipment Rental market.
Ans: Digital Transformation Drives Innovation in Oilfield Equipment Rental Industry, Enhancing Efficiency and ROI Through Smart Drilling Solutions
Ans: The Oilfield Equipment Rental market was USD 23.53 billion in 2024 and is expected to reach USD 31.80 billion by 2032.
Ans: The Oilfield Equipment Rental market is expected to grow at a CAGR of 3.84% from 2025-2032
Get in Touch
