Get More Information on Oleoresin Market - Request Sample Report
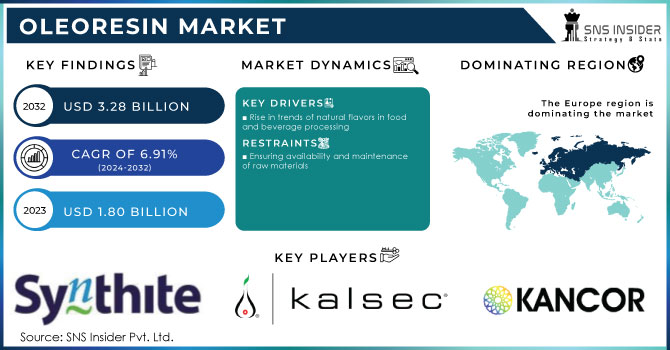
The Oleoresin Market size was USD 1.80 billion in 2023 and is expected to Reach USD 3.28 billion by 2032 and grow at a CAGR of 6.91 % over the forecast period of 2024-2032.
The use of oleoresin, with its functional qualities, is extremely important and in high demand in developing countries. Various medical researchers indicate that the use of oleoresin is increasing in the animal feed, pharmaceutical, cosmetic, and food and beverage industries.
Based on product the market is segmented into Paprika, Black Pepper, Turmeric, Ginger, Cinnamon and cassia, Capsicum, and others. The paprika segment is expected to dominate the oleoresin market in 2023, with a revenue share of over 25%. This is due to the increasing demand for paprika oleoresin in the food and beverage industry. Paprika oleoresin is used as a coloring and flavoring agent in a variety of food products, such as sauces, snacks, and dairy products. Also, it is used in pharmaceuticals and cosmetics.
In terms of revenue, the pharmaceuticals application category is anticipated to experience a CAGR of 7.3% over the forecast period. This is a result of oleoresins' numerous health advantages and rising funding for pharmaceutical research and development. These goods are being used by the pharmaceutical industry to create natural treatments for health issues. In contrast to manufactured medications, oleoresins solely offer health advantages when consumed and don't have any negative side effects. Oleoresins' medicinal characteristics are being used by pharmaceutical industry players to diversify their product offerings, which has led to rising demand from the pharmaceutical application market.
KEY DRIVERS
Rise in trends of natural flavors in food and beverage processing
Oleoresins are natural extracts that contain essential oils and other flavor compounds. They are used to impart natural flavor and aroma to food and beverages. Consumers are increasingly demanding natural flavors in healthy food and beverage products. They are becoming more aware of the health risks associated with artificial flavors and are looking for alternatives. Oleoresins are a good alternative to artificial flavors because they are made from natural sources and do not have any harmful side effects.
RESTRAIN
Ensuring availability and maintenance of raw materials
Oleoresins are derived from spices that are obtained seasonally and their supply is affected by a variety of circumstances, including climate change, pests and illnesses, and political instability. Climate change, such as droughts and floods, can have an impact on the production of black peppercorns, which are grown in tropical and subtropical locations. Black pepper crops can also be harmed by pests and illnesses. Political unrest in some countries may also have an impact on the availability of raw materials for oleoresin production. For example, political unrest in India, a significant producer of ginger, has an impact on the production of ginger oleoresin.
OPPORTUNITY
Rising potential health benefits of Oleoresins
Increase in demand for feed phytogenics
Feed phytogenics are natural substances used in animal feed to promote livestock health and performance. Oleoresins are an important component of many feed phytogenics, and rising demand for these products is pushing up demand for oleoresins. The increased knowledge of the benefits of natural components in animal feed, as well as the increasing demand for food safety, growing concerns about livestock health, and healthy and high-quality animal products, are driving up demand for feed phytogenics.
CHALLENGES
High cost of oleoresins
The cost of oleoresins can be influenced by a variety of factors, including the type of spices and plants used to produce the oleoresin, as some plants and animals are more expensive to grow or maintain than others. Some extraction procedures cost more than others. More concentrated oleoresins are more expensive. When there is a significant demand for oleoresins, the price can be high as well.
Russia and Ukraine are important oleoresin producers, with a combined market share of roughly 25%. The war has impacted production and exports from these countries, resulting in global shortages and higher prices. Export demand for Indian wheat and spices has increased since Russia initiated an invasion against Ukraine, forcing the worldwide trade of agricultural goods to move to India as supply from the two countries has come to a halt. The scarcity of oleoresins is also harming food and beverage production.
The recession has had a significant impact on the oleoresin market. Spice prices have also risen due to local scarcity and high worldwide demand. Ukraine is a major exporter of coriander seeds and other spices, according to the Federation of Indian Spice Stakeholders. Coriander prices have risen by around 30% in 2022 due to a reduced harvest. We anticipate growing export demand for Indian coriander as supplies from the Black Sea region become limited.
By Product
Paprika
Black Pepper
Turmeric
Ginger
Cinnamon & Cassia
Capsicum
Others
By Application
Animal Feed
Pharmaceuticals
Cosmetics
Food & Beverage
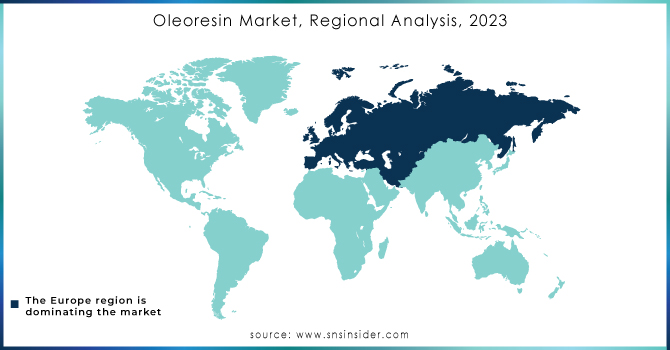
The European region dominated the market with a revenue share of more than 40% in 2022. This is due to the growing need for flavoring and coloring agents in the processed food and beverage industry. Also, demand from cosmetic, fragrance, and personal care products industries that act as a hefty end-use industry for oleoresins. The presence of major flavoring companies in the UK, Spain, and Germany provides European oleoresin producers with increased sales potential. This has increased regional product demand. Givaudan, Symrise AG, and MANE are large oleoresin users situated in Switzerland, France, and Germany, respectively.
North America has a market for oleoresins due to large-scale demand for processed food and beverages, which indirectly creates demand for oleoresin. The oleoresins market is anticipated to be driven over the long term by these regions' strong need for food additives. Additionally, among the world's top spice importers are Canada and Mexico. Furthermore, it is predicted that leading manufacturers' rising spending on plant-based nutritional and wellness products will spur market expansion in the near future.
Asia Pacific region has a significant growth in the oleoresins market. This region is the globe's biggest supplier and manufacturer of the product. Countries such as India, Indonesia, China, Vietnam, and others are key spice producers in the region. The competitive market is driven by the large-scale production of paprika oleoresins.
The value of Indian spice oil and oleoresin exports in FY22 was Rs 4,478 crore, the highest so far. In FY22, both volume and value climbed by more than 30%. The rising demand for spice oleoresins has contributed to this. Synthite Ltd, an oleoresin company situated in Kerala, is the largest exporter, accounting for 30% of the global share. Over the last few years, Indian oleoresin exports have increased by more than 30% per year, compared to 10-15% previously.
Need any customization research on Oleoresin Market- Enquiry Now
REGIONAL COVERAGE
North America
US
Canada
Mexico
Europe
Eastern Europe
Poland
Romania
Hungary
Turkey
Rest of Eastern Europe
Western Europe
Germany
France
UK
Italy
Spain
Netherlands
Switzerland
Austria
Rest of Western Europe
Asia Pacific
China
India
Japan
South Korea
Vietnam
Singapore
Australia
Rest of Asia Pacific
Middle East & Africa
Middle East
UAE
Egypt
Saudi Arabia
Qatar
Rest of Middle East
Africa
Nigeria
South Africa
Rest of Africa
Latin America
Brazil
Argentina
Colombia
Rest of Latin America
Synthite Industries Ltd., Kalsec Europe Ltd., Universal Oleoresins, Kancor Ingredients Ltd., Ozone Naturals, Paprika Oleo's India Limited, Chenguang Biotech Group Co. Ltd., Givaudan, Paras Perfumers, Naturite Agro Products Ltd, MRT GREEN PRODUCTS, Ozone Naturals, Akay Group Ltd, and other key players are mentioned in the final report.
In 2023 Synthite, an oleoresin maker, aims for a 4,000 Cr turnover in three years. The new factory in Kochi is expected to generate an additional 500-600 crore in revenue.
In 2023 GNT's Oil-Soluble Paprika Provides Opportunities for Growth in a Variety of Applications. Shade Vivid Orange - OS is the first 100% soluble in oil plant-based color derived from non-GMO paprika in the EXBERRY® family.
In 2021 Givaudan Taste & Wellbeing has collaborated with renowned market intelligence firm Bellomy to launch FlavorFindersTM, a revolutionary research-backed, patent-pending segmentation tool for the North American market that will transform the way flavor strategy is built.
Report Attributes | Details |
Market Size in 2023 | US$ 1.80 Billion |
Market Size by 2032 | US$ 3.28 Billion |
CAGR | CAGR of 6.91 % From 2024 to 2032 |
Base Year | 2023 |
Forecast Period | 2024-2032 |
Historical Data | 2020-2022 |
Report Scope & Coverage | Market Size, Segments Analysis, Competitive Landscape, Regional Analysis, DROC & SWOT Analysis, Forecast Outlook |
Key Segments | • By Product (Paprika, Black Pepper, Turmeric, Ginger, Cinnamon & Cassia, Capsicum, and others) • By Application (Animal Feed, Pharmaceuticals, Cosmetics, Food & Beverage) |
Regional Analysis/Coverage | North America (US, Canada, Mexico), Europe (Eastern Europe [Poland, Romania, Hungary, Turkey, Rest of Eastern Europe] Western Europe] Germany, France, UK, Italy, Spain, Netherlands, Switzerland, Austria, Rest of Western Europe]), Asia Pacific (China, India, Japan, South Korea, Vietnam, Singapore, Australia, Rest of Asia Pacific), Middle East & Africa (Middle East [UAE, Egypt, Saudi Arabia, Qatar, Rest of Middle East], Africa [Nigeria, South Africa, Rest of Africa], Latin America (Brazil, Argentina, Colombia Rest of Latin America) |
Company Profiles | Synthite Industries Ltd., Kalsec Europe Ltd., Universal Oleoresins, Kancor Ingredients Ltd., Ozone Naturals, Paprika Oleo's India Limited, Chenguang Biotech Group Co. Ltd., Givaudan, Paras Perfumers, Naturite Agro Products Ltd, MRT GREEN PRODUCTS, Ozone Naturals, Akay Group Ltd |
Key Drivers | • Rise in trends of natural flavors in food and beverage processing |
Market Opportunity | • Rising potential health benefits of Oleoresins • Increase in demand for feed phytogenics |
Ans: Oleoresin Market is anticipated to expand by 6.91 % from 2024 to 2032.
Ans: USD 3.28 billion is expected to grow by 2032.
Ans: Europe dominated the market in 2022.
Ans: Oleoresin Market size was valued at USD 1.80 billion in 2023
Ans: Drivers are the rise in trends of natural flavors in food and beverage processing
TABLE OF CONTENT
1. Introduction
1.1 Market Definition
1.2 Scope
1.3 Research Assumptions
2. Research Methodology
3. Market Dynamics
3.1 Drivers
3.2 Restraints
3.3 Opportunities
3.4 Challenges
4. Impact Analysis
4.1 Impact of Russia- Ukraine War
4.2 Impact of Ongoing Recession
4.3. Introduction
4.3.1 Impact on Major Economies
4.3.1.1 US
4.3.1.2 Canada
4.3.1.3 Germany
4.3.1.4 France
4.3.1.5 United Kingdom
4.3.1.6 China
4.3.1.7 Japan
4.3.1.8 South Korea
4.3.1.9 Rest of the World
5. Value Chain Analysis
6. Porter’s 5 forces model
7. PEST Analysis
8. Oleoresin Market Segmentation, By Product
8.1 Paprika
8.2 Black Pepper
8.3 Turmeric
8.4 Ginger
8.5 Cinnamon & Cassia
8.6 Capsicum
8.7 Others
9. Oleoresin Market Segmentation, By Application
9.1 Animal Feed
9.2 Pharmaceuticals
9.3 Cosmetics
9.4 Food & Beverage
10. Regional Analysis
10.1 Introduction
10.2 North America
10.2.1 North America Oleoresin Market by Country
10.2.2 North America Oleoresin Market by Product
10.2.3 North America Oleoresin Market by Application
10.2.4 USA
10.2.4.1 USA Oleoresin Market by Product
10.2.4.2 USA Oleoresin Market by Application
10.2.5 Canada
10.2.5.1 Canada Oleoresin Market by Product
10.2.5.2 Canada Oleoresin Market by Application
10.2.6 Mexico
10.2.6.1 Mexico Oleoresin Market by Product
10.2.6.2 Mexico Oleoresin Market by Application
10.3 Europe
10.3.1 Eastern Europe
10.3.1.1 Eastern Europe Oleoresin Market by Country
10.3.1.2 Eastern Europe Oleoresin Market by Product
10.3.1.3 Eastern Europe Oleoresin Market by Application
10.3.1.4 Poland
10.3.1.4.1 Poland Oleoresin Market by Product
10.3.1.4.2 Poland Oleoresin Market by Application
10.3.1.5 Romania
10.3.1.5.1 Romania Oleoresin Market by Product
10.3.1.5.2 Romania Oleoresin Market by Application
10.3.1.6 Hungary
10.3.1.6.1 Hungary Oleoresin Market by Product
10.3.1.6.2 Hungary Oleoresin Market by Application
10.3.1.7 Turkey
10.3.1.7.1 Turkey Oleoresin Market by Product
10.3.1.7.2 Turkey Oleoresin Market by Application
10.3.1.8 Rest of Eastern Europe
10.3.1.8.1 Rest of Eastern Europe Oleoresin Market by Product
10.3.1.8.2 Rest of Eastern Europe Oleoresin Market by Application
10.3.2 Western Europe
10.3.2.1 Western Europe Oleoresin Market by Country
10.3.2.2 Western Europe Oleoresin Market by Product
10.3.2.3 Western Europe Oleoresin Market by Application
10.3.2.4 Germany
10.3.2.4.1 Germany Oleoresin Market by Product
10.3.2.4.2 Germany Oleoresin Market by Application
10.3.2.5 France
10.3.2.5.1 France Oleoresin Market by Product
10.3.2.5.2 France Oleoresin Market by Application
10.3.2.6 UK
10.3.2.6.1 UK Oleoresin Market by Product
10.3.2.6.2 UK Oleoresin Market by Application
10.3.2.7 Italy
10.3.2.7.1 Italy Oleoresin Market by Product
10.3.2.7.2 Italy Oleoresin Market by Application
10.3.2.8 Spain
10.3.2.8.1 Spain Oleoresin Market by Product
10.3.2.8.2 Spain Oleoresin Market by Application
10.3.2.9 Netherlands
10.3.2.9.1 Netherlands Oleoresin Market by Product
10.3.2.9.2 Netherlands Oleoresin Market by Application
10.3.2.10 Switzerland
10.3.2.10.1 Switzerland Oleoresin Market by Product
10.3.2.10.2 Switzerland Oleoresin Market by Application
10.3.2.11 Austria
10.3.2.11.1 Austria Oleoresin Market by Product
10.3.2.11.2 Austria Oleoresin Market by Application
10.3.2.12 Rest of Western Europe
10.3.2.12.1 Rest of Western Europe Oleoresin Market by Product
10.3.2.12.2 Rest of Western Europe Oleoresin Market by Application
10.4 Asia-Pacific
10.4.1 Asia Pacific Oleoresin Market by Country
10.4.2 Asia Pacific Oleoresin Market by Product
10.4.3 Asia Pacific Oleoresin Market by Application
10.4.4 China
10.4.4.1 China Oleoresin Market by Product
10.4.4.2 China Oleoresin Market by Application
10.4.5 India
10.4.5.1 India Oleoresin Market by Product
10.4.5.2 India Oleoresin Market by Application
10.4.6 Japan
10.4.6.1 Japan Oleoresin Market by Product
10.4.6.2 Japan Oleoresin Market by Application
10.4.7 South Korea
10.4.7.1 South Korea Oleoresin Market by Product
10.4.7.2 South Korea Oleoresin Market by Application
10.4.8 Vietnam
10.4.8.1 Vietnam Oleoresin Market by Product
10.4.8.2 Vietnam Oleoresin Market by Application
10.4.9 Singapore
10.4.9.1 Singapore Oleoresin Market by Product
10.4.9.2 Singapore Oleoresin Market by Application
10.4.10 Australia
10.4.10.1 Australia Oleoresin Market by Product
10.4.10.2 Australia Oleoresin Market by Application
10.4.11 Rest of Asia-Pacific
10.4.11.1 Rest of Asia-Pacific Oleoresin Market by Product
10.4.11.2 Rest of Asia-Pacific Oleoresin Market by Application
10.5 Middle East & Africa
10.5.1 Middle East
10.5.1.1 Middle East Oleoresin Market by Country
10.5.1.2 Middle East Oleoresin Market by Product
10.5.1.3 Middle East Oleoresin Market by Application
10.5.1.4 UAE
10.5.1.4.1 UAE Oleoresin Market by Product
10.5.1.4.2 UAE Oleoresin Market by Application
10.5.1.5 Egypt
10.5.1.5.1 Egypt Oleoresin Market by Product
10.5.1.5.2 Egypt Oleoresin Market by Application
10.5.1.6 Saudi Arabia
10.5.1.6.1 Saudi Arabia Oleoresin Market by Product
10.5.1.6.2 Saudi Arabia Oleoresin Market by Application
10.5.1.7 Qatar
10.5.1.7.1 Qatar Oleoresin Market by Product
10.5.1.7.2 Qatar Oleoresin Market by Application
10.5.1.8 Rest of Middle East
10.5.1.8.1 Rest of Middle East Oleoresin Market by Product
10.5.1.8.2 Rest of Middle East Oleoresin Market by Application
10.5.2 Africa
10.5.2.1 Africa Oleoresin Market by Country
10.5.2.2 Africa Oleoresin Market by Product
10.5.2.3 Africa Oleoresin Market by Application
10.5.2.4 Nigeria
10.5.2.4.1 Nigeria Oleoresin Market by Product
10.5.2.4.2 Nigeria Oleoresin Market by Application
10.5.2.5 South Africa
10.5.2.5.1 South Africa Oleoresin Market by Product
10.5.2.5.2 South Africa Oleoresin Market by Application
10.5.2.6 Rest of Africa
10.5.2.6.1 Rest of Africa Oleoresin Market by Product
10.5.2.6.2 Rest of Africa Oleoresin Market by Application
10.6 Latin America
10.6.1 Latin America Oleoresin Market by Country
10.6.2 Latin America Oleoresin Market by Product
10.6.3 Latin America Oleoresin Market by Application
10.6.4 Brazil
10.6.4.1 Brazil Oleoresin Market by Product
10.6.4.2 Brazil Oleoresin Market by Application
10.6.5 Argentina
10.6.5.1 Argentina Oleoresin Market by Product
10.6.5.2 Argentina Oleoresin Market by Application
10.6.6 Colombia
10.6.6.1 Colombia Oleoresin Market by Product
10.6.6.2 Colombia Oleoresin Market by Application
10.6.7 Rest of Latin America
10.6.7.1 Rest of Latin America Oleoresin Market by Product
10.6.7.2 Rest of Latin America Oleoresin Market by Application
11. Company Profile
11.1 Synthite Industries Ltd
11.1.1 Company Overview
11.1.2 Financials
11.1.3 Product/Services Offered
11.1.4 SWOT Analysis
11.1.5 The SNS View
11.2 Universal Oleoresins
11.2.1 Company Overview
11.2.2 Financials
11.2.3 Product/Services Offered
11.2.4 SWOT Analysis
11.2.5 The SNS View
11.3 Kalsec Europe Ltd
11.3.1 Company Overview
11.3.2 Financials
11.3.3 Product/Services Offered
11.3.4 SWOT Analysis
11.3.5 The SNS View
11.4 Kancor Ingredients Ltd
11.4 Company Overview
11.4.2 Financials
11.4.3 Product/Services Offered
11.4.4 SWOT Analysis
11.4.5 The SNS View
11.5 Ozone Naturals
11.5.1 Company Overview
11.5.2 Financials
11.5.3 Product/Services Offered
11.5.4 SWOT Analysis
11.5.5 The SNS View
11.6 Paprika Oleo's India Limited
11.6.1 Company Overview
11.6.2 Financials
11.6.3 Product/Services Offered
11.6.4 SWOT Analysis
11.6.5 The SNS View
11.7 Chenguang Biotech Group Co. Ltd.
11.7.1 Company Overview
11.7.2 Financials
11.7.3 Product/Services Offered
11.7.4 SWOT Analysis
11.7.5 The SNS View
11.8 Naturite Agro Products Ltd
11.8.1 Company Overview
11.8.2 Financials
11.8.3 Product/Services Offered
11.8.4 SWOT Analysis
11.8.5 The SNS View
11.9 MRT GREEN PRODUCTS
11.9.1 Company Overview
11.9.2 Financials
11.9.3 Product/ Services Offered
11.9.4 SWOT Analysis
11.9.5 The SNS View
11. Givaudan
11.10.1 Company Overview
11.10.2 Financials
11.10.3 Product/Services Offered
11.10.4 SWOT Analysis
11.10.5 The SNS View
11.11 Akay Group Ltd
11.11.1 Company Overview
11.11.2 Financials
11.11.3 Product/Services Offered
11.11.4 SWOT Analysis
11.11.5 The SNS View
11.12 Ozone Naturals
11.12.1 Company Overview
11.12.2 Financials
11.12.3 Product/Services Offered
11.12.4 SWOT Analysis
11.12.5 The SNS View
11.13 Paras Perfumers
11.13.1 Company Overview
11.13.2 Financials
11.13.3 Product/Services Offered
11.13.4 SWOT Analysis
11.13.5 The SNS View
12. Competitive Landscape
12.1 Competitive Benchmarking
12.2 Market Share Analysis
12.3 Recent Developments
12.3.1 Industry News
12.3.2 Company News
12.3.3 Mergers & Acquisitions
13. USE Cases and Best Practices
14. Conclusion
An accurate research report requires proper strategizing as well as implementation. There are multiple factors involved in the completion of good and accurate research report and selecting the best methodology to compete the research is the toughest part. Since the research reports we provide play a crucial role in any company’s decision-making process, therefore we at SNS Insider always believe that we should choose the best method which gives us results closer to reality. This allows us to reach at a stage wherein we can provide our clients best and accurate investment to output ratio.
Each report that we prepare takes a timeframe of 350-400 business hours for production. Starting from the selection of titles through a couple of in-depth brain storming session to the final QC process before uploading our titles on our website we dedicate around 350 working hours. The titles are selected based on their current market cap and the foreseen CAGR and growth.
The 5 steps process:
Step 1: Secondary Research:
Secondary Research or Desk Research is as the name suggests is a research process wherein, we collect data through the readily available information. In this process we use various paid and unpaid databases which our team has access to and gather data through the same. This includes examining of listed companies’ annual reports, Journals, SEC filling etc. Apart from this our team has access to various associations across the globe across different industries. Lastly, we have exchange relationships with various university as well as individual libraries.
Step 2: Primary Research
When we talk about primary research, it is a type of study in which the researchers collect relevant data samples directly, rather than relying on previously collected data. This type of research is focused on gaining content specific facts that can be sued to solve specific problems. Since the collected data is fresh and first hand therefore it makes the study more accurate and genuine.
We at SNS Insider have divided Primary Research into 2 parts.
Part 1 wherein we interview the KOLs of major players as well as the upcoming ones across various geographic regions. This allows us to have their view over the market scenario and acts as an important tool to come closer to the accurate market numbers. As many as 45 paid and unpaid primary interviews are taken from both the demand and supply side of the industry to make sure we land at an accurate judgement and analysis of the market.
This step involves the triangulation of data wherein our team analyses the interview transcripts, online survey responses and observation of on filed participants. The below mentioned chart should give a better understanding of the part 1 of the primary interview.
Part 2: In this part of primary research the data collected via secondary research and the part 1 of the primary research is validated with the interviews from individual consultants and subject matter experts.
Consultants are those set of people who have at least 12 years of experience and expertise within the industry whereas Subject Matter Experts are those with at least 15 years of experience behind their back within the same space. The data with the help of two main processes i.e., FGDs (Focused Group Discussions) and IDs (Individual Discussions). This gives us a 3rd party nonbiased primary view of the market scenario making it a more dependable one while collation of the data pointers.
Step 3: Data Bank Validation
Once all the information is collected via primary and secondary sources, we run that information for data validation. At our intelligence centre our research heads track a lot of information related to the market which includes the quarterly reports, the daily stock prices, and other relevant information. Our data bank server gets updated every fortnight and that is how the information which we collected using our primary and secondary information is revalidated in real time.
Step 4: QA/QC Process
After all the data collection and validation our team does a final level of quality check and quality assurance to get rid of any unwanted or undesired mistakes. This might include but not limited to getting rid of the any typos, duplication of numbers or missing of any important information. The people involved in this process include technical content writers, research heads and graphics people. Once this process is completed the title gets uploader on our platform for our clients to read it.
Step 5: Final QC/QA Process:
This is the last process and comes when the client has ordered the study. In this process a final QA/QC is done before the study is emailed to the client. Since we believe in giving our clients a good experience of our research studies, therefore, to make sure that we do not lack at our end in any way humanly possible we do a final round of quality check and then dispatch the study to the client.
The Astaxanthin Market size was USD 2248.15 million in 2023 and is expected to Reach USD 9236.32 million by 2032 and grow at a CAGR of 17% over the forecast period of 2024-2032.
Alcoholic Beverage Market Size was esteemed at USD 1.41 trillion out of 2022 and is supposed to arrive at USD 1.81 trillion by 2030 and develop at a CAGR of 3.16% over the forecast period 2023-2030.
The Dietary Fibers Market Size was esteemed at USD 35.86 billion out of 2022 and is supposed to arrive at USD 75.10 billion by 2030 and develop at a CAGR of 9.68% over the forecast period 2023-2030.
Fish Protein Market was valued at USD 3.99 billion in 2023 and is expected to reach USD 6.64 billion by 2032, enlisting a CAGR of 5.8% from 2024 to 2032.
Chocolate Confectionery Market Report Scope & Overview: Chocolate Confectionery Mark
The Peppermint Tea Market size was USD 205.5 million in 2022 and is expected to Reach USD 308.2 million by 2030 and grow at a CAGR of 5.2% over the forecast period of 2023-2030.
Hi! Click one of our member below to chat on Phone