Omega-3 Fatty Acid Market Report Scope & Overview:
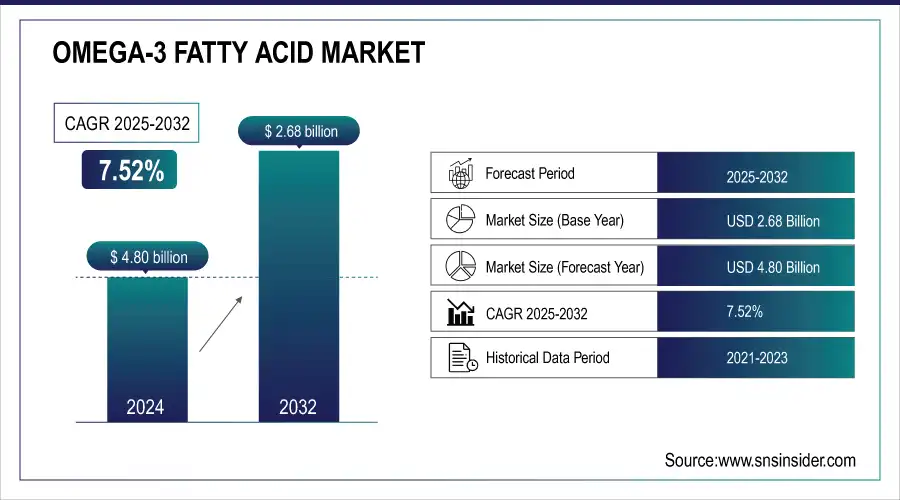
The Omega-3 Fatty Acid Market Size was valued at USD 2.68 billion in 2024 and is expected to reach USD 4.80 billion by 2032, and grow at a CAGR of 7.52% over the forecast period 2025-2032.
Fish and flaxseed, as well as vitamin supplements like fish oil, contain omega-3 fatty acids. The three principal omega-3 unsaturated fats are alpha-linolenic corrosive (ALA), eicosapentaenoic corrosive (EPA), and docosahexaenoic corrosive (DHA). DHA and EPA are found in fish and other seafood, while alpha-linolenic acid (ALA) is found in plant oils such as soybean, flaxseed, and canola oils. Omega-3 fatty acids play a crucial role in the human body because they are important components of the membranes that surround each cell. They also act as a source of calories, providing energy to the body and aiding in numerous biological activities.

Get more information on Omega-3 Fatty Acid Market - Request Sample Report
The omega-3 Fatty acids is being driven by the advent of omega-3 as an active pharmaceutical ingredient (API) and the growing awareness of chronic diseases among people all over the world. The adoption of favorable rules regarding the use of omega-3 in infant formulas, as well as cooperation between key companies to improve the product, are accelerating the growth of omega-3 fatty acids. Increased adoption of omega-3 in supplements and functional foods as it is known to be highly effective in the treatment of a variety of health problems like menstrual health, depression, mental health, and bone loss, as well as an increase in demand for food fortification, particularly for mother and infant nutrition products, all, have an impact on the omega-3 fatty acids market.
Moreover, expanded consciousness of omega-3's wellbeing benefits, use in pet food and feed, a more noteworthy spotlight on deterrent medical care, development in food handling applications, and rising medical services use all lift the omega-3 unsaturated fat industry. Moreover, in the forecast period, innovative production technologies, development of alternative sources of omega-3, microencapsulation, growing awareness of certified food ingredients, favorable regulatory environment, and enhancing consumer demand for plant-based products provide profitable opportunities for omega-3 fatty acids market players.

Key Omega-3 Fatty Acid Market Trends
-
Rising demand for plant-based and algae-derived omega-3s as sustainable and vegan alternatives to fish oil.
-
Expansion of functional foods and beverages with omega-3 fortification to attract health-conscious consumers.
-
Increasing pharmaceutical use of omega-3s in managing cardiovascular and neurological disorders.
-
Strong focus on sustainability and traceability with certified, eco-friendly sourcing methods.
-
Growing adoption of personalized nutrition integrating omega-3 supplements into DNA-based diet plans.
-
Supportive regulatory approvals and health claims driving wider consumer acceptance.
Omega-3 Fatty Acid Market Growth Drivers
-
Increasing awareness of health benefit
Increasing awareness of the health benefits of omega-3 fatty acids is one of the strongest drivers of market growth. Consumers are becoming more informed about the role of EPA and DHA in supporting cardiovascular health, reducing inflammation, improving cognitive performance, and aiding eye development. This shift is fueled by growing scientific research, widespread media coverage, and health authority endorsements that reinforce the preventive and therapeutic value of omega-3 supplements. As a result, demand is not limited to traditional dietary supplements but is expanding into fortified foods, beverages, pharmaceuticals, and even infant nutrition products. The trend reflects a broader global move toward preventive healthcare and wellness, where consumers are proactively seeking products that enhance long-term health outcomes.
-
Advancement in technologies
Omega-3 Fatty Acid Market Restraints
-
Unpleasant sensory experience.
One of the notable challenges in the omega-3 fatty acid market is the unpleasant sensory experience often associated with its consumption. Traditional sources such as fish oil can produce a strong odor, aftertaste, or “fishy burps,” which discourages consistent use among consumers. This sensory drawback not only affects the palatability of dietary supplements but also limits the appeal of omega-3 fortification in everyday food and beverage products. Manufacturers are increasingly investing in advanced encapsulation technologies, flavor-masking techniques, and alternative sources such as algae oil to overcome this issue. Addressing the sensory barrier is essential to improving consumer adherence and expanding the application of omega-3s across diverse product categories.
-
High temperatures
-
Quality effects
Omega-3 Fatty Acid Market OPPORTUNITIES
-
Plant-based product
-
Different geographies
-
High investment in extraction of omega-3
The extraction of omega-3 fatty acids, particularly from sources like fish, krill, and algae, requires significant investment due to the complexity of the processes involved. Advanced technologies such as supercritical fluid extraction, molecular distillation, and microencapsulation are essential to ensure high purity, stability, and concentration of EPA and DHA. These methods not only demand costly equipment but also involve stringent quality control measures to meet regulatory and safety standards. Additionally, sustainable sourcing practices—such as responsible fishing and algae cultivation—further add to operational costs. As a result, the high investment requirement poses a barrier for new entrants and smaller companies, while encouraging established players to strengthen their R&D and strategic partnerships to improve cost efficiency and maintain competitiveness in the omega-3 fatty acid market.
CHALLENGES
-
Competitive price range.
-
Large or scare competition
IMPACT OF COVID-19
The COVID-19 outbreak has helped the international market. There has been a significant surge in demand for omega fatty acid foods and dietary supplements to improve health and immunity, according to research. The widespread dissemination of doctor recommendations to incorporate immunity-boosting dietary supplements into daily living is a major factor in the product's widespread adoption. The supply chains of enterprises in the industry have been disrupted, owing to mobility limitations and geometrically rising logistics and transportation costs as a result of the ongoing pandemic. The product's manufacturing process has been hampered by a slowdown in the import and production of raw materials.
Furthermore, the original lockdowns, as well as their persistence, have resulted in workforce shortages in some manufacturing plants. From now on, product safety, product information transparency, and cleanliness issues are expected to stay prevalent among consumers. Market participants can raise their market value and prominence by ensuring the aforementioned variables are completely addressed during raw material sourcing, product manufacture, and packaging.
Omega-3 Fatty Acid Market Segment Analysis
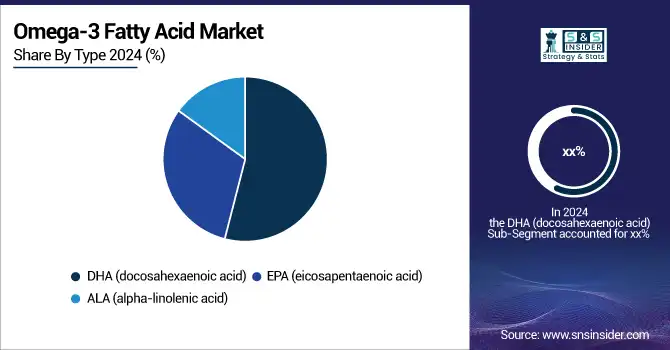
By Type: Alpha-linolenic acid (ALA), eicosapentaenoic acid (EPA), and docosahexaenoic acid (DHA) make up the omega-3 market (DHA).
By Source: Fish oil and krill oil, algal oil, walnut, pumpkin seeds, soybean oil, canola oil, bean curd, and other omega-3 products are available.
By Application: Dietary supplements, pharmaceuticals, infant formula, food and beverage, pet food, and fish feed are all segments of the omega-3 market.
By Type:
Among types, docosahexaenoic acid (DHA) holds the dominant market share in 2024, owing to its critical role in brain development, cognitive function, and eye health. DHA is widely used in infant formulas, dietary supplements, and pharmaceuticals, making it the most commercially significant omega-3 type. Its strong demand is further supported by rising awareness among parents regarding child nutrition and increasing recommendations by healthcare professionals for pregnant women and aging populations.

By Source:
On the basis of source, fish oil dominates the market in 2024, as it remains the most widely used and easily available source of EPA and DHA. The abundance of fish oil, coupled with its established clinical efficacy, has ensured its leadership position. Although algal oil is growing rapidly due to vegan preferences and sustainability concerns, fish oil continues to lead because of its cost-effectiveness, higher omega-3 concentration, and established supply chains.
By Application:
Within applications, dietary supplements emerge as the dominant segment in 2024, accounting for the largest share of omega-3 consumption. The increasing adoption of preventive healthcare practices, coupled with the convenience of capsules and soft gels, has made supplements the most popular channel for omega-3 intake. Strong consumer demand across North America, Europe, and Asia-Pacific, along with the growth of e-commerce platforms, has further cemented dietary supplements as the leading application segment.
Omega-3 Fatty Acid Market Regional Analysis
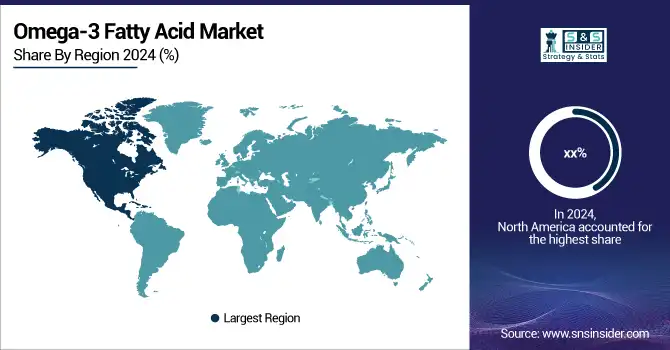
North America Omega-3 Fatty Acid Market Insights
North America was the largest regional market. Several regional market players, including Omega Protein Corp., Martek Biosciences Corp., and BioProcess Algae, are focused on R&D activities to create pharma-grade omega 3, which is boosting the regional market growth. The growing demand for omega 3 supplements in Europe can be ascribed to an aging population and an increase in cases of various health disorders, notably in economies.

Need any customization research on Omega-3 Fatty Acid Market - Enquiry Now
Asia Pacific Omega-3 Fatty Acid Market Insights
Over the forecast period, Asia Pacific is expected to have the highest CAGR. Growing awareness of the need for a healthy diet and general well-being, as well as rising disposable income, are predicted to enhance product demand in the region. In the Asia Pacific, the high birth rate and growing population of young mothers are expected to increase demand for baby nourishment, resulting in increased product consumption. Brazil, with increased demand for health supplements, is driving product demand throughout Central and South America.
Europe Omega-3 Fatty Acid Market Insights
Europe remains a key hub for omega-3 fatty acid consumption, accounting for 29.4% of the global market share in 2024. Germany leads within the region due to its strong nutraceutical and pharmaceutical industries, coupled with high consumer awareness of cardiovascular and cognitive health benefits. Regulatory support for health claims and a preference for premium, high-quality supplements have further fueled market penetration. The growing adoption of algae-based omega-3 also highlights Europe’s shift toward sustainable and plant-based solutions.
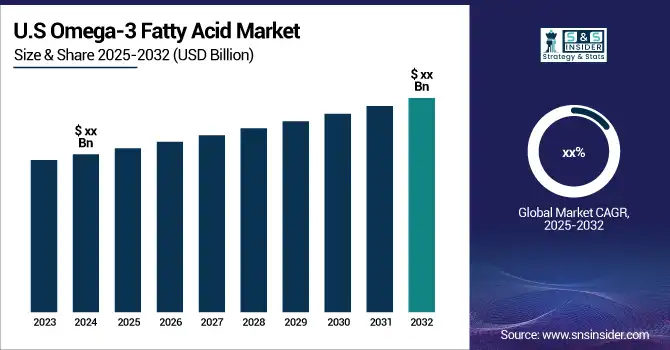
United States Omega-3 Fatty Acid Market Insights
The U.S. continues to dominate North America, holding a 35.8% share of the global market in 2024. This leadership is driven by a mature dietary supplement industry, widespread consumer adoption, and ongoing product innovations in functional foods and beverages enriched with omega-3s. Strong regulatory frameworks supporting health benefit claims and a proactive consumer base prioritizing preventive health make the U.S. the largest single-country market globally.
Latin America (LATAM) Omega-3 Fatty Acid Market Insights
Latin America represented 5.3% of the global omega-3 fatty acid market in 2024, with Brazil and Mexico emerging as the fastest-growing contributors. Increasing middle-class income levels, expanding healthcare awareness, and government-led nutrition programs are fostering greater adoption of fortified foods and supplements. Although overall penetration remains lower compared to North America and Europe, the region is witnessing steady growth opportunities in both pharmaceuticals and infant nutrition sectors.
Omega-3 Fatty Acid Market Competitive Landscape
Orkla Health
Orkla Health is a Norway-based leader in dietary supplements, offering a wide range of omega-3 products catering to consumer health and wellness.
-
In September 2024, Orkla Health introduced a new range of vegan omega-3 capsules derived from algae oil, targeting sustainability-conscious consumers across European markets. The launch aligns with growing demand for plant-based alternatives and strengthens the company’s footprint in the functional nutrition segment.
BASF SE
BASF SE, headquartered in Germany, is a global chemical giant with a strong portfolio of high-purity omega-3 ingredients for nutraceuticals and pharmaceuticals.
-
In June 2024, BASF expanded its production facility in Norway to enhance the output of concentrated EPA/DHA formulations, addressing the rising pharmaceutical-grade omega-3 demand in Europe and North America.
Aker Biomarine Antarctic AS
Aker Biomarine is a Norway-based biotech innovator specializing in sustainable krill-derived omega-3 solutions.
-
In March 2024, Aker Biomarine launched a new clinical research program in collaboration with U.S. universities to study the cognitive benefits of krill oil in aging populations, reinforcing its focus on science-backed product development.
Koninklijke DSM N.V.
DSM, a Netherlands-based global leader in health, nutrition, and bioscience, offers advanced algae-based omega-3 solutions.
-
In July 2024, DSM unveiled a partnership with food and beverage companies in Asia-Pacific to integrate algae-derived omega-3 oils into fortified dairy and beverage products, expanding its presence in the functional food market.
Omega-3 Fatty Acid Market Key Players
-
BASF SE
-
Aker Biomarine Antarctic AS
-
BioProcess Algae, LLC
-
Croda International Plc
-
Koninklijke DSM N.V.
-
GC Rieber Oils
-
Polaris Nutritional Lipids
-
Pharmavite LLC
-
NOW Foods
-
NutriGold Inc.
-
Reckitt Benckiser Group (Schiff Nutrition)
-
KD Pharma Group
-
Arista Industries Inc.
-
Golden Omega S.A.
-
GlaxoSmithKline plc (via Lovaza/Omacor)
-
Cargill, Incorporated
Report Attributes | Details |
---|---|
Market Size in 2024 | US$ 2.68 Billion |
Market Size by 2032 | US$ 4.8 Billion |
CAGR | CAGR of 7.52% From 2025 to 2032 |
Base Year | 2024 |
Forecast Period | 2025-2032 |
Historical Data | 2021-2023 |
Report Scope & Coverage | Market Size, Segments Analysis, Competitive Landscape, Regional Analysis, DROC & SWOT Analysis, Forecast Outlook |
Key Segments | • By Source (Marine, Vegetable oils, Soya and Soya Products, Nuts and Seeds) • By Type (ALA, EPA, DHA) • By Application (Dietary Supplement, Food & Beverage, Fish Feed, Pharmaceutical, Infant Formula, Pet Food) |
Regional Analysis/Coverage | North America (US, Canada), Europe (Germany, France, UK, Italy, Spain, Poland, Russsia, Rest of Europe), Asia Pacific (China, India, Japan, South Korea, Australia,ASEAN Countries, Rest of Asia Pacific), Middle East & Africa (UAE, Saudi Arabia, Qatar, Egypt, South Africa, Rest of Middle East & Africa), Latin America (Brazil, Argentina, Mexico, Colombia Rest of Latin America) |
Company Profiles | Orkla Health, BASF SE, Aker Biomarine Antarctic AS, EPAX, BioProcess Algae, LLC, Lonza, Croda International Plc, Omega Protein Corp., Koninklijke DSM N.V., GC Rieber Oils |
Table Of Contents
1. Introduction
1.1 Market Definition & Scope
1.2 Research Assumptions & Abbreviations
1.3 Research Methodology
2. Executive Summary
2.1 Market Snapshot
2.2 Market Absolute $ Opportunity Assessment & Y-o-Y Analysis, 2022–2033
2.3 Market Size & Forecast, By Segmentation, 2021–2032
2.3.1 Market Size By Type
2.3.2 Market Size By Source
2.3.3 Market Size By Application
2.4 Market Share & Bps Analysis By Region, 2024
2.5 Industry Growth Scenarios – Conservative, Likely & Optimistic
2.6 Industry CxO’s Perspective
3. Market Overview
3.1 Market Dynamics
3.1.1 Drivers
3.1.2 Restraints
3.1.3 Opportunities
3.1.4 Key Market Trends
3.2 Industry PESTLE Analysis
3.3 Key Industry Forces (Porter’s) Impacting Market Growth
3.4 Industry Supply Chain Analysis
3.4.1 Raw Material Suppliers
3.4.2 Manufacturers
3.4.3 Distributors/Suppliers
3.4.4 Customers/End-Users
3.5 Industry Life Cycle Assessment
3.6 Parent Market Overview
3.7 Market Risk Assessment
4. Statistical Insights & Trends Reporting
4.1 Nutritional Science & Clinical Validation
4.2 Regulatory & Labeling Landscape
4.3 Consumer Behavior & Awareness Mapping
4.4 Omega-3 Fortification & Innovation Trends
4.5 Supply Chain & Value Chain Analysis
5. Omega-3 Fatty Acid Market Segmental Analysis & Forecast, By Type, 2022 – 2033, Value (USD Billion)
5.1 Introduction
5.2 ALA (alpha-linolenic acid)
5.2.1 Key Trends
5.2.2 Market Size & Forecast, 2022 – 2033
5.3 EPA (eicosapentaenoic acid)
5.4 DHA (docosahexaenoic acid)
6. Omega-3 Fatty Acid Market Segmental Analysis & Forecast, By Source, 2022 – 2033, Value (USD Billion)
6.1 Introduction
6.2 Marine
6.2.1 Key Trends
6.2.2 Market Size & Forecast, 2022 – 2033
6.3 Vegetable oils
6.4 Soya and Soya Products
6.5 Nuts and Seeds
7. Omega-3 Fatty Acid Market Segmental Analysis & Forecast, By Application, 2022 – 2033, Value (USD Billion)
7.1 Introduction
7.2 Dietary Supplement
7.2.1 Key Trends
7.2.2 Market Size & Forecast, 2022 – 2033
7.3 Food & Beverage
7.4 Fish Feed
7.5 Pharmaceutical
7.6 Infant Formula
7.7 Pet Food
8. Omega-3 Fatty Acid Market Segmental Analysis & Forecast By Region, 2022 – 2033, Value (USD Billion)
8.1 Introduction
8.2 North America
8.2.1 Key Trends
8.2.2 Omega-3 Fatty Acid Market Size & Forecast, By Type, 2022 – 2033
8.2.3 Omega-3 Fatty Acid Market Size & Forecast, By Source, 2022 – 2033
8.2.4 Omega-3 Fatty Acid Market Size & Forecast, By Application, 2022 – 2033
8.2.5 Omega-3 Fatty Acid Market Size & Forecast, By Country, 2022 – 2033
8.2.5.1 USA
8.2.5.1.1 Omega-3 Fatty Acid Market Size & Forecast, By Type, 2022 – 2033
8.2.5.1.2 Omega-3 Fatty Acid Market Size & Forecast, By Source, 2022 – 2033
8.2.5.1.3 Omega-3 Fatty Acid Market Size & Forecast, By Application, 2022 – 2033
8.2.5.2 Canada
8.2.5.2.1 Omega-3 Fatty Acid Market Size & Forecast, By Type, 2022 – 2033
8.2.5.2.2 Omega-3 Fatty Acid Market Size & Forecast, By Source, 2022 – 2033
8.2.5.2.3 Omega-3 Fatty Acid Market Size & Forecast, By Application, 2022 – 2033
8.3 Europe
8.3.1 Key Trends
8.3.2 Omega-3 Fatty Acid Market Size & Forecast, By Type, 2022 – 2033
8.3.3 Omega-3 Fatty Acid Market Size & Forecast, By Source, 2022 – 2033
8.3.4 Omega-3 Fatty Acid Market Size & Forecast, By Application, 2022 – 2033
8.3.5 Omega-3 Fatty Acid Market Size & Forecast, By Country, 2022 – 2033
8.3.5.1 Germany
8.3.5.1.1 Omega-3 Fatty Acid Market Size & Forecast, By Type, 2022 – 2033
8.3.5.1.2 Omega-3 Fatty Acid Market Size & Forecast, By Source, 2022 – 2033
8.3.5.1.3 Omega-3 Fatty Acid Market Size & Forecast, By Application, 2022 – 2033
8.3.5.2 UK
8.3.5.2.1 Omega-3 Fatty Acid Market Size & Forecast, By Type, 2022 – 2033
8.3.5.2.2 Omega-3 Fatty Acid Market Size & Forecast, By Source, 2022 – 2033
8.3.5.2.3 Omega-3 Fatty Acid Market Size & Forecast, By Application, 2022 – 2033
8.3.5.3 France
8.3.5.3.1 Omega-3 Fatty Acid Market Size & Forecast, By Type, 2022 – 2033
8.3.5.3.2 Omega-3 Fatty Acid Market Size & Forecast, By Source, 2022 – 2033
8.3.5.3.3 Omega-3 Fatty Acid Market Size & Forecast, By Application, 2022 – 2033
8.3.5.4 Italy
8.3.5.4.1 Omega-3 Fatty Acid Market Size & Forecast, By Type, 2022 – 2033
8.3.5.4.2 Omega-3 Fatty Acid Market Size & Forecast, By Source, 2022 – 2033
8.3.5.4.3 Omega-3 Fatty Acid Market Size & Forecast, By Application, 2022 – 2033
8.3.5.5 Spain
8.3.5.5.1 Omega-3 Fatty Acid Market Size & Forecast, By Type, 2022 – 2033
8.3.5.5.2 Omega-3 Fatty Acid Market Size & Forecast, By Source, 2022 – 2033
8.3.5.5.3 Omega-3 Fatty Acid Market Size & Forecast, By Application, 2022 – 2033
8.3.5.6 Russia
8.3.5.6.1 Omega-3 Fatty Acid Market Size & Forecast, By Type, 2022 – 2033
8.3.5.6.2 Omega-3 Fatty Acid Market Size & Forecast, By Source, 2022 – 2033
8.3.5.6.3 Omega-3 Fatty Acid Market Size & Forecast, By Application, 2022 – 2033
8.3.5.7 Poland
8.3.5.7.1 Omega-3 Fatty Acid Market Size & Forecast, By Type, 2022 – 2033
8.3.5.7.2 Omega-3 Fatty Acid Market Size & Forecast, By Source, 2022 – 2033
8.3.5.7.3 Omega-3 Fatty Acid Market Size & Forecast, By Application, 2022 – 2033
8.3.5.8 Rest of Europe
8.3.5.8.1 Omega-3 Fatty Acid Market Size & Forecast, By Type, 2022 – 2033
8.3.5.8.2 Omega-3 Fatty Acid Market Size & Forecast, By Source, 2022 – 2033
8.3.5.8.3 Omega-3 Fatty Acid Market Size & Forecast, By Application, 2022 – 2033
8.4 Asia-Pacific
8.4.1 Key Trends
8.4.2 Omega-3 Fatty Acid Market Size & Forecast, By Type, 2022 – 2033
8.4.3 Omega-3 Fatty Acid Market Size & Forecast, By Source, 2022 – 2033
8.4.4 Omega-3 Fatty Acid Market Size & Forecast, By Application, 2022 – 2033
8.4.5 Omega-3 Fatty Acid Market Size & Forecast, By Country, 2022 – 2033
8.4.5.1 China
8.4.5.1.1 Omega-3 Fatty Acid Market Size & Forecast, By Type, 2022 – 2033
8.4.5.1.2 Omega-3 Fatty Acid Market Size & Forecast, By Source, 2022 – 2033
8.4.5.1.3 Omega-3 Fatty Acid Market Size & Forecast, By Application, 2022 – 2033
8.4.5.2 India
8.4.5.2.1 Omega-3 Fatty Acid Market Size & Forecast, By Type, 2022 – 2033
8.4.5.2.2 Omega-3 Fatty Acid Market Size & Forecast, By Source, 2022 – 2033
8.4.5.2.3 Omega-3 Fatty Acid Market Size & Forecast, By Application, 2022 – 2033
8.4.5.3 Japan
8.4.5.3.1 Omega-3 Fatty Acid Market Size & Forecast, By Type, 2022 – 2033
8.4.5.3.2 Omega-3 Fatty Acid Market Size & Forecast, By Source, 2022 – 2033
8.4.5.3.3 Omega-3 Fatty Acid Market Size & Forecast, By Application, 2022 – 2033
8.4.5.4 South Korea
8.4.5.4.1 Omega-3 Fatty Acid Market Size & Forecast, By Type, 2022 – 2033
8.4.5.4.2 Omega-3 Fatty Acid Market Size & Forecast, By Source, 2022 – 2033
8.4.5.4.3 Omega-3 Fatty Acid Market Size & Forecast, By Application, 2022 – 2033
8.4.5.5 Australia
8.4.5.5.1 Omega-3 Fatty Acid Market Size & Forecast, By Type, 2022 – 2033
8.4.5.5.2 Omega-3 Fatty Acid Market Size & Forecast, By Source, 2022 – 2033
8.4.5.5.3 Omega-3 Fatty Acid Market Size & Forecast, By Application, 2022 – 2033
8.4.5.6 ASEAN Countries
8.4.5.6.1 Omega-3 Fatty Acid Market Size & Forecast, By Type, 2022 – 2033
8.4.5.6.2 Omega-3 Fatty Acid Market Size & Forecast, By Source, 2022 – 2033
8.4.5.6.3 Omega-3 Fatty Acid Market Size & Forecast, By Application, 2022 – 2033
8.4.5.7 Rest of Asia-Pacific
8.4.5.7.1 Omega-3 Fatty Acid Market Size & Forecast, By Type, 2022 – 2033
8.4.5.7.2 Omega-3 Fatty Acid Market Size & Forecast, By Source, 2022 – 2033
8.4.5.7.3 Omega-3 Fatty Acid Market Size & Forecast, By Application, 2022 – 2033
8.5 Latin America
8.5.1 Key Trends
8.5.2 Omega-3 Fatty Acid Market Size & Forecast, By Type, 2022 – 2033
8.5.3 Omega-3 Fatty Acid Market Size & Forecast, By Source, 2022 – 2033
8.5.4 Omega-3 Fatty Acid Market Size & Forecast, By Application, 2022 – 2033
8.5.5 Omega-3 Fatty Acid Market Size & Forecast, By Country, 2022 – 2033
8.5.5.1 Brazil
8.5.5.1.1 Omega-3 Fatty Acid Market Size & Forecast, By Type, 2022 – 2033
8.5.5.1.2 Omega-3 Fatty Acid Market Size & Forecast, By Source, 2022 – 2033
8.5.5.1.3 Omega-3 Fatty Acid Market Size & Forecast, By Application, 2022 – 2033
8.5.5.2 Argentina
8.5.5.2.1 Omega-3 Fatty Acid Market Size & Forecast, By Type, 2022 – 2033
8.5.5.2.2 Omega-3 Fatty Acid Market Size & Forecast, By Source, 2022 – 2033
8.5.5.2.3 Omega-3 Fatty Acid Market Size & Forecast, By Application, 2022 – 2033
8.5.5.3 Mexico
8.5.5.3.1 Omega-3 Fatty Acid Market Size & Forecast, By Type, 2022 – 2033
8.5.5.3.2 Omega-3 Fatty Acid Market Size & Forecast, By Source, 2022 – 2033
8.5.5.3.3 Omega-3 Fatty Acid Market Size & Forecast, By Application, 2022 – 2033
8.5.5.4 Colombia
8.5.5.4.1 Omega-3 Fatty Acid Market Size & Forecast, By Type, 2022 – 2033
8.5.5.4.2 Omega-3 Fatty Acid Market Size & Forecast, By Source, 2022 – 2033
8.5.5.4.3 Omega-3 Fatty Acid Market Size & Forecast, By Application, 2022 – 2033
8.5.5.5 Rest of Latin America
8.5.5.5.1 Omega-3 Fatty Acid Market Size & Forecast, By Type, 2022 – 2033
8.5.5.5.2 Omega-3 Fatty Acid Market Size & Forecast, By Source, 2022 – 2033
8.5.5.5.3 Omega-3 Fatty Acid Market Size & Forecast, By Application, 2022 – 2033
8.6 Middle East & Africa
8.6.1 Key Trends
8.6.2 Omega-3 Fatty Acid Market Size & Forecast, By Type, 2022 – 2033
8.6.3 Omega-3 Fatty Acid Market Size & Forecast, By Source, 2022 – 2033
8.6.4 Omega-3 Fatty Acid Market Size & Forecast, By Application, 2022 – 2033
8.6.5 Omega-3 Fatty Acid Market Size & Forecast, By Country, 2022 – 2033
8.6.5.1 UAE
8.6.5.1.1 Omega-3 Fatty Acid Market Size & Forecast, By Type, 2022 – 2033
8.6.5.1.2 Omega-3 Fatty Acid Market Size & Forecast, By Source, 2022 – 2033
8.6.5.1.3 Omega-3 Fatty Acid Market Size & Forecast, By Application, 2022 – 2033
8.6.5.2 Saudi Arabia
8.6.5.2.1 Omega-3 Fatty Acid Market Size & Forecast, By Type, 2022 – 2033
8.6.5.2.2 Omega-3 Fatty Acid Market Size & Forecast, By Source, 2022 – 2033
8.6.5.2.3 Omega-3 Fatty Acid Market Size & Forecast, By Application, 2022 – 2033
8.6.5.3 Qatar
8.6.5.3.1 Omega-3 Fatty Acid Market Size & Forecast, By Type, 2022 – 2033
8.6.5.3.2 Omega-3 Fatty Acid Market Size & Forecast, By Source, 2022 – 2033
8.6.5.3.3 Omega-3 Fatty Acid Market Size & Forecast, By Application, 2022 – 2033
8.6.5.4 Egypt
8.6.5.4.1 Omega-3 Fatty Acid Market Size & Forecast, By Type, 2022 – 2033
8.6.5.4.2 Omega-3 Fatty Acid Market Size & Forecast, By Source, 2022 – 2033
8.6.5.4.3 Omega-3 Fatty Acid Market Size & Forecast, By Application, 2022 – 2033
8.6.5.5 South Africa
8.6.5.5.1 Omega-3 Fatty Acid Market Size & Forecast, By Type, 2022 – 2033
8.6.5.5.2 Omega-3 Fatty Acid Market Size & Forecast, By Source, 2022 – 2033
8.6.5.5.3 Omega-3 Fatty Acid Market Size & Forecast, By Application, 2022 – 2033
8.6.5.6 Rest of Middle East & Africa
8.6.5.6.1 Omega-3 Fatty Acid Market Size & Forecast, By Type, 2022 – 2033
8.6.5.6.2 Omega-3 Fatty Acid Market Size & Forecast, By Source, 2022 – 2033
8.6.5.6.3 Omega-3 Fatty Acid Market Size & Forecast, By Application, 2022 – 2033
9. Competitive Landscape
9.1 Key Players' Positioning
9.2 Competitive Developments
9.2.1 Key Strategies Adopted (%), By Key Players, 2024
9.2.2 Year-Wise Strategies & Development, 2021 – 2025
9.2.3 Number Of Strategies Adopted By Key Players, 2024
9.3 Market Share Analysis, 2024
9.4 Product/Service & Application Benchmarking
9.4.1 Product/Service Specifications & Features By Key Players
9.4.2 Product/Service Heatmap By Key Players
9.4.3 Application Heatmap By Key Players
9.5 Industry Start-Up & Innovation Landscape
9.6 Key Company Profiles
9.6.1 Orkla Health
9.6.1.1 Company Overview & Snapshot
9.6.1.2 Product/Service Portfolio
9.6.1.3 Key Company Financials
9.6.1.4 SWOT Analysis
9.6.2 BASF SE
9.6.3 Aker Biomarine Antarctic AS
9.6.4 EPAX
9.6.5 BioProcess Algae, LLC
9.6.6 Lonza
9.6.7 Croda International Plc
9.6.8 Omega Protein Corp.
9.6.9 Koninklijke DSM N.V.
9.6.10 GC Rieber Oils
9.6.11 Polaris Nutritional Lipids
9.6.12 Pharmavite LLC
9.6.13 NOW Foods
9.6.14 NutriGold Inc.
9.6.15 Reckitt Benckiser Group
9.6.16 KD Pharma Group
9.6.17 Arista Industries Inc.
9.6.18 Golden Omega S.A.
9.6.19 GlaxoSmithKline plc
9.6.20 Cargill, Incorporated
10. Analyst Recommendations
10.1 SNS Insider Opportunity Map
10.2 Industry Low-Hanging Fruit Assessment
10.3 Market Entry & Growth Strategy
10.4 Analyst Viewpoint & Suggestions On Market Growth
11. Assumptions
12. Disclaimer
13. Appendix
13.1 List Of Tables
13.2 List Of Figures
KEY MARKET SEGMENTS:
By Source
-
Marine
-
Vegetable oils
-
Soya and Soya Products
-
Nuts and Seeds
By Type
-
ALA (alpha-linolenic acid)
-
EPA (eicosapentaenoic acid)
-
DHA (docosahexaenoic acid)
By Application
-
Dietary Supplement
-
Food & Beverage
-
Fish Feed
-
Pharmaceutical
-
Infant Formula
-
Pet Food
Request for Segment Customization as per your Business Requirement: Segment Customization Request
Regional Coverage:
North America
-
US
-
Canada
Europe
-
Germany
-
UK
-
France
-
Italy
-
Spain
-
Russia
-
Poland
-
Rest of Europe
Asia Pacific
-
China
-
India
-
Japan
-
South Korea
-
ASEAN Countries
-
Australia
-
Rest of Asia Pacific
Latin America
-
Brazil
-
Argentina
-
Mexico
-
Colombia
-
Rest of Latin America
Middle East & Africa
-
UAE
-
Saudi Arabia
-
Qatar
-
Egypt
-
South Africa
-
Rest of Middle East & Africa
Request for Country Level Research Report: Country Level Customization Request
Available Customization
With the given market data, SNS Insider offers customization as per the company’s specific needs. The following customization options are available for the report:
-
Detailed Volume Analysis
-
Criss-Cross segment analysis (e.g. Product X Application)
-
Competitive Product Benchmarking
-
Geographic Analysis
-
Additional countries in any of the regions
-
Customized Data Representation
-
Detailed analysis and profiling of additional market players
An accurate research report requires proper strategizing as well as implementation. There are multiple factors involved in the completion of good and accurate research report and selecting the best methodology to compete the research is the toughest part. Since the research reports we provide play a crucial role in any company’s decision-making process, therefore we at SNS Insider always believe that we should choose the best method which gives us results closer to reality. This allows us to reach at a stage wherein we can provide our clients best and accurate investment to output ratio.
Each report that we prepare takes a timeframe of 350-400 business hours for production. Starting from the selection of titles through a couple of in-depth brain storming session to the final QC process before uploading our titles on our website we dedicate around 350 working hours. The titles are selected based on their current market cap and the foreseen CAGR and growth.
The 5 steps process:
Step 1: Secondary Research:
Secondary Research or Desk Research is as the name suggests is a research process wherein, we collect data through the readily available information. In this process we use various paid and unpaid databases which our team has access to and gather data through the same. This includes examining of listed companies’ annual reports, Journals, SEC filling etc. Apart from this our team has access to various associations across the globe across different industries. Lastly, we have exchange relationships with various university as well as individual libraries.

Step 2: Primary Research
When we talk about primary research, it is a type of study in which the researchers collect relevant data samples directly, rather than relying on previously collected data. This type of research is focused on gaining content specific facts that can be sued to solve specific problems. Since the collected data is fresh and first hand therefore it makes the study more accurate and genuine.
We at SNS Insider have divided Primary Research into 2 parts.
Part 1 wherein we interview the KOLs of major players as well as the upcoming ones across various geographic regions. This allows us to have their view over the market scenario and acts as an important tool to come closer to the accurate market numbers. As many as 45 paid and unpaid primary interviews are taken from both the demand and supply side of the industry to make sure we land at an accurate judgement and analysis of the market.
This step involves the triangulation of data wherein our team analyses the interview transcripts, online survey responses and observation of on filed participants. The below mentioned chart should give a better understanding of the part 1 of the primary interview.

Part 2: In this part of primary research the data collected via secondary research and the part 1 of the primary research is validated with the interviews from individual consultants and subject matter experts.
Consultants are those set of people who have at least 12 years of experience and expertise within the industry whereas Subject Matter Experts are those with at least 15 years of experience behind their back within the same space. The data with the help of two main processes i.e., FGDs (Focused Group Discussions) and IDs (Individual Discussions). This gives us a 3rd party nonbiased primary view of the market scenario making it a more dependable one while collation of the data pointers.
Step 3: Data Bank Validation
Once all the information is collected via primary and secondary sources, we run that information for data validation. At our intelligence centre our research heads track a lot of information related to the market which includes the quarterly reports, the daily stock prices, and other relevant information. Our data bank server gets updated every fortnight and that is how the information which we collected using our primary and secondary information is revalidated in real time.

Step 4: QA/QC Process
After all the data collection and validation our team does a final level of quality check and quality assurance to get rid of any unwanted or undesired mistakes. This might include but not limited to getting rid of the any typos, duplication of numbers or missing of any important information. The people involved in this process include technical content writers, research heads and graphics people. Once this process is completed the title gets uploader on our platform for our clients to read it.
Step 5: Final QC/QA Process:
This is the last process and comes when the client has ordered the study. In this process a final QA/QC is done before the study is emailed to the client. Since we believe in giving our clients a good experience of our research studies, therefore, to make sure that we do not lack at our end in any way humanly possible we do a final round of quality check and then dispatch the study to the client.