PropTech Market Report Scope & Overview:
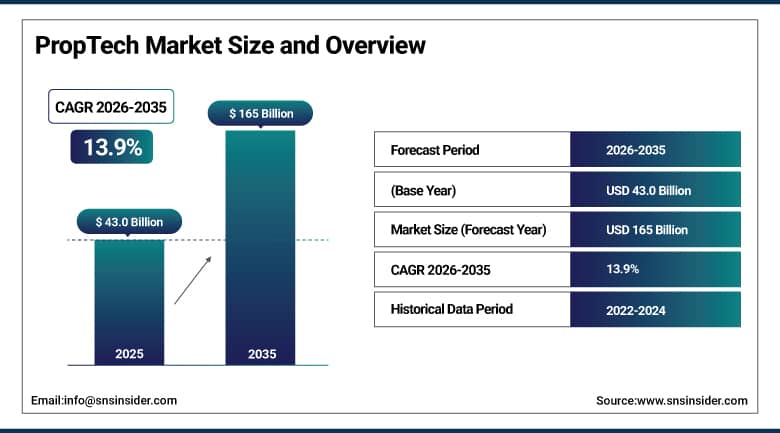
The PropTech Market Market was valued at USD 43.0 billion in 2025 and is expected to reach USD 165 billion by 2035, growing at a CAGR of 13.9% from 2026–2035.
The development of the PropTech Market can be attributed to factors such as the increasing digital transformation in the real estate industry, the increased usage of AI-enabled property management software solutions, and the rising need for smart building systems. The increased use of cloud computing, Internet of Things-based infrastructure, blockchain-based property sales, and virtual property tours is boosting operational efficiencies and customer engagement levels. Moreover, rapid urbanization, investments in smart cities, and demand for real estate analytics are also contributing to market growth.
According to research, around 49% of property managers now use AI-driven analytics tools for valuation and decision-making, while virtual property tours are used by nearly 40% of tenants and buyers for remote viewing experiences.
Market Size and Forecast:
-
Market Size in 2025: USD 43.0 Billion
-
Market Size by 2035: USD 165 Billion
-
CAGR: 13.9% from 2026 to 2035
-
Base Year: 2025
-
Forecast Period: 2026–2035
-
Historical Data: 2022–2024
To Get More Information On PropTech Market - Request Free Sample Report
PropTech Market Trends:
-
AI-powered automated valuation models (AVMs) providing real-time property pricing estimates that challenge traditional broker-driven appraisal processes.
-
Smart building IoT integration connecting HVAC, lighting, access control, and occupancy sensing into unified building management platforms.
-
Virtual reality and augmented reality property tours enabling remote viewing of properties under construction or renovation.
-
Blockchain-based property transaction platforms reducing settlement time and documentation complexity in real estate transactions.
-
Climate risk analytics tools helping real estate investors and lenders quantify physical climate risk exposure in property portfolios.
-
Flexible workspace management software supporting hot-desking, conference room booking, and hybrid workplace management.
-
Tenant experience applications digitizing maintenance requests, rent payment, community communication, and amenity booking for residential tenants.
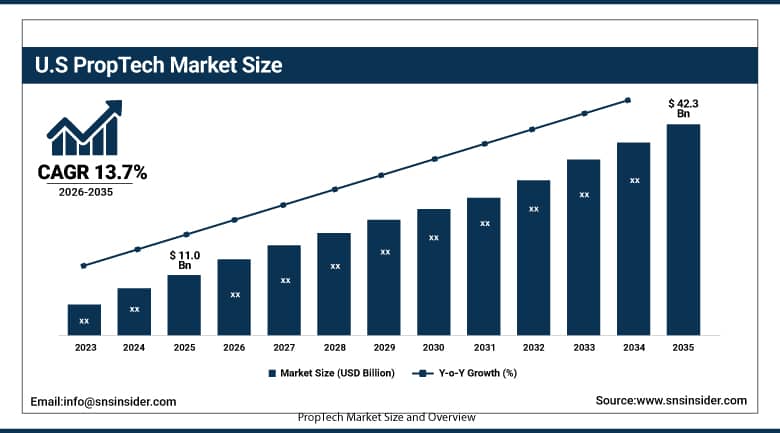
U.S. PropTech Market Size Outlook:
The U.S. PropTech Market was valued at USD 11.0 billion in 2025 and is expected to reach USD 42.3 billion by 2035, at a CAGR of 13.7% from 2026 to 2035.
US PropTech Market growth is influenced by the adoption of artificial intelligence-driven property management systems, increase in the demand for smart buildings, and an increase in online real estate transactions. Growing investments made in cloud computing solutions, virtual property tours, Internet of Things-enabled infrastructure, and smart cities are fueling the growth of the market.
The U.S. PropTech investment ecosystem is the world's most active, with venture capital investment in American PropTech companies exceeding USD 4 billion annually in recent years. This investment is funding a new generation of AI-powered PropTech tools for automated property valuation, predictive maintenance, AI-driven leasing assistants, and climate risk analytics that are expanding the capabilities of the sector beyond traditional property management software.
PropTech Market Segment Insights:
-
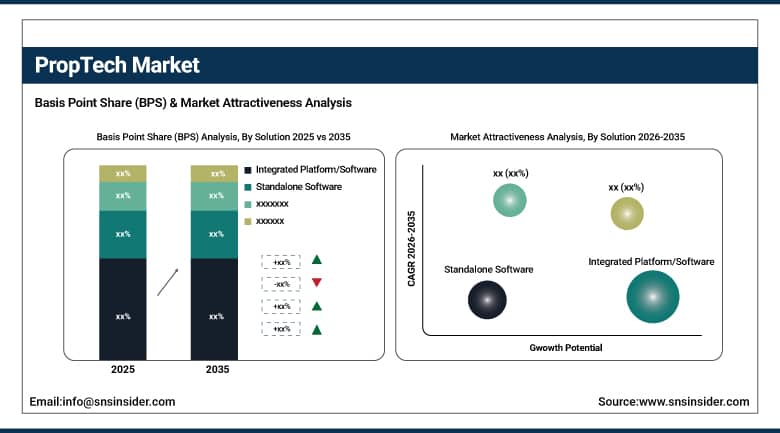
By Solution, Integrated Platform/Software segment dominated the PropTech Market in 2025 with 68% share; Standalone Software segment fastest growing during 2026–2035.
-
By Deployment, On-premise segment dominated the PropTech Market in 2025 with ~58% share; Cloud segment fastest growing during 2026–2035.
-
By Property Type, Commercial segment dominated the PropTech Market in 2025 with 61% share; Residential segment fastest growing during 2026–2035.
-
By End-user, Real Estate Agents segment dominated the PropTech Market in 2025 with 39% share; Property Investors segment fastest growing during 2026–2035.
By Solution, Integrated Platform/Software segment dominates the PropTech Market, Standalone Software segment expected to grow fastest
The Integrated Platform/Software segment led the PropTech Market in 2025 owing to the growing preference for consolidated property management, transactions processing, tenant interaction, and analytics services on one platform. Companies opted for integrated platforms to simplify their workflows, avoid problems related to software interoperability, and enhance decision-making capabilities. Moreover, they offer automation, AI-powered analytics, and cloud-based capabilities, which make them ideal for managing extensive property portfolios and business real estate management operations worldwide.
Standalone Software segment is expected to exhibit the fastest growth rate from 2026 to 2035 because of its increasing popularity among small and medium-sized real estate companies due to affordability and specialized offerings. Organizations often favor standalone solutions when they need specific functions like virtual tours, leasing management, smart building monitoring, and digital payments without deploying full-fledged integrated solutions.
By Deployment, On-premise segment dominates the PropTech Market, Cloud segment expected to grow fastest
In the PropTech Market in 2025, the on-premise segment held the leading position, owing to the overwhelming preference for the same by the real estate organizations because of concerns related to control over highly confidential operational, financial, and tenant information. On-premise technology was considered ideal due to its ability to provide better security, compliance with regulations, and customization in accordance with organizational needs. The commercial property owners and existing real estate companies opted for on-premise for its durability and efficiency.
The cloud segment will experience the highest growth rate between 2026 and 2035 due to the growing need for flexible, scalable, and remotely available property management systems. Cloud computing helps in efficient collaboration between real estate agents, investors, property managers, and tenants without incurring additional overhead costs on IT infrastructure. The growing adoption of AI, smart buildings, mobile apps, and digital transformation in the real estate industry will propel the adoption of cloud computing in the PropTech market.
By Property Type, Commercial segment dominates the PropTech Market, Residential segment expected to grow fastest
The commercial segment led the PropTech Market in 2025, thanks to fast-paced digitalization in offices, retail, warehouses, and mixed-use commercial properties. The commercial real estate sector invested significantly in intelligent building infrastructure, automation in facility management, energy management, and tenant management systems. The high investment capabilities and increasing need for data analytics in property management fueled the leading position of the commercial segment in the global PropTech market.
The residential property sector is predicted to exhibit the highest growth rate during the forecast period owing to factors such as urbanization, adoption of smart homes, and an increased need for digital platforms for property transactions. Individuals will increasingly rely on virtual tours, digital property management, online payment gateways, and artificial intelligence-based property searching capabilities. Growth in the residential sector will also be facilitated by increased internet usage and PropTech investments.
By End-user, Real Estate Agents segment dominate the PropTech Market, Property Investors segment expected to grow fastest
The Real Estate Agents category holds the largest market share of the PropTech Market in 2025 due to the growing application of PropTech solutions in listing, reaching out to customers, virtual property viewing, and executing deals. The use of advanced technology such as AI-based analysis, CRM software, and mobile applications by real estate agents to make their work easy and efficient saw a significant surge. The requirement for quick execution of deals, generating leads, and operational efficiencies are some of the major factors driving the adoption of PropTech by real estate agents.
The Property Investors segment is anticipated to witness a significant CAGR in terms of growth from 2026 to 2035 due to the increasing need for PropTech solutions that aid in identifying profitable opportunities, managing portfolios, and lowering the risks associated with investments. Moreover, the preference for smart building investments, fractional ownership models, and digital platforms for real estate investments is significantly driving the adoption of innovative PropTech solutions among property investors globally.
PropTech Market Regional Analysis:
|
Region |
Major Country |
Share within Region (%) |
|---|---|---|
|
North America |
United States |
78% |
|
Europe |
United Kingdom |
29% |
|
Asia Pacific |
China |
44% |
|
Middle East & Africa |
UAE |
41% |
|
Latin America |
Brazil |
49% |
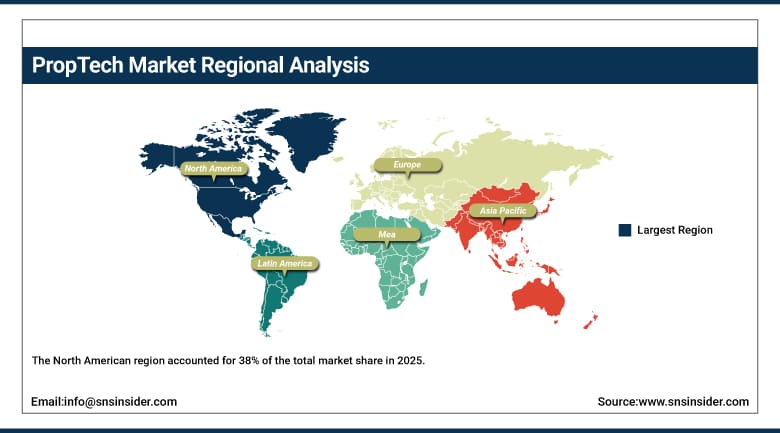
North America PropTech Market Insights
The North American region accounted for 38% of the total market share in 2025, owing to its robust digital infrastructure, high penetration of smart building technology, and heavy investments in AI-based real estate platforms. This growth can be attributed to the availability of PropTech firms in the region, higher adoption of cloud computing, as well as growing virtual property management demands in the residential and commercial property sectors. Increased smart city initiatives, adoption of IoT-driven buildings, and digital property deals are some of the other factors fueling market growth.
Get Customized Report as Per Your Business Requirement - Enquiry Now
Asia Pacific PropTech Market Insights
The Asia-Pacific region is experiencing the highest growth in the PropTech Market because of rapid urbanization and increasing efforts toward smart cities, along with the digitization of the real estate industry. With the increasing use of smartphones and internet access among people, there is an increased interest among consumers to leverage online property portals and digital payment solutions. Increased investment in infrastructure development, especially in emerging countries, is contributing to the high demand for intelligent building solutions and cloud-based property management solutions.
Europe PropTech Market Insights
The Europe region has been witnessing substantial development in the PropTech Market on account of growing adoption of sustainable building technologies, smart infrastructure development, and digital property management solutions. Increasing focus on energy-efficient buildings along with stringent building regulations is driving the installation of building automation systems that employ Artificial Intelligence technology. Other factors driving the growth of the regional market include increasing investment in smart cities, demand for collaborative working spaces, and increasing adoption of blockchain technology for property transfers.
Middle East & Africa and Latin America PropTech Market Insights
There is an increase in the adoption rate of PropTech solutions in Middle East & Africa and Latin America because of the expansion of urban construction projects, the digitalization of real estate transactions, and investments in intelligent infrastructure. With increased construction activities and requirements for property management software, companies in the real estate industry are increasingly embracing cloud computing solutions and artificial intelligence technology. Moreover, there is an increase in smartphone ownership and internet penetration, which is boosting the accessibility of online real estate services.
PropTech Market Growth Drivers
-
Rising adoption of AI-powered property management platforms and digital real estate transactions is accelerating operational efficiency across global real estate ecosystems
The fast adoption of digital property management systems, artificial intelligence-driven analytics, and automated transaction systems is driving the revolution of the global real estate industry. Companies in the real estate industry, realtors, landlords, and property managers are embracing PropTech solutions to improve efficiency in the leasing of properties, communications with tenants, property surveillance, and valuation. Through the adoption of cloud-based solutions, real estate companies can facilitate an easy transaction process and communicate effectively with their clients. In addition, the emergence of technologies such as virtual property tours, smart contracts, and online payment systems has streamlined the transaction process. Furthermore, the widespread adoption of smartphones and Internet connectivity has facilitated the adoption of digital solutions by consumers.
PropTech Market Restraints
-
Data privacy concerns and cybersecurity risks associated with digital property platforms are reducing consumer confidence in connected real estate ecosystems
An increase in the dependence of cloud computing property management software and online transaction platforms results in higher chances of cyber attacks. The reason is that the data storage capacities of PropTech platforms make them an ideal target for hackers. This could have adverse effects on brand image and consumer confidence. Apart from this, varying data protection regulations in different locations constitute a major challenge for multinational companies. Also, the absence of advanced cyber security systems makes the task difficult. These challenges have contributed significantly towards hindering the development of real estate ecosystem.
PropTech Market Opportunities
-
Increasing demand for sustainable buildings and energy-efficient property solutions is creating strong growth potential for intelligent PropTech innovations worldwide
The increasing knowledge about the environment, coupled with rigorous energy efficiency measures, will create a number of chances for sustainable PropTech innovations in both residential and commercial infrastructure. Smart energy monitoring systems, automated lighting control technology, and AI-powered climate control technology have become popular among building owners and facility managers due to their ability to lower energy bills and carbon footprint. The desire of buyers to live in energy-efficient buildings will motivate the use of intelligent analytics and predictive maintenance tools in property management. Governments of several countries are also encouraging sustainable urban development through a number of incentives and smart city programs.
Recent Developments:
-
2025: CoStar Group acquired a leading AI-powered commercial real estate lease abstraction platform, integrating natural language processing and machine learning capabilities directly into its LoopNet and CoStar commercial property research and transaction management ecosystem.
-
2024: Yardi Systems launched Yardi Energy AI, an artificial intelligence-powered energy management module for its Voyager property management platform, enabling automated energy optimization, utility bill anomaly detection, and regulatory compliance reporting for commercial and residential property portfolios across the U.S. and Europe.
-
2023: Zillow launched its enhanced Zestimate AI model using deep learning on satellite imagery, interior photos, floor plans, and transaction data to provide property-level valuation estimates with materially reduced median error rates, demonstrating the potential of machine vision in real estate analytics.
Key Players:
-
Zillow Group
-
Opendoor Technologies
-
Compass Inc.
-
CoStar Group
-
Matterport Inc.
-
Procore Technologies
-
AppFolio Inc.
-
Yardi Systems
-
RealPage Inc.
-
Buildium
-
VTS
-
Guesty
-
Altus Group
-
NoBroker
-
Magicbricks
-
Housing.com
-
Aurum PropTech
-
Square Yards
PropTech Market Report Scope:
| Report Attributes | Details |
|---|---|
| Market Size in 2025 | USD 43.0 Billion |
| Market Size by 2035 | USD 165 Billion |
| CAGR | CAGR of 13.9% From 2026 to 2035 |
| Base Year | 2025 |
| Forecast Period | 2026-2035 |
| Historical Data | 2022-2024 |
| Report Scope & Coverage | Market Size, Segments Analysis, Competitive Landscape, Regional Analysis, DROC & SWOT Analysis, Forecast Outlook |
| Key Segments | • By Solution (Integrated Platform/Software, Standalone Software) • By Deployment (Cloud, On-premise) • By Property Type (Residential, Commercial) • By End-user (Real Estate Agents, Housing Associations, Property Investors, Others) |
| Regional Analysis/Coverage | North America (US, Canada), Europe (Germany, UK, France, Italy, Spain, Russia, Poland, Rest of Europe), Asia Pacific (China, India, Japan, South Korea, Australia, ASEAN Countries, Rest of Asia Pacific), Middle East & Africa (UAE, Saudi Arabia, Qatar, South Africa, Rest of Middle East & Africa), Latin America (Brazil, Argentina, Mexico, Colombia, Rest of Latin America). |
| Company Profiles | Zillow Group, Opendoor Technologies, Compass Inc., CoStar Group, Redfin Corporation, Matterport Inc., Procore Technologies, AppFolio Inc., Yardi Systems, RealPage Inc., Buildium, VTS, Guesty, Altus Group, NoBroker, Magicbricks, Housing.com, PropTiger, Aurum PropTech, Square Yards |
Get in Touch
