PET Scanners Market Report Scope & Overview:
Get more information on PET Scanners Market - Request Free Sample Report
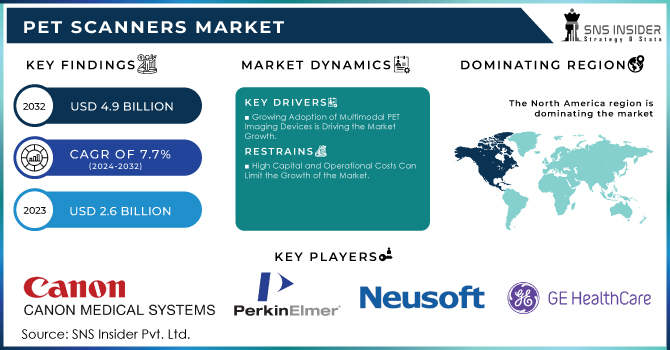
The PET Scanners Market Size was valued at USD 2.6 Billion in 2023, and is expected to reach USD 4.9 Billion by 2032, and grow at a CAGR of 7.7%.
PET scanning has become a critical tool in the war against breast cancer, providing critical data on the extent of disease and response to treatment and, thus, substantially influencing the treatment of patients. In particular, PET scanning is critical in the staging of the disease: it is the only method for accurately assessing the size and location of the primary tumor, the extent of involvement of lymph node tissues, and the number of distant metastases. This is crucial for the determination of the stage of the disease and, thus, for the decision about the kind of intervention that would be most appropriate. At the same time, PET scanning is also a vital tool in the monitoring of the disease response to treatment: it is capable of detecting even the most subtle changes in the rates of tumor uptake of glucose, which indicates the effectiveness of chemotherapy or radiotherapy or the presence of resistance to either.
In addition, because it is highly sensitive, PET scanning also allows early detection of the recurrence of the disease: it can identify potentially life-threatening cases of the disease that have not yet given rise to any symptoms. At the same time, developments of the recent years have further improved the accuracy and reliability of PET. New kinds of PET scanners called hybrid PET/CT scanners have become available that combine the advantages of both methods. Development of PET tracers targeting specific molecular pathways of breast cancer in patients has become another powerful tool in assessing the extent of disease and guiding the choice of treatment. At present, breast cancer remains a globally significant health burden, with the World Health Organization reporting 2.3 million new cases and 685,000 deaths in 2023. Considering this, the development of diagnostic methods with proven effectiveness for patients with the disease is critical, and PET scanning clearly delivers such value.
MARKET DYNAMICS:
Key Drivers:
-
Growing Adoption of Multimodal PET Imaging Devices is Driving the Market Growth.
-
Increasing Use of PET In Breast Cancer Detection Drives Market Growth.
Restraints:
-
High Capital and Operational Costs Can Limit the Growth of the Market.
-
Unfavourable Regulatory Guidelines Hinder Market Growth.
Opportunity:
-
Technological Advancements in Radiopharmaceuticals and PET Systems Present Substantial Opportunities for The PET Scanners Industry.
-
Increasing Investments, Funds, and Grants by Public-Private Organizations Posing a Lucrative Growth Opportunity for the Market.
KEY MARKET SEGMENTATION:
By Modality
The PET-CT segment dominated the market, holding a revenue share of 82% in 2023. It is expected to continue leading with the fastest CAGR of 5.5% during the forecast period. The growth is attributable to technological advances that enhance image quality and reduce scan time, the increasing prevalence of cancer and cardiovascular disorders that necessitate early diagnosis, and the growing focus on personalized medicine leading to more research activities. For example, in June 2024, Siemens Healthineers launched the Biograph Trinion, its latest PET/CT scanner, at the Society of Nuclear Medicine and Molecular Imaging ‘s annual meeting.
The PET MRI segment has witnessed rapid growth because of the increasing need for hybrid imaging technologies that combine PET’s metabolic information with MRI’s anatomical detail. Notably, this combination significantly improves diagnostic accuracy in various fields, such as oncology, neurology, and cardiology where the understanding of structure and function is critical. For example, in June 2023, GE HealthCare launched Signa PET/MR Air, which includes several technological advances to help diagnose different conditions, including Alzheimer’s and prostate cancer, at the Chicago Society of Nuclear Medicine and Molecular Imaging conference.
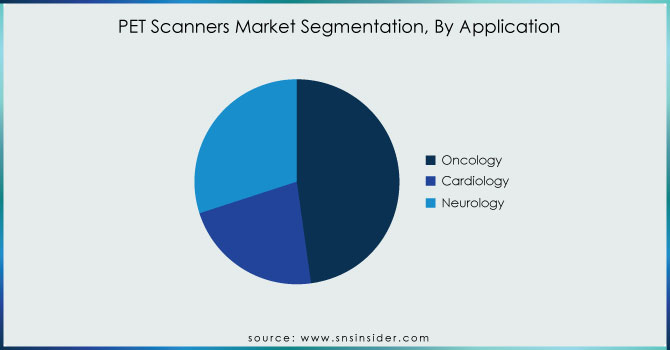
By Application
The oncology segment was the leading one, holding a revenue share of 48% in 2023. The growth is attributed to the increasing cases of cancer that require effective screening and monitoring. PET scans are vital in identifying malignancies, assessing tumors’ metabolism, and understanding how patients will respond to treatment. Moreover, as published by the National Library of Medicine, they play a fundamental role in staging and restaging various cancers, such as of the lung, breast, and colon, to support timely interventions that can significantly increase patients’ survival rates.
The cardiology segment will observe the fastest growth rate during the forecast period. This is because of the high incidence of cardiovascular diseases, and the growing demand for non-invasive treatments to manage cardiovascular disease. According to the article “Epidemiological Features of Cardiovascular Disease in Asia” made a presentation in the JACC journals, today, cardiovascular disease continues to be the leading cause of death and premature death worldwide.
Get Customized Report as per your Business Requirement - Request For Customized Report
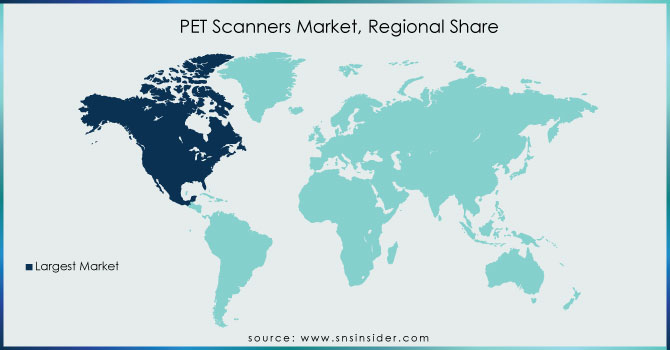
REGIONAL ANALYSIS:
North America, consisting of the US and Canada, held the largest market share in 2023. The North America market growth is driven by factors such as increasing funding for oncology research, greater adoption in the healthcare/medical sector, and the presence of major market players. The U.S. PET scanner market has become intense due to the robust development and market launch of these machines to improve imaging quality, lowering radiation exposure, and reduce scan times. The emergence of digital PET scanners has high sensitivity and resolution.
The use of PET scans in the U.S. healthcare system is being driven by the increasing use of personalized medicine for optimal patient care. PET scans are also increasingly used to track responses to the radiotracer in PET probe candidates. In addition, technology firms and healthcare providers are entering into agreements to study new radiotracers that get deposits in some but not all areas of the part of the body. Then many more radiotracers can be used clinically, meaning that clinical applications have been expanded.
KEY PLAYERS:
The key market players are Kindsway Biotech, Canon Medical Systems, PerkinElmer, Neusoft Medical Systems Co., Ltd., GE Healthcare, Mediso Ltd., Koninklijke Phillips N.V., Positron Corporation, Siemens Healthineers AG, Shimadzu Corporation and Other players.
RECENT DEVELOPMENTS
-
In February 2023, UI participated as a Platinum partner at the Arab Health 2023. This event took place in Dubai, United Arab Emirates from January 30 to February 2. At that event, this company showcased a vast number of advanced diagnostic and medical imaging devices including the, which is designed to produce the highest-quality images. It also showcased the and the that is an ultra-fast high-resolution digital PET/CT scanner. Moreover, UI showcased the and the.
-
In May 2022, Mediso Ltd announced that it acquired the Bartec Technologies Ltd. It is a UK-based company that specializes in supplying and supporting Nuclear Medicine and Molecular Imaging equipment and accessories.
| Report Attributes | Details |
|---|---|
| Market Size in 2023 | US$ 2.6 Billion |
| Market Size by 2032 | US$ 4.9 Billion |
| CAGR | CAGR of 7.7% From 2024 to 2032 |
| Base Year | 2023 |
| Forecast Period | 2024-2032 |
| Historical Data | 2020-2022 |
| Report Scope & Coverage | Market Size, Segments Analysis, Competitive Landscape, Regional Analysis, DROC & SWOT Analysis, Forecast Outlook |
| Key Segments | •By Modality (PET-CT, PET-MRI) •By Application (Oncology, Cardiology, Neurology) •By End Use (Hospitals, Diagnostic Imaging Centers, Academic & Research Institutes) |
| Regional Analysis/Coverage | North America (US, Canada, Mexico), Europe (Eastern Europe [Poland, Romania, Hungary, Turkey, Rest of Eastern Europe] Western Europe] Germany, France, UK, Italy, Spain, Netherlands, Switzerland, Austria, Rest of Western Europe]), Asia Pacific (China, India, Japan, South Korea, Vietnam, Singapore, Australia, Rest of Asia Pacific), Middle East & Africa (Middle East [UAE, Egypt, Saudi Arabia, Qatar, Rest of Middle East], Africa [Nigeria, South Africa, Rest of Africa], Latin America (Brazil, Argentina, Colombia, Rest of Latin America) |
| Company Profiles | Kindsway Biotech, Canon Medical Systems, PerkinElmer, Neusoft Medical Systems Co., Ltd., GE Healthcare, Mediso Ltd., Koninklijke Phillips N.V., Positron Corporation, Siemens Healthineers AG, Shimadzu Corporation and Other players |
| Key Drivers | •Growing Adoption of Multimodal PET Imaging Devices is Driving the Market Growth. •Increasing Use of PET In Breast Cancer Detection Drives Market Growth. |
| RESTRAINTS | •High Capital and Operational Costs Can Limit the Growth of the Market. •Unfavourable Regulatory Guidelines Hinder Market Growth. |
Frequently Asked Questions
Ans: The PET Scanners Market was valued at USD 2.6 Billion in 2023.
Ans: The expected CAGR of the Global PET Scanners Market during the forecast period is 7.7%
Ans: Hospitals held the largest share in the PET Scanners Market in 2023.
Ans: The PET Scanners Market will be valued at USD 4.9 Billion in 2032.
Ans: The North America led PET Scanners Market.
Get in Touch
