Pet Wheelchair Market Report Scope & Overview:
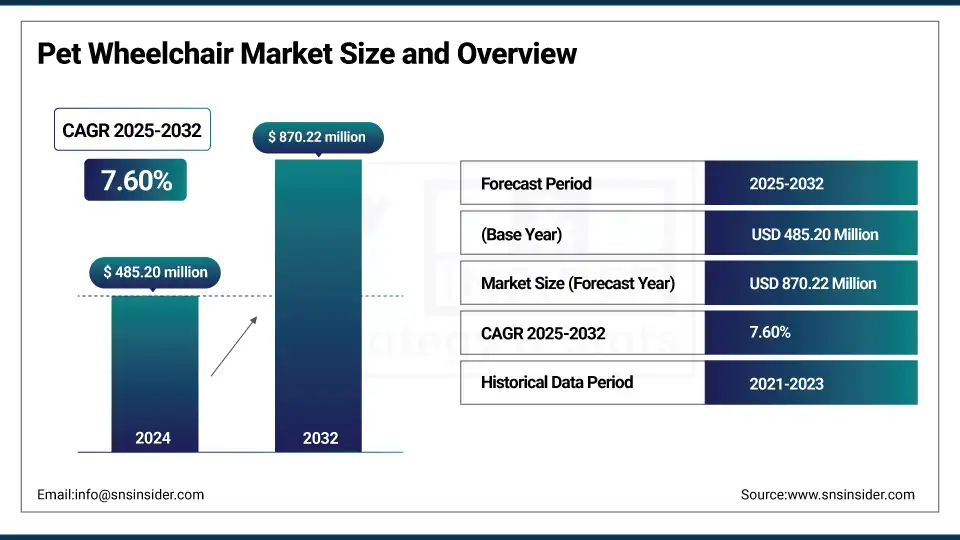
The pet wheelchair market size was valued at USD 485.20 million in 2024 and is expected to reach USD 870.22 million by 2032, growing at a CAGR of 7.60% over the forecast period of 2025-2032.
Increased pet ownership is the major driver for the global pet wheelchairs market. Urban and nuclear families appreciate the presence of pets as companions. With discretionary income on the rise, pet parents are more open to purchasing high-end mobility solutions for aging or injured pets. Pet humanization is also fueling a desire for comfort-centric and personalized products. Moreover, lifestyle change and knowledge of animal rehabilitation are driving the demand for assistive-living devices. These pet wheelchairs market trends are driving product innovation, product diversification, and global acceptance of pet wheelchairs.
For instance, in January 2025, Euromonitor reported that global pet care spending exceeded USD 270 billion in 2024, driven by rising demand for premium products, including pet wheelchairs and mobility aids.Top of Form
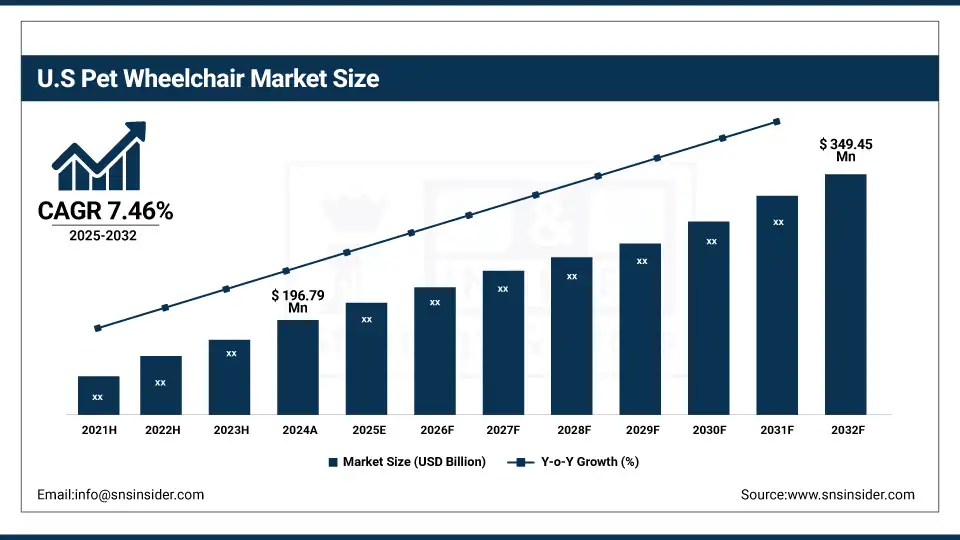
The U.S. pet wheelchair market was valued at USD 196.79 million in 2024 and is expected to reach USD 349.45 million by 2032, growing at a CAGR of 7.46% over 2025-2032.
The U.S. pet wheelchair market is dominated due to great infrastructure for veterinary care that includes specialty ICUs, specialists and telemedicine, and rehabilitation by experienced professionals. Rising geriatric pet care and favorable insurance policies support the market for personalized mobility solutions. The strong medical society and the intervention in its timely manner can help them, so it is one of the reasons for the prosperity of the U.S. pet wheelchair market.
For instance, in March 2024, AVMA reported that the U.S. veterinary services hit USD 73.2B, boosting demand for advanced mobility aids, including pet wheelchairs.
Market Dynamics:
Drivers:
-
Technological Innovations Using Lightweight Materials Drives the Pet Wheelchair Market Growth
Technological advancements incorporated in lightweight materials are a major driving the pet wheelchair market analysis. Such supplies as carbon fiber and aluminum, in turn, help to decrease weight, travelers, strength, and general comfort and mobility. When combined with 3D printing for customization, they are giving some strong, ergonomic solutions. This promotes user satisfaction and accessibility and drives the percentage of pet wheelchairs globally.
For instance, in February 2024, TechNavio reported a 12.4% growth in 3D-printed pet wheelchairs using lightweight materials including carbon fiber.Top of Form
Restraints:
-
Risk of Infection and Pain in Certain Methods is Restraining the Pet Wheelchair Market Growth
The lack of a veterinarian’s approval is a major challenge in the pet wheelchair market as it reduces the credibility, restricts prescriptions, and poses a risk of misuse. Tolerance accuracy, treatment incorporation, and acceptance are reduced without professional endorsement. This leads to slower adoption, limited distribution, and slower market education, which in turn, stunts the growth of the pet mobility solutions industry.
For instance, in May 2024, PetTech Insights reported that 48% of the U.S. vets hesitate to recommend pet wheelchairs due to limited clinical validation.
Segmentation Analysis:
By Pet
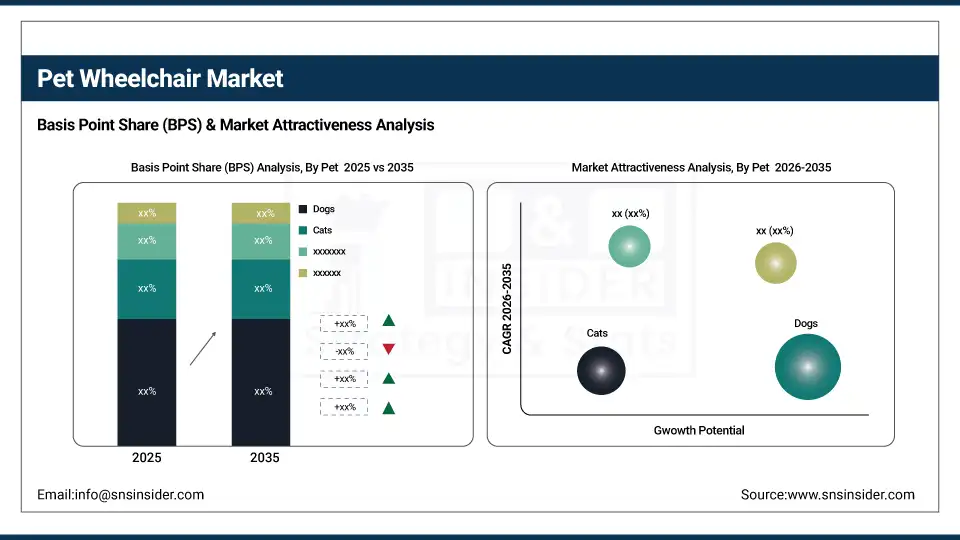
Dogs is the dominant segment in the global pet wheelchair market, with a 70.22% market share in 2024, as they have higher moving needs, bigger body sizes, and a higher incidence of diseases, including arthritis, hip dysplasia, and spinal cord injury. Being very mobile and a part of daily life, pet owners are willing to spend on a wheelchair for dogs, which is durable, customized, and supportive.
The Cats segment plays a very important role in the pet wheelchair market growth, as it is the fastest-growing segment with a CAGR of 8.31%, as a growing number of cats become immobile with conditions including paralysis and arthritis. Better designs specific to cats' lower body size and behavior, and the rise in humanization and willingness to invest in more advanced care, are boosting the number of adoptions. Tele-vet support and lightweight and adjustable options are helping wheelchairs become more common for cat rehabilitation.
By Product
In 2024, the Adjustable Wheelchairs segment dominated the pet wheelchair market share with a 74.17%, and also emerged as the fastest growing segment over the forecast period, as they are versatile, simply customized, and suitable for dogs of all sizes, breeds, and mobility levels. These wheelchairs are also adjustable for height, width, and length, thus achieving a good fit and better comfort. They are pet owner's and veterinarians’ favorites for long-term use, rehabilitation, and as growth aids in growing animals, the most convenient and popular choice in dog wheelchairs.
By Material
Aluminum held a significant market share of 76.92% of the global pet wheelchair market in 2024, owing to its perfect combination of tensile strength, lightness of fiber, durability, and cost. It is easy to navigate, helps reduce strain on animals, and will not rust with repeated daily use. Affordable and accessible to consumers, aluminum remains a favorite material for manufacturers to produce ergonomic, adjustable shapes that are in demand and suit every performance and price level.
Others, including materials including carbon fiber and titanium, is one of the fastest-growing segments in the pet wheelchair market, growing at a CAGR of 8.05% owing to the need for ultra-lightweight, long-wearing, and high-performance alternatives was escalating. These high-performing materials provide advanced customization, increased mobility, and comfort, all key factors in enhancing pet owner satisfaction for chronic conditions and long-term rehab patients.
By Distribution Channel
Others, comprising veterinary clinics, rehab centers, and specialty pet stores, account for the largest share in the pet wheelchair industry, owing to professional fittings, medical supervision, and custom mobility solutions. These channels guarantee precise diagnosis and personalization of the devices, increasing trust and uptake. Professional recommendations are strongly trusted by pet owners, particularly for complicated or chronic mobility problems, and this accounts for the continued dominance of this segment.
E-Commerce is the most rapidly growing segment in the pet wheelchair market industry, owing to the convenience, variety, affordability, and direct-to-consumer availability of many products. Further, digital commerce platforms provide virtual fitting guides, customer reviews, and also expand businesses’ global footprints, thereby enabling pet owners to find the correct mobility products for their animals.
By End-User
Pet Owners dominate the pet wheelchair market share, driven by growing pet humanization, emotional attachment, and willingness to pay for advanced treatments. With the growing prevalence of mobility devices, ease of online shopping, and the owner's desire to give their pet the best quality of life, this trend is now taking off as owners look to independently purchase the ideal, comfortable wheelchair for their pet, rather than depending on a veterinary channel.
Veterinary Clinics represent the fastest-growing segment of the pet wheelchair industry, owing to greater incorporation of mobility aids in treatment. Clinics offer expert diagnosis, proper fitting, and rehabilitation advice, which leads to better pet outcomes. On the increasing prevalence of chronic and age-related conditions, there are more pet owners visiting vets and seeking trusted guidance, who also promote wheelchairs through their clinical channels. faced with these factors, the market is flourishing.
Regional Analysis:
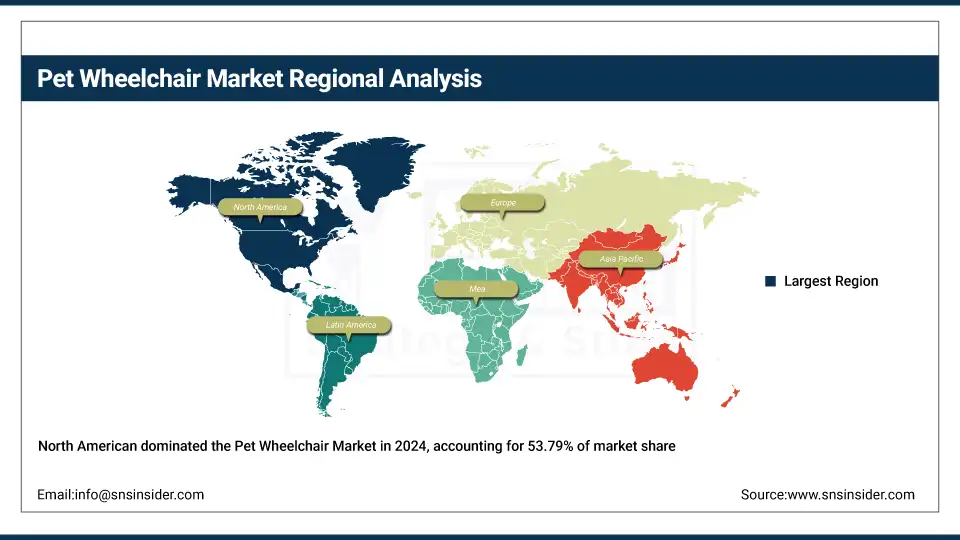
In 2024, the North American region dominated the pet wheelchair industry and accounted for 53.79% of the overall revenue share. owing to a high prevalence of pet owners, well-developed veterinary facilities, and rising consumer expenditure on pet wellbeing. These factors have influenced the demand for customized mobility aids, which are widely available in the region, strong e-commerce networks in the region, and increasing awareness about pet rehabilitation. Mirroring pets’ health insurance coverage, growing humanization of pets, and technology advances also boost demand. Moreover, the existence of prominent players in the market and the highly specialized clinics in the U.S and Canada further strengthens the market position of North America within the global pet wheelchair market share.
The pet wheelchair market in Europe is also growing considerably, owing to the growing adoption of pets, awareness of animal welfare, and increasing veterinary rehabilitation services. Other developed markets including the U.K., France, and Germany are witnessing an increasing demand for mobility aids due to the humanization of pets, the ageing pet population, and the availability of advanced and customized mobility aids through clinical and online channels.
Asia Pacific is the most rapidly expanding market for the pet wheelchair industry, with a CAGR of 8.48% over 2025-2032, owing to the increasing pet adoption, urbanization, and increasing disposable income in countries including China, India, Japan, and South Korea. With pet humanization on the rise, owners are increasingly ready to spend money on mobility support for elderly or disabled pets. The growth of veterinary care infrastructure and awareness of pet rehabilitation in the area is also booming. E-commerce is also helping bring pet wheelchairs to a broader market. Furthermore, regional players introducing low-cost, customized, and lightweight products are contributing to the expansion of the Asia Pacific pet wheelchair market.
The Middle East & Africa pet wheelchair market is expanding gradually with the increasing urban population, growing number of pet owners, and adoption of new attitudes towards pet healthcare in countries including the UAE and South Africa. Growth, however, is hindered by expensive products, lack of access to veterinary rehabilitation services, low insurance coverage rates, and lack of awareness. All of this acts as a barrier to mass market penetration in the region.
The pet wheelchairs market in Latin America is progressing with new launches and increasing pet adoption, along with increasing awareness about animal mobility can help to increase the demand in countries including Brazil, Mexico, and Argentina in the region. The growing humanization of pets and a rising penetration of e-commerce platforms are helping support demand, while high costs and a lack of specialized services represent moderate barriers to scale.
Key Players:
Pet wheelchair companies include Walkin' Pets, K9 Carts, Eddie's Wheels, Best Friend Mobility, Doggon' Wheels, Walkabout Harnesses, Hongkong Wheelchairs for Dogs Co., Ltd., NOVA Pet Wheelchairs, PetMobile, GingerLead, and other players.
Recent Developments:
-
In March 2024, launched the Pro Series wheelchairs with improved suspension and breathable materials; partnered with the U.S. veterinary rehab centers to promote clinical adoption of mobility aids.
-
In February 2024, expanded global custom fitting via virtual vet consultations; introduced a new adjustable quad cart designed specifically for long-bodied breeds, including dachshunds.
Report Attributes | Details |
---|---|
Market Size in 2024 | USD 485.20 million |
Market Size by 2032 | USD 870.22 million |
CAGR | CAGR of 7.60% From 2025 to 2032 |
Base Year | 2024 |
Forecast Period | 2025-2032 |
Historical Data | 2021-2023 |
Report Scope & Coverage | Market Size, Segments Analysis, Competitive Landscape, Regional Analysis, DROC & SWOT Analysis, Forecast Outlook |
Key Segments | • By Pet (Dogs, Cats, Others) • By Product (Adjustable Wheelchairs, Non-Adjustable Wheelchairs) • By Material (Aluminum, Others) • By Distribution Channel (E-Commerce, Others) • By End User (Veterinary Clinics, Pet Rehabilitation Centers, Pet Owners)" |
Regional Analysis/Coverage | North America (US, Canada, Mexico), Europe (Germany, France, UK, Italy, Spain, Poland, Turkey, Rest of Europe), Asia Pacific (China, India, Japan, South Korea, Singapore, Australia, Rest of Asia Pacific), Middle East & Africa (UAE, Saudi Arabia, Qatar, South Africa, Rest of Middle East & Africa), Latin America (Brazil, Argentina, Rest of Latin America) |
Company Profiles | Walkin' Pets, K9 Carts, Eddie's Wheels, Best Friend Mobility, Doggon' Wheels, Walkabout Harnesses, Hongkong Wheelchairs for Dogs Co., Ltd., NOVA Pet Wheelchairs, PetMobile, GingerLead and other players. |
Table of Contents:
1. Introduction
1.1 Market Definition
1.2 Scope (Inclusion and Exclusions)
1.3 Research Assumptions
2. Executive Summary
2.1 Market Overview
2.2 Regional Synopsis
2.3 Competitive Summary
3. Research Methodology
3.1 Top-Down Approach
3.2 Bottom-up Approach
3.3. Data Validation
3.4 Primary Interviews
4. Market Dynamics Impact Analysis
4.1 Market Driving Factors Analysis
4.1.1 Drivers
4.1.2 Restraints
4.2 PESTLE Analysis
4.3 Porter’s Five Forces Model
5. Statistical Insights and Trends Reporting
5.1 Incidence & Prevalence (2023)
5.2 Prescription & Usage Trends, by Region (2023)
5.3 Device Volume & Adoption (2020–2032)
5.4 Spending Behavior, by Region (2023)
5.5 Product Integration & Customization Trends (2023)
6. Competitive Landscape
6.1 List of Major Companies, By Region
6.2 Market Share Analysis, By Region
6.3 Product Benchmarking
6.3.1 Product specifications and features
6.3.2 Pricing
6.4 Strategic Initiatives
6.4.1 Marketing and promotional activities
6.4.2 Distribution and supply chain strategies
6.4.3 Expansion plans and new product launches
6.4.4 Strategic partnerships and collaborations
6.5 Technological Advancements
6.6 Market Positioning and Branding
7. Pet Wheelchair Market Segmentation, By Pet
7.1 Chapter Overview
7.2 Dogs
7.2.1 Dogs Market Trends Analysis (2021-2032)
7.2.2 Dogs Market Size Estimates and Forecasts to 2032 (USD Billion)
7.3 Cats
7.3.1 CatsMarket Trends Analysis (2021-2032)
7.3.2 CatsMarket Size Estimates and Forecasts to 2032 (USD Billion)
7.4 Others
7.4.1 Others Market Trends Analysis (2021-2032)
7.4.2 Others Market Size Estimates and Forecasts to 2032 (USD Billion)
8. Pet Wheelchair Market Segmentation, By Product
8.1 Chapter Overview
8.2 Adjustable Wheelchairs
8.2.1 Adjustable WheelchairsMarket Trends Analysis (2021-2032)
8.2.2 Adjustable WheelchairsMarket Size Estimates And Forecasts To 2032 (USD Billion)
8.3 Non-Adjustable Wheelchairs
8.3.1 Non-Adjustable Wheelchairs Market Trends Analysis (2021-2032)
8.3.2 Non-Adjustable Wheelchairs Market Size Estimates And Forecasts To 2032 (USD Billion)
9. Pet Wheelchair Market Segmentation, By Material
-
-
Chapter Overview
-
9.2 Aluminum
9.2.1 Aluminum Market Trends Analysis (2021-2032)
9.2.2 Aluminum Market Size Estimates And Forecasts To 2032 (USD Billion)
9.3 Others
9.3.1 Others Market Trends Analysis (2021-2032)
9.3.2 Others Market Size Estimates And Forecasts To 2032 (USD Billion)
10. Pet Wheelchair Market By Distribution Channel
10.1 Chapter Overview
10.2 E-Commerce
10.2.1 E-Commerce Market Trends Analysis (2021-2032)
10.2.2 E-Commerce Market Size Estimates And Forecasts To 2032 (USD Billion)
10.3 Others
10.3.1 OthersMarket Trends Analysis (2021-2032)
10.3.2 OthersMarket Size Estimates And Forecasts To 2032 (USD Billion)
11. Automotive Ambient Lighting Market, By End-User
11.1 Chapter Overview
11.2 Veterinary Clinics
11.2.1 Veterinary Clinics Market Trends Analysis (2021-2032)
11.2.2 Veterinary Clinics Market Size Estimates And Forecasts To 2032 (USD Billion)
11.3 Pet Rehabilitation Centers
11.3.1 Pet Rehabilitation Centers Market Trends Analysis (2021-2032)
11.3.2 Pet Rehabilitation Centers Market Size Estimates And Forecasts To 2032 (USD Billion)
11.4 Pet Owners
11.4.1 Pet Owners Market Trends Analysis (2021-2032)
11.4.2 Pet Owners Market Size Estimates And Forecasts To 2032 (USD Billion)
12. Regional Analysis
12.1 Chapter Overview
12.2 North America
12.2.1 Trends Analysis
12.2.2 North America Pet Wheelchair Market Estimates And Forecasts, By Country (2021-2032) (USD Billion)
12.2.3 North America Pet Wheelchair Market Estimates And Forecasts, By Pet (2021-2032) (USD Billion)
12.2.4 North America Pet Wheelchair Market Estimates And Forecasts, By Product (2021-2032) (USD Billion)
12.2.5 North America Pet Wheelchair Market Estimates And Forecasts, By Material (2021-2032) (USD Billion)
12.2.6 North America Pet Wheelchair Market Estimates And Forecasts, By Distribution Channel (2021-2032) (USD Billion)
12.2.7 North America Pet Wheelchair Market Estimates And Forecasts, By End-User (2021-2032) (USD Billion)
12.2.8 USA
12.2.8.1 USA Pet Wheelchair Market Estimates And Forecasts, By Pet (2021-2032) (USD Billion)
12.2.8.2 USA Pet Wheelchair Market Estimates And Forecasts, By Product (2021-2032) (USD Billion)
12.2.8.3 USA Pet Wheelchair Market Estimates And Forecasts, By Material (2021-2032) (USD Billion)
12.2.8.4 USA Pet Wheelchair Market Estimates And Forecasts, By Distribution Channel (2021-2032) (USD Billion)
12.2.8.5 USA Pet Wheelchair Market Estimates And Forecasts, By End-User (2021-2032) (USD Billion)
12.2.9 Canada
12.2.9.1 Canada Pet Wheelchair Market Estimates And Forecasts, By Pet (2021-2032) (USD Billion)
12.2.9.2 Canada Pet Wheelchair Market Estimates And Forecasts, By Product (2021-2032) (USD Billion)
12.2.9.3 Canada Pet Wheelchair Market Estimates And Forecasts, By Material (2021-2032) (USD Billion)
12.2.9.4 Canada Pet Wheelchair Market Estimates And Forecasts, By Distribution Channel (2021-2032) (USD Billion)
12.2.9.5 Canada Pet Wheelchair Market Estimates And Forecasts, By End-User (2021-2032) (USD Billion)
12.2.10 Mexico
12.2.10.1 Mexico Pet Wheelchair Market Estimates And Forecasts, By Pet (2021-2032) (USD Billion)
12.2.10.2 Mexico Pet Wheelchair Market Estimates And Forecasts, By Product (2021-2032) (USD Billion)
12.2.10.3 Mexico Pet Wheelchair Market Estimates And Forecasts, By Material (2021-2032) (USD Billion)
12.2.10.4 Mexico Pet Wheelchair Market Estimates And Forecasts, By Distribution Channel (2021-2032) (USD Billion)
12.2.10.5 Mexico Pet Wheelchair Market Estimates And Forecasts, By End-User (2021-2032) (USD Billion)
12.3 Europe
12.3.1 Trends Analysis
12.3.2 Europe Pet Wheelchair Market Estimates And Forecasts, By Country (2021-2032) (USD Billion)
12.3.3 Europe Pet Wheelchair Market Estimates And Forecasts, By Pet (2021-2032) (USD Billion)
12.3.4 Europe Pet Wheelchair Market Estimates And Forecasts, By Product (2021-2032) (USD Billion)
12.3.5 Europe Pet Wheelchair Market Estimates And Forecasts, By Material (2021-2032) (USD Billion)
12.3.6 Europe Pet Wheelchair Market Estimates And Forecasts, By Distribution Channel (2021-2032) (USD Billion)
12.3.7 Europe Pet Wheelchair Market Estimates And Forecasts, By End-User (2021-2032) (USD Billion)
12.3.8 Poland
12.3.8.1 Poland Pet Wheelchair Market Estimates And Forecasts, By Pet (2021-2032) (USD Billion)
12.3.8.2 Poland Pet Wheelchair Market Estimates And Forecasts, By Product (2021-2032) (USD Billion)
12.3.8.3 Poland Pet Wheelchair Market Estimates And Forecasts, By Material (2021-2032) (USD Billion)
12.3.8.4 Poland Pet Wheelchair Market Estimates And Forecasts, By Distribution Channel (2021-2032) (USD Billion)
12.3.8.5 Poland Pet Wheelchair Market Estimates And Forecasts, By End-User (2021-2032) (USD Billion)
12.3.9 Turkey
12.3.9.1 Turkey Pet Wheelchair Market Estimates And Forecasts, By Pet (2021-2032) (USD Billion)
12.3.9.2 Turkey Pet Wheelchair Market Estimates And Forecasts, By Product (2021-2032) (USD Billion)
12.3.9.3 Turkey Pet Wheelchair Market Estimates And Forecasts, By Material (2021-2032) (USD Billion)
12.3.9.4 Turkey Pet Wheelchair Market Estimates And Forecasts, By Distribution Channel (2021-2032) (USD Billion)
12.3.9.5 Turkey Pet Wheelchair Market Estimates And Forecasts, By End-User (2021-2032) (USD Billion)
12.3.10 Germany
12.3.10.1 Germany Pet Wheelchair Market Estimates And Forecasts, By Pet (2021-2032) (USD Billion)
12.3.10.2 Germany Pet Wheelchair Market Estimates And Forecasts, By Product (2021-2032) (USD Billion)
12.3.10.3 Germany Pet Wheelchair Market Estimates And Forecasts, By Material (2021-2032) (USD Billion)
12.3.10.4 Germany Pet Wheelchair Market Estimates And Forecasts, By Distribution Channel (2021-2032) (USD Billion)
12.3.10.5 Germany Pet Wheelchair Market Estimates And Forecasts, By End-User (2021-2032) (USD Billion)
12.3.11 France
12.3.11.1 France Pet Wheelchair Market Estimates And Forecasts, By Pet (2021-2032) (USD Billion)
12.3.11.2 France Pet Wheelchair Market Estimates And Forecasts, By Product (2021-2032) (USD Billion)
12.3.11.3 France Pet Wheelchair Market Estimates And Forecasts, By Material (2021-2032) (USD Billion)
12.3.11.4 France Pet Wheelchair Market Estimates And Forecasts, By Distribution Channel (2021-2032) (USD Billion)
12.3.11.5 France Pet Wheelchair Market Estimates And Forecasts, By End-User (2021-2032) (USD Billion)
12.3.12 UK
12.3.12.1 UK Pet Wheelchair Market Estimates And Forecasts, By Pet (2021-2032) (USD Billion)
12.3.12.2 UK Pet Wheelchair Market Estimates And Forecasts, By Product (2021-2032) (USD Billion)
12.3.12.3 UK Pet Wheelchair Market Estimates And Forecasts, By Material (2021-2032) (USD Billion)
12.3.12.4 UK Pet Wheelchair Market Estimates And Forecasts, By Distribution Channel (2021-2032) (USD Billion)
12.3.12.5 UK Pet Wheelchair Market Estimates And Forecasts, By End-User (2021-2032) (USD Billion)
12.3.13 Italy
12.3.13.1 Italy Pet Wheelchair Market Estimates And Forecasts, By Pet (2021-2032) (USD Billion)
12.3.13.2 Italy Pet Wheelchair Market Estimates And Forecasts, By Product (2021-2032) (USD Billion)
12.3.13.3 Italy Pet Wheelchair Market Estimates And Forecasts, By Material (2021-2032) (USD Billion)
12.3.13.4 Italy Pet Wheelchair Market Estimates And Forecasts, By Distribution Channel (2021-2032) (USD Billion)
12.3.13.5 Italy Pet Wheelchair Market Estimates And Forecasts, By End-User (2021-2032) (USD Billion)
12.3.14 Spain
12.3.14.1 Spain Pet Wheelchair Market Estimates And Forecasts, By Pet (2021-2032) (USD Billion)
12.3.14.2 Spain Pet Wheelchair Market Estimates And Forecasts, By Product (2021-2032) (USD Billion)
12.3.14.3 Spain Pet Wheelchair Market Estimates And Forecasts, By Material (2021-2032) (USD Billion)
12.3.14.4 Spain Pet Wheelchair Market Estimates And Forecasts, By Distribution Channel (2021-2032) (USD Billion)
12.3.14.5 Spain Pet Wheelchair Market Estimates And Forecasts, By End-User (2021-2032) (USD Billion)
12.3.15 Rest Of Europe
12.3.15.1 Rest Of Western Europe Pet Wheelchair Market Estimates And Forecasts, By Pet (2021-2032) (USD Billion)
12.3.15.2 Rest Of Western Europe Pet Wheelchair Market Estimates And Forecasts, By Product (2021-2032) (USD Billion)
12.3.15.3 Rest Of Western Europe Pet Wheelchair Market Estimates And Forecasts, By Material (2021-2032) (USD Billion)
12.3.15.4 Rest Of Western Europe Pet Wheelchair Market Estimates And Forecasts, By Distribution Channel (2021-2032) (USD Billion)
12.3.15.5 Rest Of Western Europe Pet Wheelchair Market Estimates And Forecasts, By End-User (2021-2032) (USD Billion)
12.4 Asia Pacific
12.4.1 Trends Analysis
12.4.2 Asia Pacific Pet Wheelchair Market Estimates And Forecasts, By Country (2021-2032) (USD Billion)
12.4.3 Asia Pacific Pet Wheelchair Market Estimates And Forecasts, By Pet (2021-2032) (USD Billion)
12.4.4 Asia Pacific Pet Wheelchair Market Estimates And Forecasts, By Product (2021-2032) (USD Billion)
12.4.5 Asia Pacific Pet Wheelchair Market Estimates And Forecasts, By Material (2021-2032) (USD Billion)
12.4.6 Asia Pacific Pet Wheelchair Market Estimates And Forecasts, By Distribution Channel (2021-2032) (USD Billion)
12.4.7 Asia Pacific Pet Wheelchair Market Estimates And Forecasts, By End-User (2021-2032) (USD Billion)
12.4.8 China
12.4.8.1 China Pet Wheelchair Market Estimates And Forecasts, By Pet (2021-2032) (USD Billion)
12.4.8.2 China Pet Wheelchair Market Estimates And Forecasts, By Product (2021-2032) (USD Billion)
12.4.8.3 China Pet Wheelchair Market Estimates And Forecasts, By Material (2021-2032) (USD Billion)
12.4.8.4 China Pet Wheelchair Market Estimates And Forecasts, By Distribution Channel (2021-2032) (USD Billion)
12.4.8.5 China Pet Wheelchair Market Estimates And Forecasts, By End-User (2021-2032) (USD Billion)
12.4.9 India
12.4.9.1 India Pet Wheelchair Market Estimates And Forecasts, By Pet (2021-2032) (USD Billion)
12.4.9.2 India Pet Wheelchair Market Estimates And Forecasts, By Product (2021-2032) (USD Billion)
12.4.9.3 India Pet Wheelchair Market Estimates And Forecasts, By Material (2021-2032) (USD Billion)
12.4.9.4 India Pet Wheelchair Market Estimates And Forecasts, By Distribution Channel (2021-2032) (USD Billion)
12.4.9.5 India Pet Wheelchair Market Estimates And Forecasts, By End-User (2021-2032) (USD Billion)
12.4.10 Japan
12.4.10.1 Japan Pet Wheelchair Market Estimates And Forecasts, By Pet (2021-2032) (USD Billion)
12.4.10.2 Japan Pet Wheelchair Market Estimates And Forecasts, By Product (2021-2032) (USD Billion)
12.4.10.3 Japan Pet Wheelchair Market Estimates And Forecasts, By Material (2021-2032) (USD Billion)
12.4.10.4 Japan Pet Wheelchair Market Estimates And Forecasts, By Distribution Channel (2021-2032) (USD Billion)
12.4.10.5 Japan Pet Wheelchair Market Estimates And Forecasts, By End-User (2021-2032) (USD Billion)
12.4.11 South Korea
12.4.11.1 South Korea Pet Wheelchair Market Estimates And Forecasts, By Pet (2021-2032) (USD Billion)
12.4.11.2 South Korea Pet Wheelchair Market Estimates And Forecasts, By Product (2021-2032) (USD Billion)
12.4.11.3 South Korea Pet Wheelchair Market Estimates And Forecasts, By Material (2021-2032) (USD Billion)
12.4.11.4 South Korea Pet Wheelchair Market Estimates And Forecasts, By Distribution Channel (2021-2032) (USD Billion)
12.4.11.5 South Korea Pet Wheelchair Market Estimates And Forecasts, By End-User (2021-2032) (USD Billion)
12.4.12 Singapore
12.4.12.1 Singapore Pet Wheelchair Market Estimates And Forecasts, By Pet (2021-2032) (USD Billion)
12.4.12.2 Singapore Pet Wheelchair Market Estimates And Forecasts, By Product (2021-2032) (USD Billion)
12.4.12.3 Singapore Pet Wheelchair Market Estimates And Forecasts, By Material (2021-2032) (USD Billion)
12.4.12.4 Singapore Pet Wheelchair Market Estimates And Forecasts, By Distribution Channel (2021-2032) (USD Billion)
12.4.12.5 Singapore Pet Wheelchair Market Estimates And Forecasts, By End-User (2021-2032) (USD Billion)
12.4.13 Australia
12.4.13.1 Australia Pet Wheelchair Market Estimates And Forecasts, By Pet (2021-2032) (USD Billion)
12.4.13.2 Australia Pet Wheelchair Market Estimates And Forecasts, By Product (2021-2032) (USD Billion)
12.4.13.3 Australia Pet Wheelchair Market Estimates And Forecasts, By Material (2021-2032) (USD Billion)
12.4.13.4 Australia Pet Wheelchair Market Estimates And Forecasts, By Distribution Channel (2021-2032) (USD Billion)
12.4.13.5 Australia Pet Wheelchair Market Estimates And Forecasts, By End-User (2021-2032) (USD Billion)
12.4.14 Rest Of Asia Pacific
12.4.14.1 Rest Of Asia Pacific Pet Wheelchair Market Estimates And Forecasts, By Pet (2021-2032) (USD Billion)
12.4.14.2 Rest Of Asia Pacific Pet Wheelchair Market Estimates And Forecasts, By Product (2021-2032) (USD Billion)
12.4.14.3 Rest Of Asia Pacific Pet Wheelchair Market Estimates And Forecasts, By Material (2021-2032) (USD Billion)
12.4.14.4 Rest Of Asia Pacific Pet Wheelchair Market Estimates And Forecasts, By Distribution Channel (2021-2032) (USD Billion)
12.4.14.5 Rest Of Asia Pacific Pet Wheelchair Market Estimates And Forecasts, By End-User (2021-2032) (USD Billion)
12.5 Middle East And Africa
12.5.1 Trends Analysis
12.5.2 Middle East And Africa Pet Wheelchair Market Estimates And Forecasts, By Country (2021-2032) (USD Billion)
12.5.3 Middle East And Africa Pet Wheelchair Market Estimates And Forecasts, By Pet (2021-2032) (USD Billion)
12.5.4 Middle East And Africa Pet Wheelchair Market Estimates And Forecasts, By Product (2021-2032) (USD Billion)
12.5.5 Middle East And Africa Pet Wheelchair Market Estimates And Forecasts, By Material (2021-2032) (USD Billion)
12.5.6 Middle East And Africa Pet Wheelchair Market Estimates And Forecasts, By Distribution Channel (2021-2032) (USD Billion)
12.5.7 Middle East And Africa Pet Wheelchair Market Estimates And Forecasts, By End-User (2021-2032) (USD Billion)
12.5.8 UAE
12.5.8.1 UAE Pet Wheelchair Market Estimates And Forecasts, By Pet (2021-2032) (USD Billion)
12.5.8.2 UAE Pet Wheelchair Market Estimates And Forecasts, By Product (2021-2032) (USD Billion)
12.5.8.3 UAE Pet Wheelchair Market Estimates And Forecasts, By Material (2021-2032) (USD Billion)
12.5.8.4 UAE Pet Wheelchair Market Estimates And Forecasts, By Distribution Channel (2021-2032) (USD Billion)
12.5.8.5 UAE Pet Wheelchair Market Estimates And Forecasts, By End-User (2021-2032) (USD Billion)
12.5.9 Saudi Arabia
12.5.9.1 Saudi Arabia Pet Wheelchair Market Estimates And Forecasts, By Pet (2021-2032) (USD Billion)
12.5.9.2 Saudi Arabia Pet Wheelchair Market Estimates And Forecasts, By Product (2021-2032) (USD Billion)
12.5.9.3 Saudi Arabia Pet Wheelchair Market Estimates And Forecasts, By Material (2021-2032) (USD Billion)
12.5.9.4 Saudi Arabia Pet Wheelchair Market Estimates And Forecasts, By Distribution Channel (2021-2032) (USD Billion)
12.5.9.5 Saudi Arabia Pet Wheelchair Market Estimates And Forecasts, By End-User (2021-2032) (USD Billion)
12.5.10 Qatar
12.5.10.1 Qatar Pet Wheelchair Market Estimates And Forecasts, By Pet (2021-2032) (USD Billion)
12.5.10.2 Qatar Pet Wheelchair Market Estimates And Forecasts, By Product (2021-2032) (USD Billion)
12.5.10.3 Qatar Pet Wheelchair Market Estimates And Forecasts, By Material (2021-2032) (USD Billion)
12.5.10.4 Qatar Pet Wheelchair Market Estimates And Forecasts, By Distribution Channel (2021-2032) (USD Billion)
12.5.10.5 Qatar Pet Wheelchair Market Estimates And Forecasts, By End-User (2021-2032) (USD Billion)
12.5.11 South Africa
12.5.11.1 South Africa Pet Wheelchair Market Estimates And Forecasts, By Pet (2021-2032) (USD Billion)
12.5.11.2 South Africa Pet Wheelchair Market Estimates And Forecasts, By Product (2021-2032) (USD Billion)
12.5.11.3 South Africa Pet Wheelchair Market Estimates And Forecasts, By Material (2021-2032) (USD Billion)
12.5.11.4 South Africa Pet Wheelchair Market Estimates And Forecasts, By Distribution Channel (2021-2032) (USD Billion)
12.5.11.5 South Africa Pet Wheelchair Market Estimates And Forecasts, By End-User (2021-2032) (USD Billion)
12.5.12 Rest Of Africa
12.5.12.1 Rest Of Africa Pet Wheelchair Market Estimates And Forecasts, By Pet (2021-2032) (USD Billion)
12.5.12.2 Rest Of Africa Pet Wheelchair Market Estimates And Forecasts, By Product (2021-2032) (USD Billion)
12.5.12.3 Rest Of Africa Pet Wheelchair Market Estimates And Forecasts, By Material (2021-2032) (USD Billion)
12.5.12.4 Rest Of Africa Pet Wheelchair Market Estimates And Forecasts, By Distribution Channel (2021-2032) (USD Billion)
12.5.12.5 Rest Of Africa Pet Wheelchair Market Estimates And Forecasts, By End-User (2021-2032) (USD Billion)
12.6 Latin America
12.6.1 Trends Analysis
12.6.2 Latin America Pet Wheelchair Market Estimates And Forecasts, By Country (2021-2032) (USD Billion)
12.6.3 Latin America Pet Wheelchair Market Estimates And Forecasts, By Pet (2021-2032) (USD Billion)
12.6.4 Latin America Pet Wheelchair Market Estimates And Forecasts, By Product (2021-2032) (USD Billion)
12.6.5 Latin America Pet Wheelchair Market Estimates And Forecasts, By Material (2021-2032) (USD Billion)
12.6.6 Latin America Pet Wheelchair Market Estimates And Forecasts, By Distribution Channel (2021-2032) (USD Billion)
12.6.7 Latin America Pet Wheelchair Market Estimates And Forecasts, By End-User (2021-2032) (USD Billion)
12.6.8 Brazil
12.6.8.1 Brazil Pet Wheelchair Market Estimates And Forecasts, By Pet (2021-2032) (USD Billion)
12.6.8.2 Brazil Pet Wheelchair Market Estimates And Forecasts, By Product (2021-2032) (USD Billion)
12.6.8.3 Brazil Pet Wheelchair Market Estimates And Forecasts, By Material (2021-2032) (USD Billion)
12.6.8.4 Brazil Pet Wheelchair Market Estimates And Forecasts, By Distribution Channel (2021-2032) (USD Billion)
12.6.8.5 Brazil Pet Wheelchair Market Estimates And Forecasts, By End-User (2021-2032) (USD Billion)
12.6.9 Argentina
12.6.9.1 Argentina Pet Wheelchair Market Estimates And Forecasts, By Pet (2021-2032) (USD Billion)
12.6.9.2 Argentina Pet Wheelchair Market Estimates And Forecasts, By Product (2021-2032) (USD Billion)
12.6.9.3 Argentina Pet Wheelchair Market Estimates And Forecasts, By Material (2021-2032) (USD Billion)
12.6.9.4 Argentina Pet Wheelchair Market Estimates And Forecasts, By Distribution Channel (2021-2032) (USD Billion)
12.6.9.5 Argentina Pet Wheelchair Market Estimates And Forecasts, By End-User (2021-2032) (USD Billion)
12.6.10 Rest Of Latin America
12.6.10.1 Rest Of Latin America Pet Wheelchair Market Estimates And Forecasts, By Pet (2021-2032) (USD Billion)
12.6.10.2 Rest Of Latin America Pet Wheelchair Market Estimates And Forecasts, By Product (2021-2032) (USD Billion)
12.6.10.3 Rest Of Latin America Pet Wheelchair Market Estimates And Forecasts, By Material (2021-2032) (USD Billion)
12.6.10.4 Rest Of Latin America Pet Wheelchair Market Estimates And Forecasts, By Distribution Channel (2021-2032) (USD Billion)
12.6.10.5 Rest Of Latin America Pet Wheelchair Market Estimates And Forecasts, By End-User (2021-2032) (USD Billion)
13. Company Profiles
13.1 Walkin' Pets
13.1.1 Company Overview
13.1.2 Financial
13.1.3 Products/ Services Offered
13.1.4 SWOT Analysis
13.2 K9 Carts
13.2.1 Company Overview
13.2.2 Financial
13.2.3 Products/ Services Offered
13.2.4 SWOT Analysis
13.3 Eddie's Wheels
13.3.1 Company Overview
13.3.2 Financial
13.3.3 Products/ Services Offered
13.3.4 SWOT Analysis
13.4 Best Friend Mobility
13.4.1 Company Overview
13.4.2 Financial
13.4.3 Products/ Services Offered
13.4.4 SWOT Analysis
13.5 Doggon' Wheels
13.5.1 Company Overview
13.5.2 Financial
13.5.3 Products/ Services Offered
13.5.4 SWOT Analysis
13.6 Walkabout Harnesses
13.6.1 Company Overview
13.6.2 Financial
13.6.3 Products/ Services Offered
13.6.4 SWOT Analysis
13.7 Hongkong Wheelchairs for Dogs Co., Ltd.
13.7.1 Company Overview
13.7.2 Financial
13.7.3 Products/ Services Offered
13.7.4 SWOT Analysis
13.8 NOVA Pet Wheelchairs
13.8.1 Company Overview
13.8.2 Financial
13.8.3 Products/ Services Offered
13.8.4 SWOT Analysis
13.9 PetMobile
13.9.1 Company Overview
13.9.2 Financial
13.9.3 Products/ Services Offered
13.9.4 SWOT Analysis
13.10 GingerLead
13.10.1 Company Overview
13.10.2 Financial
13.10.3 Products/ Services Offered
13.10.4 SWOT Analysis
14. Use Cases and Best Practices
15. Conclusion
Key Segments:
By Pet
-
Dogs
-
Cats
-
Others
By Product
-
Adjustable Wheelchairs
-
Non-Adjustable Wheelchairs
By Material
-
Aluminum
-
Others
By Distribution Channel
-
E-Commerce
-
Others
By End User
- Veterinary Clinics
- Pet Rehabilitation Centers
- Pet Owners
Request for Segment Customization as per your Business Requirement: https://www.snsinsider.com/sample-request/7513
Regional Coverage:
North America
-
US
-
Canada
-
Mexico
Europe
-
Germany
-
France
-
UK
-
Italy
-
Spain
-
Poland
-
Turkey
-
Rest of Europe
Asia Pacific
-
China
-
India
-
Japan
-
South Korea
-
Singapore
-
Australia
-
Rest of Asia Pacific
Middle East & Africa
-
UAE
-
Saudi Arabia
-
Qatar
-
South Africa
-
Rest of Middle East & Africa
Latin America
-
Brazil
-
Argentina
-
Rest of Latin America
Request for Country Level Research Report: Country Level Customization Request
Available Customization
With the given market data, SNS Insider offers customization as per the company’s specific needs. The following customization options are available for the report:
-
Detailed Volume Analysis
-
Criss-Cross segment analysis (e.g. Product X Application)
-
Competitive Product Benchmarking
-
Geographic Analysis
-
Additional countries in any of the regions
-
Customized Data Representation
-
Detailed analysis and profiling of additional market players
An accurate research report requires proper strategizing as well as implementation. There are multiple factors involved in the completion of good and accurate research report and selecting the best methodology to compete the research is the toughest part. Since the research reports we provide play a crucial role in any company’s decision-making process, therefore we at SNS Insider always believe that we should choose the best method which gives us results closer to reality. This allows us to reach at a stage wherein we can provide our clients best and accurate investment to output ratio.
Each report that we prepare takes a timeframe of 350-400 business hours for production. Starting from the selection of titles through a couple of in-depth brain storming session to the final QC process before uploading our titles on our website we dedicate around 350 working hours. The titles are selected based on their current market cap and the foreseen CAGR and growth.
The 5 steps process:
Step 1: Secondary Research:
Secondary Research or Desk Research is as the name suggests is a research process wherein, we collect data through the readily available information. In this process we use various paid and unpaid databases which our team has access to and gather data through the same. This includes examining of listed companies’ annual reports, Journals, SEC filling etc. Apart from this our team has access to various associations across the globe across different industries. Lastly, we have exchange relationships with various university as well as individual libraries.

Step 2: Primary Research
When we talk about primary research, it is a type of study in which the researchers collect relevant data samples directly, rather than relying on previously collected data. This type of research is focused on gaining content specific facts that can be sued to solve specific problems. Since the collected data is fresh and first hand therefore it makes the study more accurate and genuine.
We at SNS Insider have divided Primary Research into 2 parts.
Part 1 wherein we interview the KOLs of major players as well as the upcoming ones across various geographic regions. This allows us to have their view over the market scenario and acts as an important tool to come closer to the accurate market numbers. As many as 45 paid and unpaid primary interviews are taken from both the demand and supply side of the industry to make sure we land at an accurate judgement and analysis of the market.
This step involves the triangulation of data wherein our team analyses the interview transcripts, online survey responses and observation of on filed participants. The below mentioned chart should give a better understanding of the part 1 of the primary interview.

Part 2: In this part of primary research the data collected via secondary research and the part 1 of the primary research is validated with the interviews from individual consultants and subject matter experts.
Consultants are those set of people who have at least 12 years of experience and expertise within the industry whereas Subject Matter Experts are those with at least 15 years of experience behind their back within the same space. The data with the help of two main processes i.e., FGDs (Focused Group Discussions) and IDs (Individual Discussions). This gives us a 3rd party nonbiased primary view of the market scenario making it a more dependable one while collation of the data pointers.
Step 3: Data Bank Validation
Once all the information is collected via primary and secondary sources, we run that information for data validation. At our intelligence centre our research heads track a lot of information related to the market which includes the quarterly reports, the daily stock prices, and other relevant information. Our data bank server gets updated every fortnight and that is how the information which we collected using our primary and secondary information is revalidated in real time.

Step 4: QA/QC Process
After all the data collection and validation our team does a final level of quality check and quality assurance to get rid of any unwanted or undesired mistakes. This might include but not limited to getting rid of the any typos, duplication of numbers or missing of any important information. The people involved in this process include technical content writers, research heads and graphics people. Once this process is completed the title gets uploader on our platform for our clients to read it.
Step 5: Final QC/QA Process:
This is the last process and comes when the client has ordered the study. In this process a final QA/QC is done before the study is emailed to the client. Since we believe in giving our clients a good experience of our research studies, therefore, to make sure that we do not lack at our end in any way humanly possible we do a final round of quality check and then dispatch the study to the client.