Photoacoustic Tomography Market Report Scope & Overview:
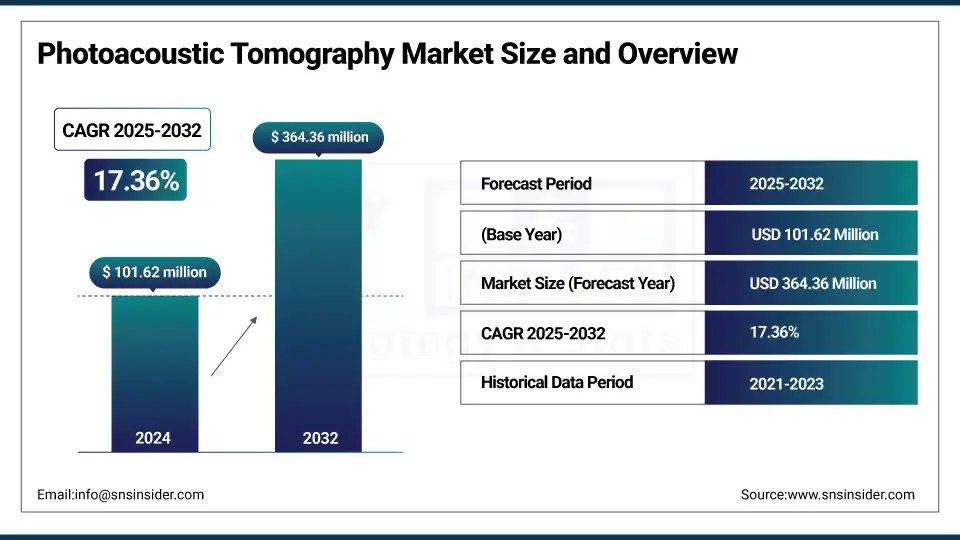
The photoacoustic tomography market size was valued at USD 101.62 million in 2024 and is expected to reach USD 364.36 million by 2032, growing at a CAGR of 17.36% over the forecast period of 2025-2032.

The global photoacoustic tomography market is growing rapidly as it is a non-invasive, optical imaging technology. It provides benefits for early disease diagnosis, especially in oncology, cardiology, and neurology. Market drivers include increasing demand for diagnostics, advancements in technology, and rising healthcare expenditure. Market growth is also driven by rising research applications and the growing funding for biomedical imaging. This trend towards precision medicine will also continue to drive global adoption of photoacoustic tomography systems.

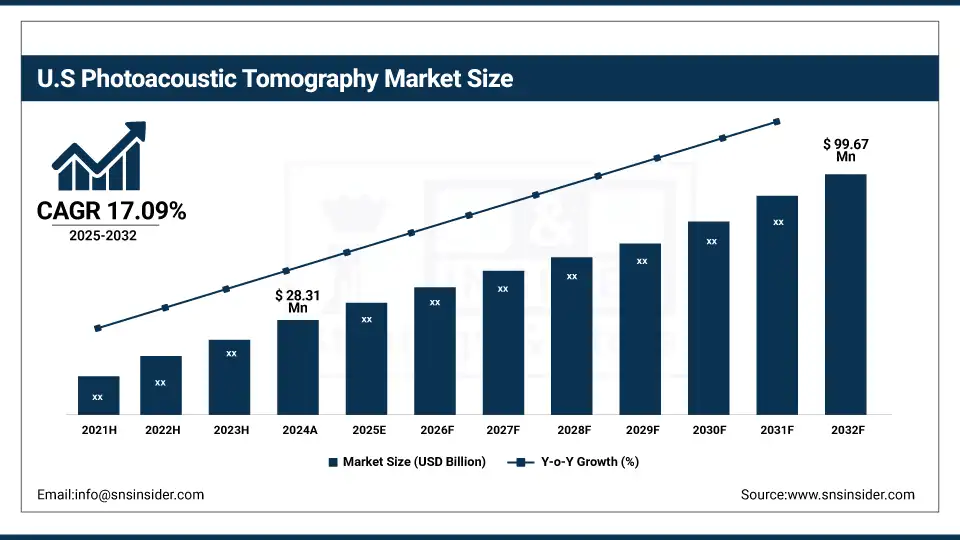
The U.S. photoacoustic tomography market size was valued at USD 28.31 million in 2024 and is expected to reach USD 99.67 million by 2032, growing at a CAGR of 17.09% over the forecast period of 2025-2032.

The U.S. is the largest market owing to a well-established healthcare infrastructure, huge R&D expenditure, and early adoption of advanced imaging technologies. In addition to this, it further ensures its leading position due to key industry players present in the region alongside government-funded biomedical research.

Market Dynamics:

Drivers

  • Demand for Cancer and Cardiovascular Diseases is Fuelling the Market Growth

The increasing incidence of cancer and cardiovascular disease across the globe plays an important role in fueling the growth of advanced diagnostic imaging technologies, including photoacoustic tomography. PAT is a novel, high-resolution, non-invasive imaging method for tumors and vascular malformations, which is most useful for early cancer detection and assessment of disease progression. The growing interest in early diagnosis and precision medicine by healthcare providers demands imaging systems that can acquire both functional and structural information, making PAT a competitive candidate for oncological and cardiovascular diagnostics.

In 2025, a review published on nanophotonic-enhanced PAT outlined numerous applications in high-resolution imaging, including the detection of brain tumors that can penetrate deeper into the tissues of the brain. All these applications utilize nanomaterials or advanced optics to help in imaging deeper into brain tissues.

  • Increasing Demand for Non-Ionizing & Non-Infusion Imaging Modalities is Driving the Market Growth

Conventional imaging methods, such as X-ray or CT scans, use ionizing radiation, which is associated with long-term negative health effects, especially given repetitive procedures. Instead, PAT relies on laser pulses to gently excite the tissues — with the added benefit of using non-ionizing sources for the laser pulses themselves — and ultrasound detection, which is much safer for both patients and operators alike. It is also non-invasive, requiring no risk techniques involving contrast or biopsies for most situations. The increasing inclination towards safer and non-invasive diagnostic techniques is accelerating the adoption of photoacoustic tomography for clinical or research applications.

The clinical application of CT and PET scans is limited due to their radiation exposure, and photoacoustic imaging provides non-invasive, non-ionizing imaging of structural, functional, and molecular characteristics of tissue.

In 2025, Nature Biomedical Engineering reported on a high-speed all-optical Fabry–Perot PAT scanner that provided volumetric microvascular imaging within seconds, with a diagnostic range of up to 15mm depth within a near-real-time timeframe.                           

Restraint

  • Non-uniformity and Regulatory Clearances are Constraining the Market Growth

A major restraint hampering the expansion of the photoacoustic tomography (PAT) market is the absence of standardization and associated regulatory approvals. PAT is a novel imaging modality, and there are no established clinical protocols or operational standards for PAT, making approval at the FDA and CE a challenging roadblock. This indeed hinders the commercialization of these new devices and minimizes their use in clinical practice. Moreover, the lack of long-term clinical validation influences reimbursement decisions from payers, resulting in the reluctance of healthcare practitioners to adopt the technology. These barriers related to regulation and standardization together hinder the market ramp-up and broader clinical implementation.

Segmentation Analysis:

By Type

Photoacoustic microscopy dominated the photoacoustic tomography market share in 2024, with a 39.56%, as high-resolution imaging is critical for early-stage disease diagnostics and preclinical research. Due to its capacity to deliver accurate anatomical and functional information at the cellular and molecular scale, it has been the method of choice at universities, research facilities, and clinical practice. Additionally, the mounting implementation of photoacoustic microscopy in oncology, dermatology, and neurology has primarily accelerated the market share.

During the forecast period, the intravascular photoacoustic tomography segment is expected to see the fastest growth, as a result of the increasing global prevalence of cardiovascular diseases. Its noninvasive approach allows clinicians to perform high-resolution imaging of blood vessels and plaque composition in real-time, which will enhance diagnosis and treatment planning. Moreover, continuous technological development and miniaturization of devices are increasing the availability of intravascular systems as a practical clinical option, driving the market rapidly.

By Application

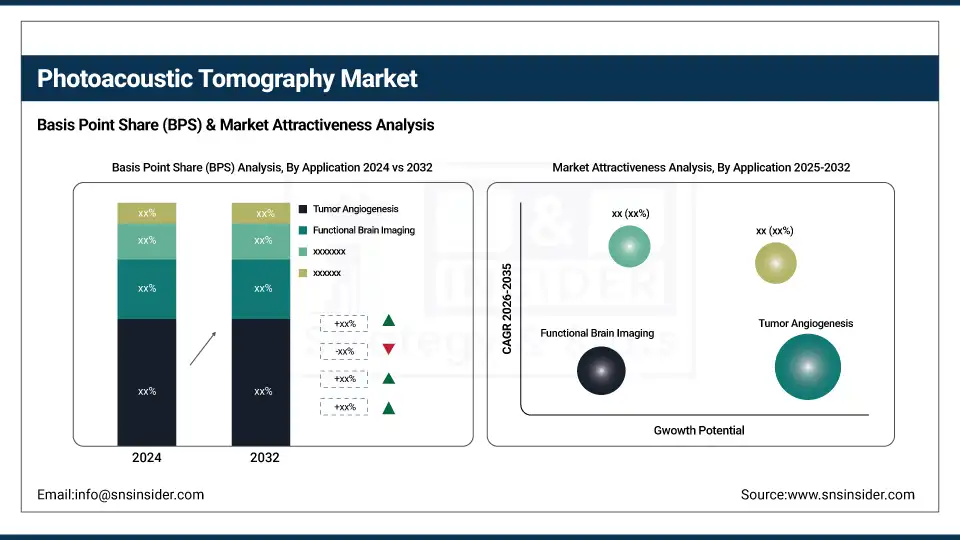
In 2024, the photoacoustic tomography market dominated by the tumor angiogenesis segment with a 31.25% market share due to technology with superior ability for spatial and molecular resolution of tumor-associated blood vessel growth over other techniques. It needs this application for the early diagnosis of cancer, the monitoring of its treatment, and the assessment of the effectiveness of anti-angiogenic therapy. Introduction Cancer continues to be among the leading causes of morbidity and mortality globally. There has been increased interest in the development of clinically translatable non-invasive imaging methods that probe parameters relating to both function and structure.

Based on function, the functional brain imaging segment is anticipated to grow at the fastest rate over the forecast period, owing to the increasing emphasis on neurological disorders, including Alzheimer's disease, Parkinson's disease, and epilepsy. Although various modalities have been used to probe brain hemodynamics and oxygenation in vivo, photoacoustic tomography (PAT) can provide real-time, non-ionizing, and high-resolution imaging, which serves as a more informative and safer imaging approach. Several ongoing research initiatives and increasing funding levels for brain health and cognate neuroscience are driving the uptake of this technology for brain imaging-related applications.

By Imaging Type

The pre-clinical research laboratories segment dominated the photoacoustic tomography market in 2024 due as photoacoustic tomography is increasingly being utilized in pre-clinical settings, as it allows non-invasive visualization and probing of physiological and molecular changes in small animal models. Photoacoustic tomography is popular in this segment as it is receiving significant funding from academic and pharmaceutical research institutions, where the need for the study of cancer, cardiovascular diseases, drug efficacy, and the mechanism of action is high.

The fastest growth is predicted for the clinical (hospital and diagnostic use) segment, as the interest in translating photoacoustic imaging into practical diagnostics is witnessing a significant increase. Clinical photoacoustic tomography has high penetration opportunities for early diagnosis of cancer, vascular imaging, and functional brain imaging. These techniques are real-time, high-resolution, and non-ionizing, and compete against traditional imaging technologies. The growing efforts for translation are increasing regulatory awareness, leading to increased adoption of photoacoustic tomography in hospitals and diagnostic centers. The high demand for non-ionizing and accurate diagnostic technology is expected to lead this segment to a significantly high growth rate.

By End Use

The hospitals segment holds the largest share of the photoacoustic tomography market in 2024 due to the better infrastructure of hospitals and the wider access to capital equipment, along with the growing adoption of hybrid imaging technologies in the hospital sector for cancer diagnosis, cardiovascular applications, and neurological conditions. Patients need a comprehensive diagnostic evaluation, and hospitals are often the first point of contact, and they are also the place where clinical research with photoacoustic systems. The increasing adoption of multimodal imaging to improve accuracy in diagnosis and treatment is further fueling investments by hospitals in photoacoustic tomography systems.

The diagnostic imaging centers segment is expected to register the highest growth rate during the forecast years, driven by the rising need for specialization-based imaging services outside conventional hospital setups & equipment. While the demand is high, many new trends are emerging to build diagnostic imaging centers, and one of them is the inclusion of various advanced imaging parameters such as photoacoustic tomography, which is being used increasingly for early detection of cancer, evaluation of vascular disease, and functional imaging due to its low operational cost and ease of use.

Regional Analysis:

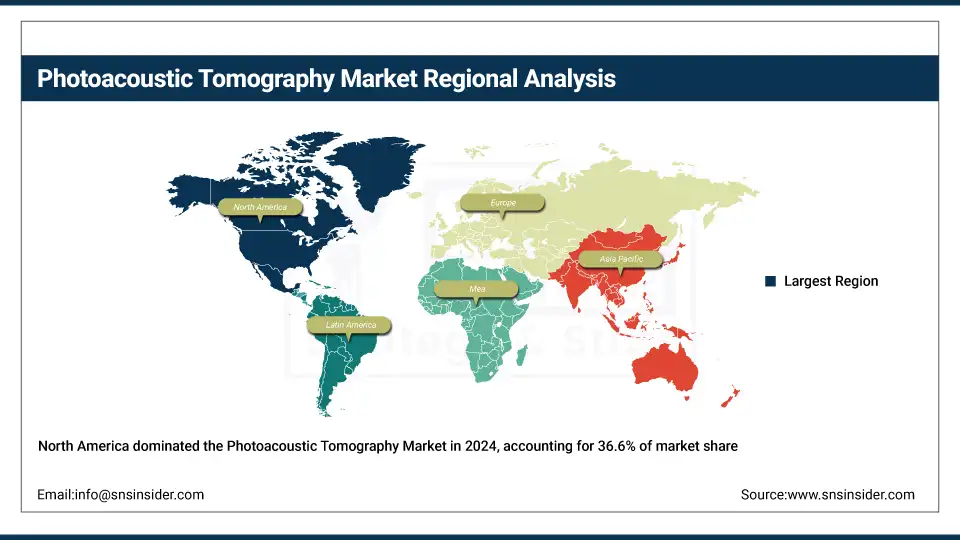
North America dominated the photoacoustic tomography market with a 36.6% market share in 2024, owing to its advanced healthcare infrastructure, high adoption of advanced medical imaging technologies, and the presence of dominant players in the market. Significant government and private investments are being made in R&D, particularly in the areas of molecular biology, imaging, and oncology diagnostics in the region. Furthermore, a supportive regulatory environment and early facilitators and demand for such solutions with accurate diagnosis are anticipated to provide broad adoption of these photoacoustic tomography systems across hospitals and research institutions in the U.S. and Canada.

The photoacoustic tomography market trend in Asia Pacific is poised to be the fastest-growing region due to increasing healthcare expenditure, awareness, space-enhancing due to early disease detection technologies, patient population, etc. States such as China, India, or Japan invest at lightning speed in state-of-the-art healthcare infrastructure and research capabilities. The rising efforts undertaken by governments in the region to promote local manufacturing of medical devices and increasing collaborations between global players and regional research institutes are further benefiting the market by speeding the adoption of innovative imaging technologies such as photoacoustic tomography across the region.

The photoacoustic tomography market analysis in Europe is poised for significant growth, propelled by a surge in demand for non-invasive diagnostic imaging, greater research funding, and a concentration of leading academic and clinical research entities. With better health infrastructure and government initiatives to promote precision diagnostics, Germany, the U.K., and France are among the early adopters of advanced imaging technologies. Moreover, the European university and med-tech companies play an important role in driving innovation through partnerships, which further facilitates the growth of the market in this region.

The photoacoustic tomography market in Latin America and the Middle East is estimated to grow at a moderate rate during the forecast period. Countries such as Brazil and Mexico in Latin America are slowly but steadily getting into advanced medical imaging technologies, aided by growing infrastructure and increasing recognition for early disease detection. These advances do have some limitations, but are still hindered due to limited healthcare funding and accessibility.

The photoacoustic tomography market growth in the MEA region is supported by rising investment to modernize healthcare, especially in the Gulf countries. Although the photoacoustic tomography market is still exhibiting nascent and adoptive stages, a growing number of chronic diseases festers together with an urgent requirement for superior diagnostic tools are likely to drive the steady development of the market over the forecast years.

Key Players:

The photoacoustic tomography market companies are Endra Life Sciences, FUJIFILM VisualSonics, iThera Medical, Kibero GmbH, Seno Medical Instruments, Verasonics, Canon Medical Systems Corporation, Bruker, Tomowave Labs, Vibronix Inc., Aspect Imaging, PerkinElmer Inc., Spectral Instruments Imaging, InnoLas Laser GmbH, Advantest Corporation, PreXion Corporation, EchoSens, Luxonus Inc., Siemens Healthineers, and United Imaging Healthcare.

Recent Developments:

  • June 2025 – FUJIFILM VisualSonics Inc., a global leader in ultra-high-frequency ultrasound and photoacoustic imaging systems, introduced the Vevo F2 LAZR-X20 Photoacoustic Imaging Platform. This multi-modal platform includes high-powered, smart laser technology, providing advanced tissue characterization with outstanding anatomical accuracy, specifically intended for the preclinical animal model.

  • June 2025 – Verasonics released its new Acquisition SDK Programming Model, a C-based API written for the Vantage NXT Research Ultrasound System users. This SDK allows system programming without MATLAB dependencies. It consists of a C-API, full documentation, and sample code. The model also takes over data structures and naming conventions close to MATLAB's, making it convenient to port existing sequences to the new setting.

  • July 2023 – Seno Medical's Imagio Breast Imaging System, which combines photoacoustic imaging, was added to the DICOM Standard (Supplement 229, version 2023c). The DICOM Standard is managed by the Medical Imaging & Technology Alliance (MITA), a subsidiary of the National Electrical Manufacturers Association (NEMA), representing a major milestone for the clinical adoption and standardization of photoacoustic imaging technology.

    Photoacoustic Tomography Market Report Scope:

    Report Attributes Details
    Market Size in 2024 USD 101.62 million 
    Market Size by 2032 USD 364.36 million 
    CAGR CAGR of 60.20% From 2025 to 2032
    Base Year 2024
    Forecast Period 2025-2032
    Historical Data 2021-2023
    Report Scope & Coverage Market Size, Segments Analysis, Competitive Landscape, Regional Analysis, DROC & SWOT Analysis, Forecast Outlook
    Key Segments • By Type (Photoacoustic Microscopy, Photoacoustic Tomography (PAT), Intravascular Photoacoustic Tomography)
    • By Application (Functional Brain Imaging, Tumor Angiogenesis, Blood Oxygenation Mapping, Skin Melanoma Detection, Other Applications [e.g., Methemoglobin Measurement, Interventional Radiology])
    • By Imaging Type (Pre-clinical [Research Laboratories, Animal Models], Clinical [Hospital and Diagnostic Use])
    • By End Use (Hospitals, Diagnostic Imaging Centers, Academic & Research Institutes, Other End Users)
    Regional Analysis/Coverage North America (US, Canada, Mexico), Europe (Germany, France, UK, Italy, Spain, Poland, Turkey, Rest of Europe), Asia Pacific (China, India, Japan, South Korea, Singapore, Australia, Rest of Asia Pacific), Middle East & Africa (UAE, Saudi Arabia, Qatar, South Africa, Rest of Middle East & Africa), Latin America (Brazil, Argentina, Rest of Latin America)
    Company Profiles The photoacoustic tomography market companies are Endra Life Sciences, FUJIFILM VisualSonics, iThera Medical, Kibero GmbH, Seno Medical Instruments, Verasonics, Canon Medical Systems Corporation, Bruker, Tomowave Labs, Vibronix Inc., Aspect Imaging, PerkinElmer Inc., Spectral Instruments Imaging, InnoLas Laser GmbH, Advantest Corporation, PreXion Corporation, EchoSens, Luxonus Inc., Siemens Healthineers, and United Imaging Healthcare.

Table Of Contents

1. Introduction

1.1 Market Definition & Scope

 1.2 Research Assumptions & Abbreviations

 1.3 Research Methodology

2. Executive Summary

2.1 Market Snapshot

 2.2 Market Absolute $ Opportunity Assessment & Y-o-Y Analysis, 2021–2032

 2.3 Market Size & Forecast, By Segmentation, 2021–2032

  2.3.1 Market Size By Type

  2.3.2 Market Size By Application

         2.3.2 Market Size By Imaging Type

         2.3.2 Market Size By End Use

 2.4 Market Share & BPS Analysis By Region, 2024

 2.5 Industry Growth Scenarios – Conservative, Likely & Optimistic

 2.6 Industry CxO’s Perspective

3. Market Overview

3.1 Market Dynamics

  3.1.1 Drivers

  3.1.2 Restraints

  3.1.3 Opportunities

  3.1.4 Key Market Trends

 3.2 Industry PESTLE Analysis

 3.3 Key Industry Forces (Porter’s) Impacting Market Growth

 3.4 Industry Supply Chain Analysis

  3.4.1 Raw Material Suppliers

  3.4.2 Manufacturers

  3.4.3 Distributors/Suppliers

  3.4.4 Customers/End-Users

 3.5 Industry Life Cycle Assessment

 3.6 Parent Market Overview

 3.7 Market Risk Assessment

4. Statistical Insights & Trends Reporting

4. Statistical Insights and Trends Reporting

4.1 Incidence and Prevalence Trends (2024)
 4.1.1 Global incidence of conditions requiring photoacoustic imaging
 4.1.2 Regional prevalence of target diseases (e.g., skin melanoma, tumors, vascular disorders)
 4.1.3 Year-on-year growth in imaging-diagnosable conditions (2019–2024)
 4.1.4 Population demographics influencing adoption of PAT

4.2 Diagnostic Procedure and Prescription Trends (2024)
 4.2.1 Growth in adoption of PAT in hospitals and diagnostic centers
 4.2.2 PAT-guided imaging vs. traditional imaging method usage rates
 4.2.3 Regional shift in usage patterns for functional brain imaging and tumor detection
 4.2.4 Clinical trial trends incorporating photoacoustic tomography

4.3 Device Volume Analysis, by Region (2020–2032)
4.4 Healthcare Spending Patterns, by Region (2024)
 4.4.1 Government healthcare expenditure on diagnostic imaging technologies
 4.4.2 Commercial insurance coverage trends for PAT-based procedures
 4.4.3 Private investment in imaging equipment and R&D
 4.4.4 Out-of-pocket expenditure trends among patients
  4.4.4.1 Diagnostic affordability and access disparity
  4.4.4.2 Impact on adoption rates in low-income regions

 5. Photoacoustic Tomography Market Segmental Analysis & Forecast, By Product, 2021 – 2032, Value (USD Billion)

5.1 Introduction

 5.2 Photoacoustic Microscopy

  5.2.1 Key Trends

  5.2.2 Market Size & Forecast, 2021 – 2032

 5.3 Photoacoustic Tomography (PAT)

  5.3.1 Key Trends

  5.3.2 Market Size & Forecast, 2021 – 2032

 5.4 Intravascular Photoacoustic Tomography

  5.4.1 Key Trends

  5.4.2 Market Size & Forecast, 2021 – 2032

6. Photoacoustic Tomography Market Segmental Analysis & Forecast, By Application, 2021 – 2032, Value (USD Billion)

    6.1 Introduction

 6.2 Functional Brain Imaging

  6.2.1 Key Trends

  6.2.2 Market Size & Forecast, 2021 – 2032

 6.3 Tumor Angiogenesis

  6.3.1 Key Trends

  6.3.2 Market Size & Forecast, 2021 – 2032

 6.4 Blood Oxygenation Mapping

  6.4.1 Key Trends

  6.4.2 Market Size & Forecast, 2021 – 2032

 6.5 Skin Melanoma Detection

  6.5.1 Key Trends

  6.5.2 Market Size & Forecast, 2021 – 2032

 6.6 Other Applications (e.g., methemoglobin measurement, interventional radiology)

  6.6.1 Key Trends

  6.6.2 Market Size & Forecast, 2021 – 2032

7. Photoacoustic Tomography Market Segmental Analysis & Forecast, By Imaging Type, 2021 – 2032, Value (USD Billion)

    7.1 Introduction

 7.2 Pre-clinical (research laboratories, animal models)

  7.2.1 Key Trends

  7.2.2 Market Size & Forecast, 2021 – 2032

 7.3 Clinical (hospital and diagnostic use)

  7.3.1 Key Trends

  7.3.2 Market Size & Forecast, 2021 – 2032

8. Photoacoustic Tomography Market Segmental Analysis & Forecast, By End Use, 2021 – 2032, Value (USD Billion)

    8.1 Introduction

 8.2 Hospitals

  8.2.1 Key Trends

  8.2.2 Market Size & Forecast, 2021 – 2032

 8.3 Diagnostic Imaging Centers

  8.3.1 Key Trends

  8.3.2 Market Size & Forecast, 2021 – 2032

 8.4 Academic & Research Institutes

  8.4.1 Key Trends

  8.4.2 Market Size & Forecast, 2021 – 2032

 8.5 Other End Users

  8.5.1 Key Trends

  8.5.2 Market Size & Forecast, 2021 – 2032

9. Photoacoustic Tomography Market Segmental Analysis & Forecast By Region, 2021 – 2025, Value (USD Billion)

9.1 Introduction

9.2 North America

 9.2.1 Key Trends

 9.2.2 Photoacoustic Tomography Market Size & Forecast, By Type, 2021 – 2032

 9.2.3 Photoacoustic Tomography Market Size & Forecast, By Application, 2021 – 2032

 9.2.4 Photoacoustic Tomography Market Size & Forecast, By Imaging Type, 2021 – 2032

 9.2.5 Photoacoustic Tomography Market Size & Forecast, By End Use, 2021 – 2032

 9.2.6 Photoacoustic Tomography Market Size & Forecast, By Country, 2021 – 2032

  9.2.6.1 USA

   9.2.6.1.1 Photoacoustic Tomography Market Size & Forecast, By Type, 2021 – 2032

   9.2.6.1.2 Photoacoustic Tomography Market Size & Forecast, By Application, 2021 – 2032

   9.2.6.1.3 Photoacoustic Tomography Market Size & Forecast, By Imaging Type, 2021 – 2032

   9.2.6.1.4 Photoacoustic Tomography Market Size & Forecast, By End Use, 2021 – 2032

  9.2.6.2 Canada

   9.2.6.2.1 Photoacoustic Tomography Market Size & Forecast, By Type, 2021 – 2032

   9.2.6.2.2 Photoacoustic Tomography Market Size & Forecast, By Application, 2021 – 2032

   9.2.6.2.3 Photoacoustic Tomography Market Size & Forecast, By Imaging Type, 2021 – 2032

   9.2.6.2.4 Photoacoustic Tomography Market Size & Forecast, By End Use, 2021 – 2032

9.3 Europe

 9.3.1 Key Trends

 9.3.2 Photoacoustic Tomography Market Size & Forecast, By Type, 2021 – 2032

 9.3.3 Photoacoustic Tomography Market Size & Forecast, By Application, 2021 – 2032

 9.3.4 Photoacoustic Tomography Market Size & Forecast, By Imaging Type, 2021 – 2032

 9.3.5 Photoacoustic Tomography Market Size & Forecast, By End Use, 2021 – 2032

 9.3.6 Photoacoustic Tomography Market Size & Forecast, By Country, 2021 – 2032

  9.3.6.1 Germany

   9.3.6.1.1 Photoacoustic Tomography Market Size & Forecast, By Type, 2021 – 2032

   9.3.6.1.2 Photoacoustic Tomography Market Size & Forecast, By Application, 2021 – 2032

   9.3.6.1.3 Photoacoustic Tomography Market Size & Forecast, By Imaging Type, 2021 – 2032

   9.3.6.1.4 Photoacoustic Tomography Market Size & Forecast, By End Use, 2021 – 2032

  9.3.6.2 UK

   9.3.6.2.1 Photoacoustic Tomography Market Size & Forecast, By Type, 2021 – 2032

   9.3.6.2.2 Photoacoustic Tomography Market Size & Forecast, By Application, 2021 – 2032

   9.3.6.2.3 Photoacoustic Tomography Market Size & Forecast, By Imaging Type, 2021 – 2032

   9.3.6.2.4 Photoacoustic Tomography Market Size & Forecast, By End Use, 2021 – 2032

  9.3.6.3 France

   9.3.6.3.1 Photoacoustic Tomography Market Size & Forecast, By Type, 2021 – 2032

   9.3.6.3.2 Photoacoustic Tomography Market Size & Forecast, By Application, 2021 – 2032

   9.3.6.3.3 Photoacoustic Tomography Market Size & Forecast, By Imaging Type, 2021 – 2032

   9.3.6.3.4 Photoacoustic Tomography Market Size & Forecast, By End Use, 2021 – 2032

  9.3.6.4 Italy

   9.3.6.4.1 Photoacoustic Tomography Market Size & Forecast, By Type, 2021 – 2032

   9.3.6.4.2 Photoacoustic Tomography Market Size & Forecast, By Application, 2021 – 2032

   9.3.6.4.3 Photoacoustic Tomography Market Size & Forecast, By Imaging Type, 2021 – 2032

   9.3.6.4.4 Photoacoustic Tomography Market Size & Forecast, By End Use, 2021 – 2032

  9.3.6.5 Spain

   9.3.6.5.1 Photoacoustic Tomography Market Size & Forecast, By Type, 2021 – 2032

   9.3.6.5.2 Photoacoustic Tomography Market Size & Forecast, By Application, 2021 – 2032

   9.3.6.5.3 Photoacoustic Tomography Market Size & Forecast, By Imaging Type, 2021 – 2032

   9.3.6.5.4 Photoacoustic Tomography Market Size & Forecast, By End Use, 2021 – 2032

  9.3.6.6 Russia

   9.3.6.6.1 Photoacoustic Tomography Market Size & Forecast, By Type, 2021 – 2032

   9.3.6.6.2 Photoacoustic Tomography Market Size & Forecast, By Application, 2021 – 2032

   9.3.6.6.3 Photoacoustic Tomography Market Size & Forecast, By Imaging Type, 2021 – 2032

   9.3.6.6.4 Photoacoustic Tomography Market Size & Forecast, By End Use, 2021 – 2032

  9.3.6.7 Poland

   9.3.6.7.1 Photoacoustic Tomography Market Size & Forecast, By Type, 2021 – 2032

   9.3.6.7.2 Photoacoustic Tomography Market Size & Forecast, By Application, 2021 – 2032

   9.3.6.7.3 Photoacoustic Tomography Market Size & Forecast, By Imaging Type, 2021 – 2032

   9.3.6.7.4 Photoacoustic Tomography Market Size & Forecast, By End Use, 2021 – 2032

  9.3.6.8 Rest of Europe

   9.3.6.8.1 Photoacoustic Tomography Market Size & Forecast, By Type, 2021 – 2032

   9.3.6.8.2 Photoacoustic Tomography Market Size & Forecast, By Application, 2021 – 2032

   9.3.6.8.3 Photoacoustic Tomography Market Size & Forecast, By Imaging Type, 2021 – 2032

   9.3.6.8.4 Photoacoustic Tomography Market Size & Forecast, By End Use, 2021 – 2032   

9.4 Asia-Pacific

 9.4.1 Key Trends

 9.4.2 Photoacoustic Tomography Market Size & Forecast, By Type, 2021 – 2032

 9.4.3 Photoacoustic Tomography Market Size & Forecast, By Application, 2021 – 2032

 9.4.4 Photoacoustic Tomography Market Size & Forecast, By Imaging Type, 2021 – 2032

 9.4.5 Photoacoustic Tomography Market Size & Forecast, By End Use, 2021 – 2032

 9.4.6 Photoacoustic Tomography Market Size & Forecast, By Country, 2021 – 2032

  9.4.6.1 China

   9.4.6.1.1 Photoacoustic Tomography Market Size & Forecast, By Type, 2021 – 2032

   9.4.6.1.2 Photoacoustic Tomography Market Size & Forecast, By Application, 2021 – 2032

   9.4.6.1.3 Photoacoustic Tomography Market Size & Forecast, By Imaging Type, 2021 – 2032

   9.4.6.1.4 Photoacoustic Tomography Market Size & Forecast, By End Use, 2021 – 2032

  9.4.6.2 India

   9.4.6.2.1 Photoacoustic Tomography Market Size & Forecast, By Type, 2021 – 2032

   9.4.6.2.2 Photoacoustic Tomography Market Size & Forecast, By Application, 2021 – 2032

   9.4.6.2.3 Photoacoustic Tomography Market Size & Forecast, By Imaging Type, 2021 – 2032

   9.4.6.2.4 Photoacoustic Tomography Market Size & Forecast, By End Use, 2021 – 2032

  9.4.6.3 Japan

   9.4.6.3.1 Photoacoustic Tomography Market Size & Forecast, By Type, 2021 – 2032

   9.4.6.3.2 Photoacoustic Tomography Market Size & Forecast, By Application, 2021 – 2032

   9.4.6.3.3 Photoacoustic Tomography Market Size & Forecast, By Imaging Type, 2021 – 2032

   9.4.6.3.4 Photoacoustic Tomography Market Size & Forecast, By End Use, 2021 – 2032

  9.4.6.4 South Korea

   9.4.6.4.1 Photoacoustic Tomography Market Size & Forecast, By Type, 2021 – 2032

   9.4.6.4.2 Photoacoustic Tomography Market Size & Forecast, By Application, 2021 – 2032

   9.4.6.4.3 Photoacoustic Tomography Market Size & Forecast, By Imaging Type, 2021 – 2032

   9.4.6.4.4 Photoacoustic Tomography Market Size & Forecast, By End Use, 2021 – 2032

  9.4.6.5 Australia

   9.4.6.5.1 Photoacoustic Tomography Market Size & Forecast, By Type, 2021 – 2032

   9.4.6.5.2 Photoacoustic Tomography Market Size & Forecast, By Application, 2021 – 2032

   9.4.6.5.3 Photoacoustic Tomography Market Size & Forecast, By Imaging Type, 2021 – 2032

   9.4.6.5.4 Photoacoustic Tomography Market Size & Forecast, By End Use, 2021 – 2032

  9.4.6.6 ASEAN Countries

   9.4.6.6.1 Photoacoustic Tomography Market Size & Forecast, By Type, 2021 – 2032

   9.4.6.6.2 Photoacoustic Tomography Market Size & Forecast, By Application, 2021 – 2032

   9.4.6.6.3 Photoacoustic Tomography Market Size & Forecast, By Imaging Type, 2021 – 2032

   9.4.6.6.4 Photoacoustic Tomography Market Size & Forecast, By End Use, 2021 – 2032

  9.4.6.7 Rest of Asia-Pacific

   9.4.6.7.1 Photoacoustic Tomography Market Size & Forecast, By Type, 2021 – 2032

   9.4.6.7.2 Photoacoustic Tomography Market Size & Forecast, By Application, 2021 – 2032

   9.4.6.7.3 Photoacoustic Tomography Market Size & Forecast, By Imaging Type, 2021 – 2032

   9.4.6.7.4 Photoacoustic Tomography Market Size & Forecast, By End Use, 2021 – 2032

9.5 Latin America

 9.5.1 Key Trends

 9.5.2 Photoacoustic Tomography Market Size & Forecast, By Type, 2021 – 2032

 9.5.3 Photoacoustic Tomography Market Size & Forecast, By Application, 2021 – 2032

 9.5.4 Photoacoustic Tomography Market Size & Forecast, By Imaging Type, 2021 – 2032

 9.5.5 Photoacoustic Tomography Market Size & Forecast, By End Use, 2021 – 2032

 9.5.6 Photoacoustic Tomography Market Size & Forecast, By Country, 2021 – 2032

  9.5.6.1 Brazil

   9.5.6.1.1 Photoacoustic Tomography Market Size & Forecast, By Type, 2021 – 2032

   9.5.6.1.2 Photoacoustic Tomography Market Size & Forecast, By Application, 2021 – 2032

   9.5.6.1.3 Photoacoustic Tomography Market Size & Forecast, By Imaging Type, 2021 – 2032

   9.5.6.1.4 Photoacoustic Tomography Market Size & Forecast, By End Use, 2021 – 2032

  9.5.6.2 Argentina

   9.5.6.2.1 Photoacoustic Tomography Market Size & Forecast, By Type, 2021 – 2032

   9.5.6.2.2 Photoacoustic Tomography Market Size & Forecast, By Application, 2021 – 2032

   9.5.6.2.3 Photoacoustic Tomography Market Size & Forecast, By Imaging Type, 2021 – 2032

   9.5.6.2.4 Photoacoustic Tomography Market Size & Forecast, By End Use, 2021 – 2032

  9.5.6.3 Mexico

   9.5.6.3.1 Photoacoustic Tomography Market Size & Forecast, By Type, 2021 – 2032

   9.5.6.3.2 Photoacoustic Tomography Market Size & Forecast, By Application, 2021 – 2032

   9.5.6.3.3 Photoacoustic Tomography Market Size & Forecast, By Imaging Type, 2021 – 2032

   9.5.6.3.4 Photoacoustic Tomography Market Size & Forecast, By End Use, 2021 – 2032

  9.5.6.4 Colombia

   9.5.6.4.1 Photoacoustic Tomography Market Size & Forecast, By Type, 2021 – 2032

   9.5.6.4.2 Photoacoustic Tomography Market Size & Forecast, By Application, 2021 – 2032

   9.5.6.4.3 Photoacoustic Tomography Market Size & Forecast, By Imaging Type, 2021 – 2032

   9.5.6.4.4 Photoacoustic Tomography Market Size & Forecast, By End Use, 2021 – 2032

  9.5.6.5 Rest of Latin America

   9.5.6.5.1 Photoacoustic Tomography Market Size & Forecast, By Type, 2021 – 2032

   9.5.6.5.2 Photoacoustic Tomography Market Size & Forecast, By Application, 2021 – 2032

   9.5.6.5.3 Photoacoustic Tomography Market Size & Forecast, By Imaging Type, 2021 – 2032

   9.5.6.5.4 Photoacoustic Tomography Market Size & Forecast, By End Use, 2021 – 2032

9.6 Middle East & Africa

 9.6.1 Key Trends

 9.6.2 Photoacoustic Tomography Market Size & Forecast, By Type, 2021 – 2032

 9.6.3 Photoacoustic Tomography Market Size & Forecast, By Application, 2021 – 2032

 9.6.4 Photoacoustic Tomography Market Size & Forecast, By Imaging Type, 2021 – 2032

 9.6.5 Photoacoustic Tomography Market Size & Forecast, By End Use, 2021 – 2032

 9.6.6 Photoacoustic Tomography Market Size & Forecast, By Country, 2021 – 2032

  9.6.6.1 UAE

   9.6.6.1.1 Photoacoustic Tomography Market Size & Forecast, By Type, 2021 – 2032

   9.6.6.1.2 Photoacoustic Tomography Market Size & Forecast, By Application, 2021 – 2032

   9.6.6.1.3 Photoacoustic Tomography Market Size & Forecast, By Imaging Type, 2021 – 2032

   9.6.6.1.4 Photoacoustic Tomography Market Size & Forecast, By End Use, 2021 – 2032

  9.6.6.2 Saudi Arabia

   9.6.6.2.1 Photoacoustic Tomography Market Size & Forecast, By Type, 2021 – 2032

   9.6.6.2.2 Photoacoustic Tomography Market Size & Forecast, By Application, 2021 – 2032

   9.6.6.2.3 Photoacoustic Tomography Market Size & Forecast, By Imaging Type, 2021 – 2032

   9.6.6.2.4 Photoacoustic Tomography Market Size & Forecast, By End Use, 2021 – 2032

  9.6.6.3 Qatar

   9.6.6.3.1 Photoacoustic Tomography Market Size & Forecast, By Type, 2021 – 2032

   9.6.6.3.2 Photoacoustic Tomography Market Size & Forecast, By Application, 2021 – 2032

   9.6.6.3.3 Photoacoustic Tomography Market Size & Forecast, By Imaging Type, 2021 – 2032

   9.6.6.3.4 Photoacoustic Tomography Market Size & Forecast, By End Use, 2021 – 2032

  9.6.6.4 Egypt

   9.6.6.4.1 Photoacoustic Tomography Market Size & Forecast, By Type, 2021 – 2032

   9.6.6.4.2 Photoacoustic Tomography Market Size & Forecast, By Application, 2021 – 2032

   9.6.6.4.3 Photoacoustic Tomography Market Size & Forecast, By Imaging Type, 2021 – 2032

   9.6.6.4.4 Photoacoustic Tomography Market Size & Forecast, By End Use, 2021 – 2032

  9.6.6.5 South Africa

   9.6.6.5.1 Photoacoustic Tomography Market Size & Forecast, By Type, 2021 – 2032

   9.6.6.5.2 Photoacoustic Tomography Market Size & Forecast, By Application, 2021 – 2032

   9.6.6.5.3 Photoacoustic Tomography Market Size & Forecast, By Imaging Type, 2021 – 2032

   9.6.6.5.4 Photoacoustic Tomography Market Size & Forecast, By End Use, 2021 – 2032

  9.6.6.6 Rest of Middle East & Africa

   9.6.6.6.1 Photoacoustic Tomography Market Size & Forecast, By Type, 2021 – 2032

   9.6.6.6.2 Photoacoustic Tomography Market Size & Forecast, By Application, 2021 – 2032

   9.6.6.6.3 Photoacoustic Tomography Market Size & Forecast, By Imaging Type, 2021 – 2032

   9.6.6.6.4 Photoacoustic Tomography Market Size & Forecast, By End Use, 2021 – 2032

10. Competitive Landscape

 10.1 Key Players' Positioning

 10.2 Competitive Developments

  10.2.1 Key Strategies Adopted (%), By Key Players, 2024

  10.2.2 Year-Wise Strategies & Development, 2021 – 2025

  10.2.3 Number Of Strategies Adopted By Key Players, 2024

 10.3 Market Share Analysis, 2024

 10.4 Product/Service & Application Benchmarking

  10.4.1 Product/Service Specifications & Features By Key Players

  10.4.2 Product/Service Heatmap By Key Players

  10.4.3 Application Heatmap By Key Players

 10.5 Industry Start-Up & Innovation Landscape

 10.6 Key Company Profiles

10.6 Key Company Profiles

 10.6.1 Endra Life Sciences
  10.6.1.1 Company Overview & Snapshot
  10.6.1.2 Product/Service Portfolio
  10.6.1.3 Key Company Financials
  10.6.1.4 SWOT Analysis

 10.6.2 FUJIFILM VisualSonics
  10.6.2.1 Company Overview & Snapshot
  10.6.2.2 Product/Service Portfolio
  10.6.2.3 Key Company Financials
  10.6.2.4 SWOT Analysis

 10.6.3 iThera Medical
  
10.6.3.1 Company Overview & Snapshot
  10.6.3.2 Product/Service Portfolio
  10.6.3.3 Key Company Financials
  10.6.3.4 SWOT Analysis

 10.6.4 Kibero GmbH
  
10.6.4.1 Company Overview & Snapshot
  10.6.4.2 Product/Service Portfolio
  10.6.4.3 Key Company Financials
  10.6.4.4 SWOT Analysis

 10.6.5 Seno Medical Instruments
  10.6.5.1 Company Overview & Snapshot
  10.6.5.2 Product/Service Portfolio
  10.6.5.3 Key Company Financials
  10.6.5.4 SWOT Analysis

 10.6.6 Verasonics
  10.6.6.1 Company Overview & Snapshot
  10.6.6.2 Product/Service Portfolio
  10.6.6.3 Key Company Financials
  10.6.6.4 SWOT Analysis

 10.6.7 Canon Medical Systems Corporation
  
10.6.7.1 Company Overview & Snapshot
  10.6.7.2 Product/Service Portfolio
  10.6.7.3 Key Company Financials
  10.6.7.4 SWOT Analysis

 10.6.8 Bruker
  10.6.8.1 Company Overview & Snapshot
  10.6.8.2 Product/Service Portfolio
  10.6.8.3 Key Company Financials
  10.6.8.4 SWOT Analysis

 10.6.9 Tomowave Labs
  
10.6.9.1 Company Overview & Snapshot
  10.6.9.2 Product/Service Portfolio
  10.6.9.3 Key Company Financials
  10.6.9.4 SWOT Analysis

 10.6.10 Vibronix Inc.
  
10.6.10.1 Company Overview & Snapshot
  10.6.10.2 Product/Service Portfolio
  10.6.10.3 Key Company Financials
  10.6.10.4 SWOT Analysis

 10.6.11 Aspect Imaging
  10.6.11.1 Company Overview & Snapshot
  10.6.11.2 Product/Service Portfolio
  10.6.11.3 Key Company Financials
  10.6.11.4 SWOT Analysis

 10.6.12 PerkinElmer Inc.
  
10.6.12.1 Company Overview & Snapshot
  10.6.12.2 Product/Service Portfolio
  10.6.12.3 Key Company Financials
  10.6.12.4 SWOT Analysis

 10.6.13 Spectral Instruments Imaging
  
10.6.13.1 Company Overview & Snapshot
  10.6.13.2 Product/Service Portfolio
  10.6.13.3 Key Company Financials
  10.6.13.4 SWOT Analysis

 10.6.14 InnoLas Laser GmbH
  10.6.14.1 Company Overview & Snapshot
  10.6.14.2 Product/Service Portfolio
  10.6.14.3 Key Company Financials
  10.6.14.4 SWOT Analysis

 10.6.15 Advantest Corporation
  
10.6.15.1 Company Overview & Snapshot
  10.6.15.2 Product/Service Portfolio
  10.6.15.3 Key Company Financials
  10.6.15.4 SWOT Analysis

 10.6.16 PreXion Corporation
  
10.6.16.1 Company Overview & Snapshot
  10.6.16.2 Product/Service Portfolio
  10.6.16.3 Key Company Financials
  10.6.16.4 SWOT Analysis

 10.6.17 EchoSens
  
10.6.17.1 Company Overview & Snapshot
  10.6.17.2 Product/Service Portfolio
  10.6.17.3 Key Company Financials
  10.6.17.4 SWOT Analysis

 10.6.18 Luxonus Inc.
  
10.6.18.1 Company Overview & Snapshot
  10.6.18.2 Product/Service Portfolio
  10.6.18.3 Key Company Financials
  10.6.18.4 SWOT Analysis

 10.6.19 Siemens Healthineers
  10.6.19.1 Company Overview & Snapshot
  10.6.19.2 Product/Service Portfolio
  10.6.19.3 Key Company Financials
  10.6.19.4 SWOT Analysis

 10.6.20 United Imaging Healthcare
  
10.6.20.1 Company Overview & Snapshot
  10.6.20.2 Product/Service Portfolio
  10.6.20.3 Key Company Financials
  10.6.20.4 SWOT Analysis

11. Analyst Recommendations

 11.1 SNS Insider Opportunity Map

 11.2 Industry Low-Hanging Fruit Assessment

 11.3 Market Entry & Growth Strategy

 11.4 Analyst Viewpoint & Suggestions On Market Growth

12. Assumptions

13. Disclaimer

14. Appendix

 14.1 List Of Tables

 14.2 List Of Figures

Key Segments:

By Type

    • Photoacoustic Microscopy
    • Photoacoustic Tomography (PAT)
    • Intravascular Photoacoustic Tomography

By Application

    • Functional Brain Imaging
    • Tumor Angiogenesis
    • Blood Oxygenation Mapping
    • Skin Melanoma Detection
    • Other Applications (e.g., methemoglobin measurement, interventional radiology) 

By Imaging Type

  • Pre-clinical (research laboratories, animal models)
  • Clinical (hospital and diagnostic use)

By End Use

    • Hospitals
    • Diagnostic Imaging Centers
    • Academic & Research Institutes
    • Other End Users

Request for Segment Customization as per your Business Requirement: Segment Customization Request

Regional Coverage: 

North America

  • US
  • Canada

Europe

  • Germany
  • France
  • UK
  • Italy
  • Spain
  • Russia
  • Poland
  • Rest of Europe

Asia Pacific

  • China
  • India
  • Japan
  • South Korea
  • Australia
  • ASEAN Countries
  • Rest of Asia Pacific

Middle East & Africa

  • UAE
  • Saudi Arabia
  • Qatar
  • Egypt
  • South Africa
  • Rest of Middle East & Africa

Latin America

  • Brazil
  • Argentina
  • Mexico
  • Colombia
  • Rest of Latin America

Request for Country Level Research Report: Country Level Customization Request

Available Customization 

With the given market data, SNS Insider offers customization as per the company’s specific needs. The following customization options are available for the report: 

  • Detailed Volume Analysis 
  • Criss-Cross segment analysis (e.g., Product X Application) 
  • Competitive Product Benchmarking 
  • Geographic Analysis 
  • Additional countries in any of the regions 
  • Customized Data Representation 
  • Detailed analysis and profiling of additional market players


An accurate research report requires proper strategizing as well as implementation. There are multiple factors involved in the completion of good and accurate research report and selecting the best methodology to compete the research is the toughest part. Since the research reports we provide play a crucial role in any company’s decision-making process, therefore we at SNS Insider always believe that we should choose the best method which gives us results closer to reality. This allows us to reach at a stage wherein we can provide our clients best and accurate investment to output ratio.

Each report that we prepare takes a timeframe of 350-400 business hours for production. Starting from the selection of titles through a couple of in-depth brain storming session to the final QC process before uploading our titles on our website we dedicate around 350 working hours. The titles are selected based on their current market cap and the foreseen CAGR and growth.


The 5 steps process:

Step 1: Secondary Research:

Secondary Research or Desk Research is as the name suggests is a research process wherein, we collect data through the readily available information. In this process we use various paid and unpaid databases which our team has access to and gather data through the same. This includes examining of listed companies’ annual reports, Journals, SEC filling etc. Apart from this our team has access to various associations across the globe across different industries. Lastly, we have exchange relationships with various university as well as individual libraries.

Secondary Research

Step 2: Primary Research

When we talk about primary research, it is a type of study in which the researchers collect relevant data samples directly, rather than relying on previously collected data.  This type of research is focused on gaining content specific facts that can be sued to solve specific problems. Since the collected data is fresh and first hand therefore it makes the study more accurate and genuine.

We at SNS Insider have divided Primary Research into 2 parts.

Part 1 wherein we interview the KOLs of major players as well as the upcoming ones across various geographic regions. This allows us to have their view over the market scenario and acts as an important tool to come closer to the accurate market numbers. As many as 45 paid and unpaid primary interviews are taken from both the demand and supply side of the industry to make sure we land at an accurate judgement and analysis of the market.

This step involves the triangulation of data wherein our team analyses the interview transcripts, online survey responses and observation of on filed participants. The below mentioned chart should give a better understanding of the part 1 of the primary interview.

Primary Research

Part 2: In this part of primary research the data collected via secondary research and the part 1 of the primary research is validated with the interviews from individual consultants and subject matter experts.

Consultants are those set of people who have at least 12 years of experience and expertise within the industry whereas Subject Matter Experts are those with at least 15 years of experience behind their back within the same space. The data with the help of two main processes i.e., FGDs (Focused Group Discussions) and IDs (Individual Discussions). This gives us a 3rd party nonbiased primary view of the market scenario making it a more dependable one while collation of the data pointers.

Step 3: Data Bank Validation

Once all the information is collected via primary and secondary sources, we run that information for data validation. At our intelligence centre our research heads track a lot of information related to the market which includes the quarterly reports, the daily stock prices, and other relevant information. Our data bank server gets updated every fortnight and that is how the information which we collected using our primary and secondary information is revalidated in real time.

Data Bank Validation

Step 4: QA/QC Process

After all the data collection and validation our team does a final level of quality check and quality assurance to get rid of any unwanted or undesired mistakes. This might include but not limited to getting rid of the any typos, duplication of numbers or missing of any important information. The people involved in this process include technical content writers, research heads and graphics people. Once this process is completed the title gets uploader on our platform for our clients to read it.

Step 5: Final QC/QA Process:

This is the last process and comes when the client has ordered the study. In this process a final QA/QC is done before the study is emailed to the client. Since we believe in giving our clients a good experience of our research studies, therefore, to make sure that we do not lack at our end in any way humanly possible we do a final round of quality check and then dispatch the study to the client.