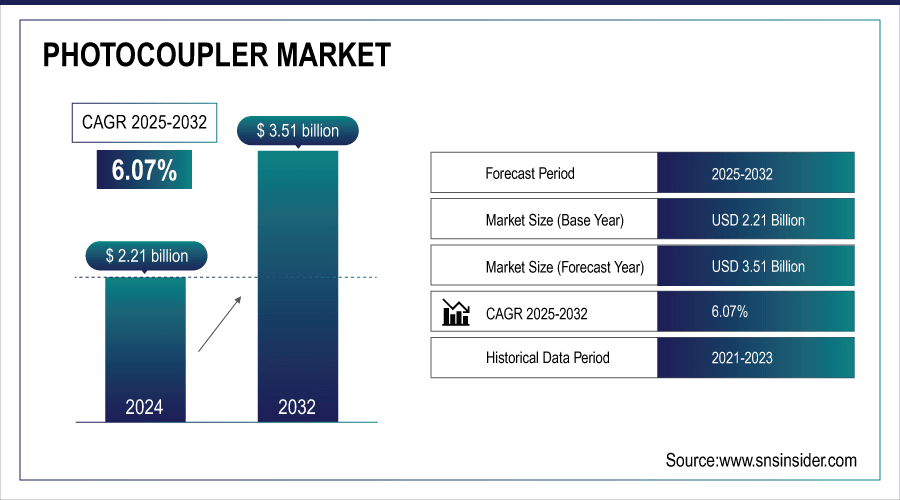
The Photocoupler Market Size was valued at USD 2.21 billion in 2024 and is expected to reach USD 3.51 billion by 2032 and grow at a CAGR of 6.07 % over the forecast period 2025-2032.
The global market is is growing, because of growing demand of reliable electrical isolation devices in different electronic application. Growth in end-use industries such as consumer electronics, automotive, and industrial automation, increased penetration of smart devices, and advancement in semiconductor technology are some of the factors contributing to the strong growth of the market across the globe.
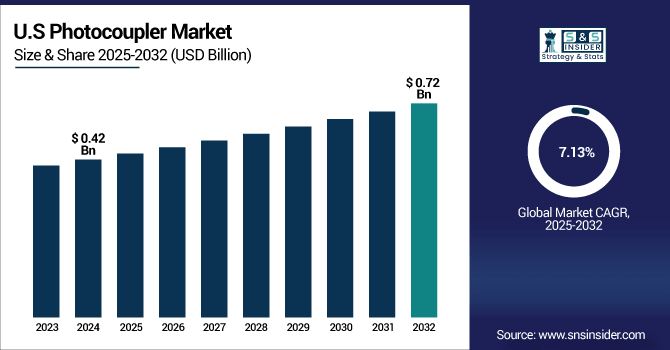
The U.S. Photocoupler Market size was USD 0.42 billion in 2024 and is expected to reach USD 0.72 billion by 2032, growing at a CAGR of 7.13 % over the forecast period of 2025–2032.
US Photocoupler Market growth can be attributed to the growing use of innovative technologies across automotive, consumer electronics, and industrial automation. The increasing production of electric vehicles and use of energy-efficient systems has intensified the requirement for robust signal isolation offerings such as photocouplers. Moreover, the demand in the U.S. is led by focus on technology innovation and the presence of major market players, leading to the market growth.
According to research, U.S.-based companies account for over 70% of patents filed globally in electrical isolation technologies, underscoring the country’s leadership in innovation.
Key Drivers:
Increasing demand for electrical isolation in growing automotive and consumer electronics markets fueling photocoupler use
Increasing demand for electrical isolation to safeguard vulnerable parts in automotive and consumer electronics is driving demand for photocouplers. Electric vehicles and smart devices Photocouplers contribute to the safety and reliability of systems by preventing electrical noise and surges from causing damage to circuits. They are also small and efficient, making them perfect for today's applications, and hence have become very popular. Such a tendency is more enhanced with multi-function and sophistication of electronics, and photocouplers are indispensable in some respects for devices which need to be electrically insulated.
According to research, Photocouplers help reduce electrical noise by up to 30%, enhancing device performance while fitting into smaller, more efficient designs.
Restrain:
Lack of standardized regulations and certification processes affects market confidence and adoption
The lack of a universally accepted standard or certification in the field of photocouplers has led to concerns for end-users, especially in areas where failure could have catastrophic consequences, such as in the medical and aerospace industries. Without it, product approvals can be delayed and trust eroded, constraining market penetration and overall expansion. In addition, local regulations are different in various countries, thereby increasing the compliance burden of companies operating regionally in different geographies. Impeding Expansion. Furthermore, the changing face of safety and environmental legislation requires constant updating and editing, adding cost and serving as a barrier to entry and growth for those smaller companies wishing to penetrate the market.
Opportunities:
Rising demand for photocouplers in emerging applications such as renewable energy and smart grids
Growing renewable energy and smart grid systems need trusty electrical isolation components. Photocouplers are the most appropriate devices in terms of performance, and thus represent a promising area of development. The efficiency and safety of signal isolation for these isolators make them suitable for the technology of contemporary energy systems. Moreover, growing government initiatives towards green energy solutions also encourage the use of these components in sustainable projects across the globe.
According to research, Solar and wind energy installations are projected to increase by more than 12% annually, driving demand for reliable electrical isolation components.
Challenges:
Rapid technological changes requiring frequent product updates increase development costs and risks
The rapid development of electronic technology requires continuous improvement of the photocoupler. Rapid changes in product design result in expensive R&D costs and the market risk of obsolescence. Smaller, less capitalized companies might have a hard time keeping up, which would damage the overall market’s growth. Moreover, the ever-increasing demand to meet environmental and regulatory specifications adds to the complexity of the product development cycle. This constant pressure to innovate leads to shorter product lifecycles, ever more testing investment, and supply chain lurches that make it difficult to maintain profitability within the industry.
By Type
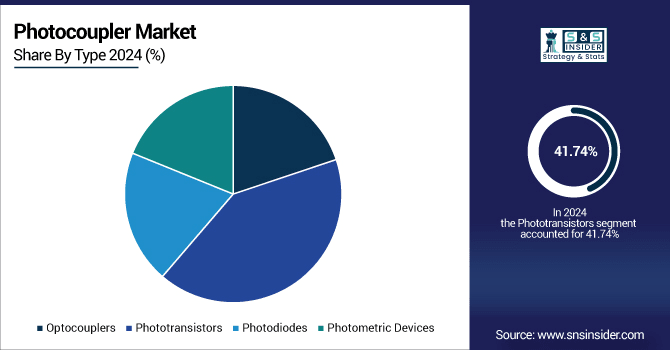
The Phototransistors segment dominated the Photocoupler Market Share in 2024 with about 41.74% due to higher sensitivity and switching speed than other devices. One well known manufacturer of high performance phototransistors is Vishay Intertechnology. They are suitable for exact signal transmission and for reducing the noise in all electronic applications. They are also cost-effective and reliable in separating electrical signals, and so widely used, which helps maintaining the top position of the Tri-morph in the market.
The Optocouplers segment is expected to grow at the fastest CAGR of about 7.32% from 2025 to 2032 due to the rising need of high isolation components in high speed communication and industrial automation applications. Broadcom, a leading supplier of this technology, provides advanced optocoupler solutions that provide superior electrical isolation and signal integrity. Rising adoption in IoT devices, renewable energy systems and consumer electronics is accelerating demand, as optocouplers provide enhanced performance in new technology-led solutions.
By Application
The Consumer Electronics segment held the largest revenue share of about 34.26% in 2024, because to the wide adoption of photocouplers in smartphones, tablet PCs, and smart clothes. Such photocouplers have been, for example, provided by Sharp Corporation as photocouplers for isolation of different parts of a circuit for the purpose of safety and achieving electrical noise. Rising need for performance-oriented, long life, smart devices is contributing to the dominance of this segment in the photocoupler market.The increasing requirement of smart devices with advanced performance and longer life is also responsible for this segment's high market share in the photocoupler market.
The Automotive segment is projected to grow at the fastest CAGR of about 7.55% from 2025 to 2032 due to the higher utilization of photocouplers in the advanced driver assistance systems (ADAS), electric vehicle (EV) and in-vehicle networking. Photocouplers Companies like Texas Instruments enables this growth with battle-proven photocoupler solutions for electrical isolation in automotive systems. Increasing investments in the autonomous driving and smart mobility industry drives the demand for automotive applications.
By End-Use Industry
The Manufacturing segment dominated the Photocoupler Market with a revenue share of about 37.91% in 2024, because photocouplers are essential for employees who work on industrial automation systems. Manufacturers such as Omron Corporation have been at the forefront, developing photocouplers that have been used to isolate equipment from high voltages and electrical noise in order to provide operational safety. Stable demand prevents the use of Smart Factory technology and Industry 4.0 projects from accelerating, continuing to position the manufacturing industry as the flagship industry in the photocoupler market.
The Aerospace segment is expected to grow at the fastest CAGR of about 7.74% from 2025 to 2032 because of the growing use of photocouplers in safety-and reliability-critical avionics and spacecraft applications. Honeywell is a leader in the field with its photocoupler components that are built for use under harsh environment and can securely transmit signals. Increasing investments in satellite technology, defense, and space exploration fuel the rapid growth of this growing end-use industry.
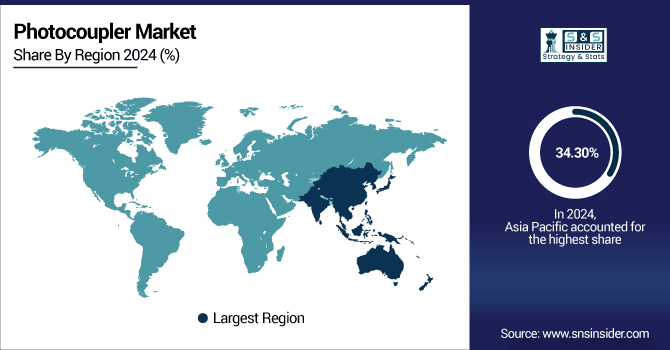
Asia Pacific dominated the Photocoupler Market in 2024 with the highest revenue share of about 34.30% because of the region's heavy concentration of electronics manufacturing hot spots such as China, Japan, South Korea and Taiwan. The increasing use of consumer electronics, industrial automation, and automobile-related equipment has increased the demand for photocouplers in high volumes. Moreover, the likes of Toshiba Corporation are at forerunners of the production methods and innovation technologies in local production and develop apheresis systems at a lower cost and quicker pace, which enhances the dominance of the APAC region.
China leads the Asia Pacific photocoupler market on account of its large electronics production base, strong domestic need, and extensive supply chain. Government backing, low-cost manufacturing, and firms like Toshiba and Panasonic with local operations add to China’s already strong position.
North America is expected to experience the fastest growth in the Photocoupler Market, with a CAGR of about 7.65% from 2025 to 2032, driven by the fast development of industries such as electric vehicle, industrial automation, and so on. A high concentration of safety standards and energy-saving applications have accelerated the incorporation of photocouplers in mission-critical applications in the region. Note that (high-performance) industry leaders like Broadcom Inc. drive innovation, so that an increasing R&D commitment and governmental support fuel market penetration in North America.
The U.S. Photocoupler Market will be led by superior technology environment, penetration of major participants such as Broadcom and ON Semiconductor along with increasing demand across automotive, aerospace, and industrial automation industry and supported by strong R&D and innovation.
Europe has emerged as a popular region for the Photocoupler Market fueled by the increased demand for automotive electronics, industrial automation, and renewable energy systems. The area’s focus on safety, sustainability, and high-performance technologies drives demand for quality isolation components. Key manufacturers and country wise participants production association ensures that the industry is competitive by innovating and adopting such trends as optimal products or creative production technologies.
Germany is the major country of Photocoupler Market in Europe. The mechanical and automotive industries are quite powerful, an automation generalization is available and it is the base for large automotive, photonics and semiconductor organizations. The focus of Germany on innovation, precision engineering, and incorporation of Industry 4.0 has established it as a major consumer and producer of photocouplers in Europe.
In the Middle East & Africa, the UAE accounts for the maximum share of Photocoupler Market owing to the priority being given to a smart infrastructure, industrial automation and renewable energy projects. In Latin America, Brazil is the leading automotive adhesive market as the country has grown as a manufacturing base for electronics, has a growing automotive industry, and increased demand for energy-efficient technologies.
Major Key Players in Photocoupler Market are Broadcom Inc., Texas Instruments Inc., Toshiba Corporation, ON Semiconductor (onsemi), Vishay Intertechnology, Inc., Renesas Electronics Corporation, Lite-On Technology Corporation, Everlight Electronics Co., Ltd., Panasonic Corporation, IXYS Corporation (Littelfuse, Inc.) and others.
In April 2023, Broadcom showcased the world's first Tomahawk 5-based 51.2T Bailly CPO prototype system at OFC 2023. This innovation emphasizes the company's commitment to advancing optical connectivity and photonic integrated circuits.
In December 2023, Texas Instruments' ISO77x series digital isolators with optical coupling technology continue to be integral in high-speed communication systems, reflecting the company's ongoing development in isolation solutions.
Report Attributes | Details |
---|---|
Market Size in 2024 | USD 2.21 Billion |
Market Size by 2032 | USD 3.51 Billion |
CAGR | CAGR of 6.07% From 2025 to 2032 |
Base Year | 2024 |
Forecast Period | 2025-2032 |
Historical Data | 2021-2023 |
Report Scope & Coverage | Market Size, Segments Analysis, Competitive Landscape, Regional Analysis, DROC & SWOT Analysis, Forecast Outlook |
Key Segments | • By Type (Optocouplers, Phototransistors, Photodiodes, Photometric Devices) • By Application (Consumer Electronics, Automotive, Industrial, Healthcare, Telecommunications) • By End-Use Industry (Aerospace, Energy and Power, Manufacturing, Food and Beverage, Pharmaceuticals) |
Regional Analysis/Coverage | North America (US, Canada, Mexico), Europe (Germany, France, UK, Italy, Spain, Poland, Turkey, Rest of Europe), Asia Pacific (China, India, Japan, South Korea, Singapore, Australia,Taiwan, Rest of Asia Pacific), Middle East & Africa (UAE, Saudi Arabia, Qatar, South Africa, Rest of Middle East & Africa), Latin America (Brazil, Argentina, Rest of Latin America) |
Company Profiles | Broadcom Inc., Texas Instruments Inc., Toshiba Corporation, ON Semiconductor (onsemi), Vishay Intertechnology, Inc., Renesas Electronics Corporation, Lite-On Technology Corporation, Everlight Electronics Co., Ltd., Panasonic Corporation, IXYS Corporation (Littelfuse, Inc.) |
Ans: The Photocoupler Market is expected to grow at a CAGR of 6.07 % from 2025-2032.
Ans: The Photocoupler Market size was USD 2.21 billion in 2024 and is expected to reach USD 3.51 billion by 2032.
Ans: The major growth factor of the Photocoupler Market is the increasing demand for electrical isolation in automation, automotive electronics, and high-speed communication systems.
Ans: Phototransistors segment dominated the Photocoupler Market.
Ans: Asia Pacific dominated the Photocoupler Market in 2024.
Table of Contents
1. Introduction
1.1 Market Definition
1.2 Scope (Inclusion and Exclusions)
1.3 Research Assumptions
2. Executive Summary
2.1 Market Overview
2.2 Regional Synopsis
2.3 Competitive Summary
3. Research Methodology
3.1 Top-Down Approach
3.2 Bottom-up Approach
3.3. Data Validation
3.4 Primary Interviews
4. Market Dynamics Impact Analysis
4.1 Market Driving Factors Analysis
4.1.1 Drivers
4.1.2 Restraints
4.1.3 Opportunities
4.1.4 Challenges
4.2 PESTLE Analysis
4.3 Porter’s Five Forces Model
5. Statistical Insights and Trends Reporting
5.1 3D Packaging and Miniaturization Statistics
5.2 Disaster Resilience Readiness Metrics
5.3 AI/ML Integration Trends
6. Competitive Landscape
6.1 List of Major Companies, By Region
6.2 Market Share Analysis, By Region
6.3 Product Benchmarking
6.3.1 Product specifications and features
6.3.2 Pricing
6.4 Strategic Initiatives
6.4.1 Marketing and promotional activities
6.4.2 Distribution and Supply Chain Strategies
6.4.3 Expansion plans and new Product launches
6.4.4 Strategic partnerships and collaborations
6.5 Technological Advancements
6.6 Market Positioning and Branding
7. Photocoupler Market Segmentation By Type
7.1 Chapter Overview
7.2 Optocouplers
7.2.1 Optocouplers Market Trends Analysis (2021-2032)
7.2.2 Optocouplers Market Size Estimates and Forecasts to 2032 (USD Billion)
7.3 Phototransistors
7.3.1 Phototransistors Market Trends Analysis (2021-2032)
7.3.2 Phototransistors Market Size Estimates and Forecasts to 2032 (USD Billion)
7.4 Photodiodes
7.4.1 Photodiodes Market Trends Analysis (2021-2032)
7.4.2 Photodiodes Market Size Estimates and Forecasts to 2032 (USD Billion)
7.5 Photometric Devices
7.5.1 Photometric Devices Market Trends Analysis (2021-2032)
7.5.2 Photometric Devices Market Size Estimates and Forecasts to 2032 (USD Billion)
8. Photocoupler Market Segmentation By Application
8.1 Chapter Overview
8.2 Consumer Electronics
8.2.1 Consumer Electronics Market Trend Analysis (2021-2032)
8.2.2 Consumer Electronics Market Size Estimates and Forecasts to 2032 (USD Billion)
8.3 Automotive
8.3.1 Automotive Market Trend Analysis (2021-2032)
8.3.2 Automotive Market Size Estimates and Forecasts to 2032 (USD Billion)
8.4 Industrial
8.4.1 Industrial Market Trend Analysis (2021-2032)
8.4.2 Industrial Market Size Estimates and Forecasts to 2032 (USD Billion)
8.5 Healthcare
8.5.1 Healthcare Market Trend Analysis (2021-2032)
8.5.2 Healthcare Market Size Estimates and Forecasts to 2032 (USD Billion)
8.6 Telecommunications
8.6.1 Telecommunications Market Trend Analysis (2021-2032)
8.6.2 Telecommunications Market Size Estimates and Forecasts to 2032 (USD Billion)
9. Photocoupler Market Segmentation By End-Use Industry
9.1 Chapter Overview
9.2 Aerospace
9.2.1 Aerospace Market Trends Analysis (2021-2032)
9.2.2 Aerospace Market Size Estimates and Forecasts to 2032 (USD Billion)
9.3 Energy and Power
9.3.1 Energy and Power Market Trends Analysis (2021-2032)
9.3.2 Energy and Power Market Size Estimates and Forecasts to 2032 (USD Billion)
9.4 Manufacturing
9.4.1 Manufacturing Market Trends Analysis (2021-2032)
9.4.2 Manufacturing Market Size Estimates and Forecasts to 2032 (USD Billion)
9.5 Food and Beverage
9.5.1 Food and Beverage Market Trends Analysis (2021-2032)
9.5.2 Food and Beverage Market Size Estimates and Forecasts to 2032 (USD Billion)
9.6 Pharmaceuticals
9.6.1 Pharmaceuticals Market Trends Analysis (2021-2032)
9.6.2 Pharmaceuticals Market Size Estimates and Forecasts to 2032 (USD Billion)
10. Regional Analysis
10.1 Chapter Overview
10.2 North America
10.2.1 Trends Analysis
10.2.2 North America Photocoupler Market Estimates and Forecasts, by Country (2021-2032) (USD Billion)
10.2.3 North America Photocoupler Market Estimates and Forecasts, By Type (2021-2032) (USD Billion)
10.2.4 North America Photocoupler Market Estimates and Forecasts, By Application (2021-2032) (USD Billion)
10.2.5 North America Photocoupler Market Estimates and Forecasts, By End-Use Industry (2021-2032) (USD Billion)
10.2.6 USA
10.2.6.1 USA Photocoupler Market Estimates and Forecasts, By Type (2021-2032) (USD Billion)
10.2.6.2 USA Photocoupler Market Estimates and Forecasts, By Application (2021-2032) (USD Billion)
10.2.6.3 USA Photocoupler Market Estimates and Forecasts, By End-Use Industry (2021-2032) (USD Billion)
10.2.7 Canada
10.2.7.1 Canada Photocoupler Market Estimates and Forecasts, By Type (2021-2032) (USD Billion)
10.2.7.2 Canada Photocoupler Market Estimates and Forecasts, By Application (2021-2032) (USD Billion)
10.2.7.3 Canada Photocoupler Market Estimates and Forecasts, By End-Use Industry (2021-2032) (USD Billion)
10.2.8 Mexico
10.2.8.1 Mexico Photocoupler Market Estimates and Forecasts, By Type (2021-2032) (USD Billion)
10.2.8.2 Mexico Photocoupler Market Estimates and Forecasts, By Application (2021-2032) (USD Billion)
10.2.8.3 Mexico Photocoupler Market Estimates and Forecasts, By End-Use Industry (2021-2032) (USD Billion)
10.3 Europe
10.3.1 Trends Analysis
10.3.2 Europe Photocoupler Market Estimates and Forecasts, by Country (2021-2032) (USD Billion)
10.3.3 Europe Photocoupler Market Estimates and Forecasts, By Type (2021-2032) (USD Billion)
10.3.4 Europe Photocoupler Market Estimates and Forecasts, By Application (2021-2032) (USD Billion)
10.3.5 Europe Photocoupler Market Estimates and Forecasts, By End-Use Industry(2021-2032) (USD Billion)
10.3.6 Germany
10.3.1.6.1 Germany Photocoupler Market Estimates and Forecasts, By Type (2021-2032) (USD Billion)
10.3.1.6.2 Germany Photocoupler Market Estimates and Forecasts, By Application (2021-2032) (USD Billion)
10.3.1.6.3 Germany Photocoupler Market Estimates and Forecasts, By End-Use Industry (2021-2032) (USD Billion)
10.3.7 France
10.3.7.1 France Photocoupler Market Estimates and Forecasts, By Type (2021-2032) (USD Billion)
10.3.7.2 France a Photocoupler Market Estimates and Forecasts, By Application (2021-2032) (USD Billion)
10.3.7.3 France Photocoupler Market Estimates and Forecasts, By End-Use Industry (2021-2032) (USD Billion)
10.3.8 UK
10.3.8.1 UK Photocoupler Market Estimates and Forecasts, By Type (2021-2032) (USD Billion)
10.3.8.2 UK Photocoupler Market Estimates and Forecasts, By Application (2021-2032) (USD Billion)
10.3.8.3 UK Photocoupler Market Estimates and Forecasts, By End-Use Industry (2021-2032) (USD Billion)
10.3.9 Italy
10.3.9.1 Italy Photocoupler Market Estimates and Forecasts, By Type (2021-2032) (USD Billion)
10.3.9.2 Italy Photocoupler Market Estimates and Forecasts, By Application (2021-2032) (USD Billion)
10.3.9.3 Italy Photocoupler Market Estimates and Forecasts, By End-Use Industry (2021-2032) (USD Billion)
10.3.10 Spain
10.3.10.1 Spain Photocoupler Market Estimates and Forecasts, By Type (2021-2032) (USD Billion)
10.3.10.2 Spain Photocoupler Market Estimates and Forecasts, By Application (2021-2032) (USD Billion)
10.3.10.3 Spain Photocoupler Market Estimates and Forecasts, By End-Use Industry (2021-2032) (USD Billion)
10.3.12 Poland
10.3.12.1 Poland Photocoupler Market Estimates and Forecasts, by Country (2021-2032) (USD Billion)
10.3.12.1 Poland Photocoupler Market Estimates and Forecasts, By Type (2021-2032) (USD Billion)
10.3.12.3 Poland Photocoupler Market Estimates and Forecasts, By Application (2021-2032) (USD Billion)
10.3.12.3 Poland Photocoupler Market Estimates and Forecasts, By End-Use Industry (2021-2032) (USD Billion)
10.3.13 Turkey
10.3.13.1 Turkey Photocoupler Market Estimates and Forecasts, By Type (2021-2032) (USD Billion)
10.3.13.2 Turkey Photocoupler Market Estimates and Forecasts, By Application (2021-2032) (USD Billion)
10.3.13.3 Turkey Photocoupler Market Estimates and Forecasts, By End-Use Industry (2021-2032) (USD Billion)
10.3.14 Rest of Europe
10.3.14.1 Rest of Europe Photocoupler Market Estimates and Forecasts, By Type (2021-2032) (USD Billion)
10.3.14.2 Rest of Europe Photocoupler Market Estimates and Forecasts, By Application (2021-2032) (USD Billion)
10.3.14.3 Rest of Europe Photocoupler Market Estimates and Forecasts, By End-Use Industry(2021-2032) (USD Billion)
10.4 Asia-Pacific
10.4.1 Trends Analysis
10.4.2 Asia-Pacific Photocoupler Market Estimates and Forecasts, by Country (2021-2032) (USD Billion)
10.4.3 Asia-Pacific Photocoupler Market Estimates and Forecasts, By Type (2021-2032) (USD Billion)
10.4.4 Asia-Pacific Photocoupler Market Estimates and Forecasts, By Application (2021-2032) (USD Billion)
10.4.5 Asia-Pacific Photocoupler Market Estimates and Forecasts, By End-Use Industry (2021-2032) (USD Billion)
10.4.6 China
10.4.6.1 China Photocoupler Market Estimates and Forecasts, By Type (2021-2032) (USD Billion)
10.4.6.2 China Photocoupler Market Estimates and Forecasts, By Application (2021-2032) (USD Billion)
10.4.6.3 China Photocoupler Market Estimates and Forecasts, By End-Use Industry (2021-2032) (USD Billion)
10.4.7 India
10.4.7.1 India Photocoupler Market Estimates and Forecasts, By Type (2021-2032) (USD Billion)
10.4.7.2 India Photocoupler Market Estimates and Forecasts, By Application (2021-2032) (USD Billion)
10.4.7.3 India Photocoupler Market Estimates and Forecasts, By End-Use Industry (2021-2032) (USD Billion)
10.4.8 Japan
10.4.8.1 Japan Photocoupler Market Estimates and Forecasts, By Type (2021-2032) (USD Billion)
10.4.8.2 Japan Photocoupler Market Estimates and Forecasts, By Application (2021-2032) (USD Billion)
10.4.8.3 Japan Photocoupler Market Estimates and Forecasts, By End-Use Industry (2021-2032) (USD Billion)
10.4.9 South Korea
10.4.9.1 South Korea Photocoupler Market Estimates and Forecasts, By Type (2021-2032) (USD Billion)
10.4.9.2 South Korea Photocoupler Market Estimates and Forecasts, By Application (2021-2032) (USD Billion)
10.4.9.3 South Korea Photocoupler Market Estimates and Forecasts, By End-Use Industry (2021-2032) (USD Billion)
10.4.10 Singapore
10.4.10.1 Singapore Photocoupler Market Estimates and Forecasts, By Type (2021-2032) (USD Billion)
10.4.10.2 Singapore Photocoupler Market Estimates and Forecasts, By Application (2021-2032) (USD Billion)
10.4.10.3 Singapore Photocoupler Market Estimates and Forecasts, By End-Use Industry (2021-2032) (USD Billion)
10.4.11 Australia
10.4.11.1 Australia Photocoupler Market Estimates and Forecasts, By Type (2021-2032) (USD Billion)
10.4.11.2 Australia Photocoupler Market Estimates and Forecasts, By Application (2021-2032) (USD Billion)
10.4.11.3 Australia Photocoupler Market Estimates and Forecasts, By End-Use Industry (2021-2032) (USD Billion)
10.4.12 Taiwan
10.4.12.1 Taiwan Photocoupler Market Estimates and Forecasts, By Type (2021-2032) (USD Billion)
10.4.12.2 Taiwan Photocoupler Market Estimates and Forecasts, By Application (2021-2032) (USD Billion)
10.4.12.3 Taiwan Photocoupler Market Estimates and Forecasts, By End-Use Industry (2021-2032) (USD Billion)
10.4.13 Rest of Asia-Pacific
10.4.13.1 Rest of Asia-Pacific Photocoupler Market Estimates and Forecasts, By Type (2021-2032) (USD Billion)
10.4.13.2 Rest of Asia-Pacific Photocoupler Market Estimates and Forecasts, By Application (2021-2032) (USD Billion)
10.4.13.3 Rest of Asia-Pacific Photocoupler Market Estimates and Forecasts, By End-Use Industry (2021-2032) (USD Billion)
10.5 Middle East and Africa
10.5.1 Trends Analysis
10.5.2 Middle East and Africa East Photocoupler Market Estimates and Forecasts, by Country (2021-2032) (USD Billion)
10.5.3Middle East and Africa Photocoupler Market Estimates and Forecasts, By Type (2021-2032) (USD Billion)
10.5.4 Middle East and Africa Photocoupler Market Estimates and Forecasts, By Application (2021-2032) (USD Billion)
10.5.5 Middle East and Africa Photocoupler Market Estimates and Forecasts, By End-Use Industry (2021-2032) (USD Billion)
10.5.6 UAE
10.5.6.1 UAE Photocoupler Market Estimates and Forecasts, By Type (2021-2032) (USD Billion)
10.5.6.2 UAE Photocoupler Market Estimates and Forecasts, By Application (2021-2032) (USD Billion)
10.5.6.3 UAE Photocoupler Market Estimates and Forecasts, By End-Use Industry (2021-2032) (USD Billion)
10.5.7 Saudi Arabia
10.5.7.1 Saudi Arabia Photocoupler Market Estimates and Forecasts, By Type (2021-2032) (USD Billion)
10.5.7.2 Saudi Arabia Photocoupler Market Estimates and Forecasts, By Application (2021-2032) (USD Billion)
10.5.7.3 Saudi Arabia Photocoupler Market Estimates and Forecasts, By End-Use Industry (2021-2032) (USD Billion)
10.5.8 Qatar
10.5.8.1 Qatar Photocoupler Market Estimates and Forecasts, By Type (2021-2032) (USD Billion)
10.5.8.2 Qatar Photocoupler Market Estimates and Forecasts, By Application (2021-2032) (USD Billion)
10.5.8.3 Qatar Photocoupler Market Estimates and Forecasts, By End-Use Industry (2021-2032) (USD Billion)
10.5.9 South Africa
10.5.9 1 South Africa Photocoupler Market Estimates and Forecasts, By Type (2021-2032) (USD Billion)
10.5.9 2 South Africa Photocoupler Market Estimates and Forecasts By Application (2021-2032) (USD Billion)
10.5.9 3 South Africa Photocoupler Market Estimates and Forecasts, By End-Use Industry (2021-2032) (USD Billion)
10.5.10 Rest of Middle East & Africa
10.5.10.1 Rest of Middle East & Africa Photocoupler Market Estimates and Forecasts, By Type (2021-2032) (USD Billion)
10.5.10.2 Rest of Middle East & Africa Photocoupler Market Estimates and Forecasts, By Application (2021-2032) (USD Billion)
10.5.10.3 Rest of Middle East & Africa Photocoupler Market Estimates and Forecasts, By End-Use Industry (2021-2032) (USD Billion)
10.6 Latin America
10.6.1 Trends Analysis
10.6.2 Latin America Photocoupler Market Estimates and Forecasts, by Country (2021-2032) (USD Billion)
10.6.3 Latin America Photocoupler Market Estimates and Forecasts, By Type (2021-2032) (USD Billion)
10.6.4 Latin America Photocoupler Market Estimates and Forecasts, By Application (2021-2032) (USD Billion)
10.6.5 Latin America Photocoupler Market Estimates and Forecasts, By End-Use Industry (2021-2032) (USD Billion)
10.6.6 Brazil
10.6.6.1 Brazil Photocoupler Market Estimates and Forecasts, By Type (2021-2032) (USD Billion)
10.6.6.2 Brazil Photocoupler Market Estimates and Forecasts, By Application (2021-2032) (USD Billion)
10.6.6.3 Brazil Photocoupler Market Estimates and Forecasts, By End-Use Industry (2021-2032) (USD Billion)
10.6.7 Argentina
10.6.7.1 Argentina Photocoupler Market Estimates and Forecasts, By Type (2021-2032) (USD Billion)
10.6.7.2 Argentina Photocoupler Market Estimates and Forecasts, By Application (2021-2032) (USD Billion)
10.6.7.3 Argentina Photocoupler Market Estimates and Forecasts, By End-Use Industry (2021-2032) (USD Billion)
10.6.8 Rest of Latin America
10.6.8.1 Rest of Latin America Photocoupler Market Estimates and Forecasts, By Type (2021-2032) (USD Billion)
10.6.8.2 Rest of Latin America Photocoupler Market Estimates and Forecasts, By Application (2021-2032) (USD Billion)
10.6.8.3 Rest of Latin America Photocoupler Market Estimates and Forecasts, By End-Use Industry (2021-2032) (USD Billion)
12. Company Profiles
12.1 Broadcom Inc.
12.1.1 Company Overview
12.1.2 Financial
12.1.3 Products/ Services Offered
12.1.4 SWOT Analysis
12.2 Texas Instruments Inc.
12.2.1 Company Overview
12.2.2 Financial
12.2.3 Products/ Services Offered
12.2.4 SWOT Analysis
12.3 Toshiba Corporation
12.3.1 Company Overview
12.3.2 Financial
12.3.3 Products/ Services Offered
12.3.4 SWOT Analysis
12.4 ON Semiconductor (onsemi)
12.4.1 Company Overview
12.4.2 Financial
12.4.3 Products/ Services Offered
12.4.4 SWOT Analysis
12.5 Vishay Intertechnology, Inc.
12.5.1 Company Overview
12.5.2 Financial
12.5.3 Products/ Services Offered
12.5.4 SWOT Analysis
12.6 Renesas Electronics Corporation
12.6.1 Company Overview
12.6.2 Financial
12.6.3 Products/ Services Offered
12.6.4 SWOT Analysis
12.7 Lite-On Technology Corporation
12.7.1 Company Overview
12.7.2 Financial
12.7.3 Products/ Services Offered
12.7.4 SWOT Analysis
12.8 Everlight Electronics Co., Ltd.
12.8.1 Company Overview
12.8.2 Financial
12.8.3 Products/ Services Offered
12.8.4 SWOT Analysis
12.9 Panasonic Corporation
12.9.1 Company Overview
12.9.2 Financial
12.9.3 Products/ Services Offered
12.9.4 SWOT Analysis
12.10 IXYS Corporation (Littelfuse, Inc.)
12.10.1 Company Overview
12.10.2 Financial
12.10.3 Products/ Services Offered
12.10.4 SWOT Analysi
12. Use Cases and Best Practices
13. Conclusion
An accurate research report requires proper strategizing as well as implementation. There are multiple factors involved in the completion of good and accurate research report and selecting the best methodology to compete the research is the toughest part. Since the research reports we provide play a crucial role in any company’s decision-making process, therefore we at SNS Insider always believe that we should choose the best method which gives us results closer to reality. This allows us to reach at a stage wherein we can provide our clients best and accurate investment to output ratio.
Each report that we prepare takes a timeframe of 350-400 business hours for production. Starting from the selection of titles through a couple of in-depth brain storming session to the final QC process before uploading our titles on our website we dedicate around 350 working hours. The titles are selected based on their current market cap and the foreseen CAGR and growth.
The 5 steps process:
Step 1: Secondary Research:
Secondary Research or Desk Research is as the name suggests is a research process wherein, we collect data through the readily available information. In this process we use various paid and unpaid databases which our team has access to and gather data through the same. This includes examining of listed companies’ annual reports, Journals, SEC filling etc. Apart from this our team has access to various associations across the globe across different industries. Lastly, we have exchange relationships with various university as well as individual libraries.
Step 2: Primary Research
When we talk about primary research, it is a type of study in which the researchers collect relevant data samples directly, rather than relying on previously collected data. This type of research is focused on gaining content specific facts that can be sued to solve specific problems. Since the collected data is fresh and first hand therefore it makes the study more accurate and genuine.
We at SNS Insider have divided Primary Research into 2 parts.
Part 1 wherein we interview the KOLs of major players as well as the upcoming ones across various geographic regions. This allows us to have their view over the market scenario and acts as an important tool to come closer to the accurate market numbers. As many as 45 paid and unpaid primary interviews are taken from both the demand and supply side of the industry to make sure we land at an accurate judgement and analysis of the market.
This step involves the triangulation of data wherein our team analyses the interview transcripts, online survey responses and observation of on filed participants. The below mentioned chart should give a better understanding of the part 1 of the primary interview.
Part 2: In this part of primary research the data collected via secondary research and the part 1 of the primary research is validated with the interviews from individual consultants and subject matter experts.
Consultants are those set of people who have at least 12 years of experience and expertise within the industry whereas Subject Matter Experts are those with at least 15 years of experience behind their back within the same space. The data with the help of two main processes i.e., FGDs (Focused Group Discussions) and IDs (Individual Discussions). This gives us a 3rd party nonbiased primary view of the market scenario making it a more dependable one while collation of the data pointers.
Step 3: Data Bank Validation
Once all the information is collected via primary and secondary sources, we run that information for data validation. At our intelligence centre our research heads track a lot of information related to the market which includes the quarterly reports, the daily stock prices, and other relevant information. Our data bank server gets updated every fortnight and that is how the information which we collected using our primary and secondary information is revalidated in real time.
Step 4: QA/QC Process
After all the data collection and validation our team does a final level of quality check and quality assurance to get rid of any unwanted or undesired mistakes. This might include but not limited to getting rid of the any typos, duplication of numbers or missing of any important information. The people involved in this process include technical content writers, research heads and graphics people. Once this process is completed the title gets uploader on our platform for our clients to read it.
Step 5: Final QC/QA Process:
This is the last process and comes when the client has ordered the study. In this process a final QA/QC is done before the study is emailed to the client. Since we believe in giving our clients a good experience of our research studies, therefore, to make sure that we do not lack at our end in any way humanly possible we do a final round of quality check and then dispatch the study to the client.
Key Segments:
By Type
Optocouplers
Phototransistors
Photodiodes
Photometric Devices
By Application
Consumer Electronics
Automotive
Industrial
Healthcare
Telecommunications
By End-Use Industry
Aerospace
Energy and Power
Manufacturing
Food and Beverage
Pharmaceuticals
Request for Segment Customization as per your Business Requirement: Segment Customization Request
Regional Coverage:
North America
US
Canada
Mexico
Europe
Germany
France
UK
Italy
Spain
Poland
Turkey
Rest of Europe
Asia Pacific
China
India
Japan
South Korea
Singapore
Australia
Taiwan
Rest of Asia Pacific
Middle East & Africa
UAE
Saudi Arabia
Qatar
South Africa
Rest of Middle East & Africa
Latin America
Brazil
Argentina
Rest of Latin America
Request for Country Level Research Report: Country Level Customization Request
Available Customization
With the given market data, SNS Insider offers customization as per the company’s specific needs. The following customization options are available for the report:
Detailed Volume Analysis
Criss-Cross segment analysis (e.g. Product X Application)
Competitive Product Benchmarking
Geographic Analysis
Additional countries in any of the regions
Customized Data Representation
Detailed analysis and profiling of additional market players