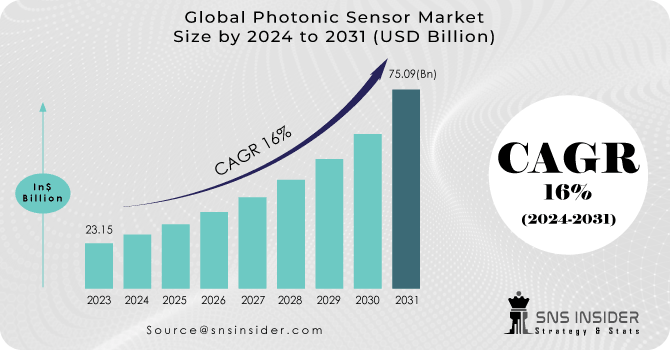
The Photonic Sensor Market will be valued at 75.09 billion by 2031, and Market Size was valued at USD 23.15 billion in 2023. It will grow at a CAGR of 16% over the forecast period 2024-2031.
Photonic sensors are quietly transforming consumer electronics. From touchscreens on smartphones and tablets to high-resolution imaging in cameras and drones, these sensors enhance user experience and device functionality. They enable features like auto-brightness based on ambient light and secure user authentication through fingerprint or iris scanning. The rising global smartphone user base, predicted to exceed 8.5 billion by 2031, fuels this market growth.
Beyond smartphones, wearables like fitness trackers and smartwatches leverage photonic sensors for health tracking features like heart rate monitoring and blood oxygen measurement. Growing health awareness and rising disposable income further propel the wearable device market.
Photonic sensors are also the secret sauce behind smart home devices. They enable features like adjusting display brightness based on light and smart climate control. Additionally, they power touchless gesture recognition in gaming consoles and smart TVs, creating a seamless user experience in our increasingly connected homes.
Get more information on Photonic Sensor Market - Request Sample Report
KEY DRIVERS:
Increasing demand for automation in the manufacturing industry
The demand for automation in the manufacturing sector is rising Increasing adoption of photonics is one of the key factors that has helped to drive growth in this market. Automation in the manufacturing sector, as well as an increasing number of Iot enabled devices for monitoring applications. Industry is now aware of the reliability and long-term financial success created by automated systems based on photonics.
RESTRAIN:
Lack of Industry Standards to hamper market growth.
The market for photonic sensors is becoming more and more widespread in the retail sector. However, there are few recognised standards related to their functioning. In addition, photonic sensors use a variety of technologies such as lasers, fibre optic and bio photonics. Only when they differ from one another do these technologies work together. Market expansion could be further hampered by the low image quality provided by the sensors and the lack of awareness.
Technical difficulties in installing and maintaining equipment
OPPORTUNITY:
Growing demand for photonic transducers
Increasing the use of photonic sensors in consumer electronics,
The use of photonic sensors in industrial processes for temperature sensing and control
CHALLENGES:
Security and safety Concerns
Increased security and safety solution needs to be developed Increased safety and security measures are offered by photonic sensors, which are of major concern to end users. In the past, manual security and safety systems required continuous physical monitoring; however, these sensors allow the system to operate autonomously and provide the end user with a sense of security. By collecting and keeping data on a centralised server, the automatic system works very effectively.
The cost of photonic sensors and detectors is high
IMPACT OF RUSSIAN UKRAINE WAR
Russia and Ukraine accounted for about 30 % of global neon supply, on a regular basis. Other projections based on values from market research firm TECHCET place this figure between 40% and 50%. According to Trend Force, Ukraine supplied almost 70% of the world's neon gas capacity before the war broke out. However, the estimated that 90% of the global supply of high purity neonates is consumed by the production of semiconductors. And it as much as possible The US semiconductor industry imports 90% of its high purity neon’s from Ukraine. 'The impact of this conflict on China's photonic and laser industries is limited in terms of scope,' 'The reason's simple.' With Ukraine, China does not do a great deal to import or export. In addition, China's rise as a domestic producer of photonics has allowed the country to support its own development. reliance insofar as it relates to its photonics ecosystem. China's rapid growth in domestic production of lasers and particularly fibre lasers has been a contributory factor.
Impact of Economic Downturn:
The vast diversity of applications allowed by photonics is a double eco, The promise of nomics and the policy challenges. Technical progress, on the one hand, In the basic principles of photonics, it may have a broad impact in many ways Application and economic sectors. This diversity, on the other hand, means that monitoring of public and private investment, employment, output, and it is difficult to deal with other economic aspects of photonics. Photonics is a wide area of technology Rather than an industry. 'The economic impact of photonics'. There's not a single North American in there, of course. Industry Classification System (NAICS) codes that enable the tracking of Revenue, employment and industry R&D Spending on photonics related fields, and we do not have enough data about government research and development spending in photonics. The lack of this information reduces the chances’ ability of photonics in the industrial community and hinder its use, opment of more coherent.
KEY MARKET SEGMENTATION:
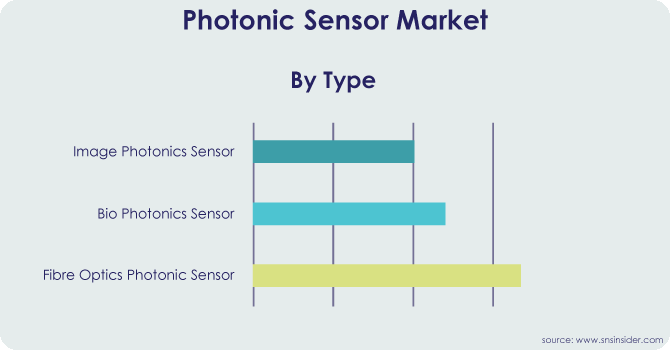
By Type
Fibre optics photonic sensor
Biphotonic sensor
Image photonics sensor
The largest contributor to the market is the image photonic sensor segment, which is expected to grow at a compound annual growth rate of 16.8% over the forecast period. There is a strong correlation between image resolution, the level of illumination and speed. The development of photonics, which allows users to stop time, is shown in the examination of new uses for high-speed imaging cameras. Charge-coupled devices (CCDs) and complementary metal-oxide semiconductors are the two main categories of image sensors (CMOS).
Get Customized Report as per your Business Requirement - Request For Customized Report
By Audience
Research Consultancy
Technology Investor
Sensor Manufacturer
Government Organisations
System Integrators
By End-Users
Oiland Gas
Automotive
Healthcare
Transport
Consumer Electronics
Energy
Industrial Sector
The sensors photonics market is divided into aerospace and defense, on the basis of end user industries. transportation, manufacturing, healthcare, energy and power, and other end-user industries. The largest market is held by the transport sector, which is expected to grow at a compound annual growth rate of 18.46% during the forecast period. period. The transport sector has been rapidly adopting LIDAR technology over the last few years. LiDAR is primarily used in advanced driver assistance systems for vehicles, such asADAS. The convenience of the driver, with a human machine interface for safe navigation and efficient operation. In addition, Governments worldwide are promoting the installation of ADAS features that will help to expand the market.
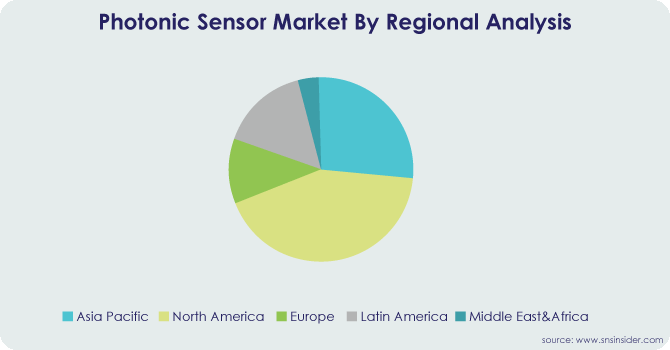
The Asia Pacific region is the largest contributor to revenue and is expected to grow at a compound annual growth rate of 17.48% during the forecast period. period. China is expected to grow as a result of its expanding economy and considerable market share in global electronics. Among the Asia Pacific countries, there is a significant difference. China is a large producer and consumer of electronics. The region's The industrial sector is rapidly expanding, and different technologies for manufacturing and telecommunications are still being developed implemented.
In the forecast period, North America is projected to increase by a compounded annual growth rate of 16.93%. In the course of the forecast period, North the US is expected to be the dominant market for laser sensors. In particular, this is because of optics and photonics Over the last ten years, sensing, imaging and metrology have become even more important in the United States. Due to the growing need for precision sensing, optical measurements are becoming more common.
The development of fibre optic and photonic technologies has made it possible to manufacture precision in the European region, which has led to the development of even more efficient sensors. The market demand is expected to be driven by the impact of Optical Imaging on In the European region, biomolecular sciences and medical diagnostics. There's a lot of photonics on the European continent. Use in a wide variety of areas.
The full use of optics and photonics as an enabling technology is needed in order for Latin America to remain competitive in the global economy. Mexico has begun to take steps to position itself as a leader after realizing this vast market opportunity. Latin America. To make Mexico the leader in Latin America's optical and photonics sector, the first study of the industry in Mexico asks for coordinated and strategic activities and investments from the government, academia, and business.
REGIONAL COVERAGE:
North America
US
Canada
Mexico
Europe
Eastern Europe
Poland
Romania
Hungary
Turkey
Rest of Eastern Europe
Western Europe
Germany
France
UK
Italy
Spain
Netherlands
Switzerland
Austria
Rest of Western Europe
Asia Pacific
China
India
Japan
South Korea
Vietnam
Singapore
Australia
Rest of Asia Pacific
Middle East & Africa
Middle East
UAE
Egypt
Saudi Arabia
Qatar
Rest of the Middle East
Africa
Nigeria
South Africa
Rest of Africa
Latin America
Brazil
Argentina
Colombia
Rest of Latin America
The Key players in Photonic Sensor Market are BK Technologies Corporation, Hytera Communications Corporation Ltd, Toshiba Corporation, Prime Photonics, Banpil Photonics, Inc , L3 Harris, Motorola Solutions, omnisys - thales group, General Electric Company , NP Photonics, Oxsensis, BAE Systems plc, General Dynamics Corporation, ICOM Incorporation, Samsung Electronics, Leonardo S.R.L., MCS Digital, Intevac, Inc., Mitsubishi Electric Corporation and Other.
Hytera Communications Corporation Ltd-Company Financial Analysis
Photonic sensing is a method of detecting and measuring changes in the environment using light, or identifying a particular target. It This involves the use of imaging systems, such as lasers, fibers, detectors and photodetectors, to determine changes in electrical intensity, Changes in the environment or presence of a target may lead to wavelengths, phases, polarizations and time delays.
A variety of applications, e.g. chemical and biological sensing, temperature or pressure measurements, can be carried out with photonic sensors Sensors, structural health monitoring, environmental monitoring and security and surveillance. They offer several advantages in comparison with traditional sensors, such as strong sensitivity, quick response time, immunity to EM interference and ability. to monitor remote or inaccessible areas.
October 2023: The acquisition of eMagin by Samsung Display Co., Ltd., a subsidiary of samsung electronics was completed Corporation, the leader in U.S. based OLED microdisplays. This has given eMagin the scale and technology to do so for customers, the acceleration of growth and greater value has been achieved.
May-2023: Fujifilm Holdings Corporation acquired Entegris, Inc., an American provider of products and systems to purify, protect and transport critical materials used in the production of semiconductor devices As a result of this acquisition, the range of electronic chemicals available to customers will be expanded by Fujifilm, including KMG's High Performance Process ChemicalsHPPCs, which play an important role in Etching and Oxidation During the manufacturing of semiconductors, silicon wafers shall be cleaned.
In September 2022, A new Transparent 3D Formable Touch Sensor is now being manufactured by Canatu, a Carbon Nanomaterial Development Company. In the automotive sector and in the semiconductor sector.
| Report Attributes | Details |
|---|---|
| Market Size in 2022 | US$ 23.15 Billion |
| Market Size by 2030 | US$ 75.90 Billion |
| CAGR | CAGR of 16% From 2024 to 2031 |
| Base Year | 2023 |
| Forecast Period | 2024-2031 |
| Historical Data | 2020-2022 |
| Report Scope & Coverage | Market Size, Segments Analysis, Competitive Landscape, Regional Analysis, DROC & SWOT Analysis, Forecast Outlook |
| Key Segments | • By Type (Fibre Optics Photonic Sensor, Biophotonic Sensor, Image Photonics Sensor) • By End-User (Oil And Gas, Automotive, Healthcare, Transport, Consumer Electronics, Energy, Industrial Sector) • By Audience (Research Consultancy, Technology Investor, Sensor Manufacturer, Government Organizations, System Integrators) |
| Regional Analysis/Coverage | North America (US, Canada, Mexico), Europe (Eastern Europe [Poland, Romania, Hungary, Turkey, Rest of Eastern Europe] Western Europe] Germany, France, UK, Italy, Spain, Netherlands, Switzerland, Austria, Rest of Western Europe]), Asia Pacific (China, India, Japan, South Korea, Vietnam, Singapore, Australia, Rest of Asia Pacific), Middle East & Africa (Middle East [UAE, Egypt, Saudi Arabia, Qatar, Rest of Middle East], Africa [Nigeria, South Africa, Rest of Africa], Latin America (Brazil, Argentina, Colombia, Rest of Latin America) |
| Company Profiles | BK Technologies Corporation, Hytera Communications Corporation Ltd, Toshiba Corporation, Prime Photonics, Banpil Photonics, Inc , L3 Harris, Motorola Solutions, omnisys - thales group, General Electric Company , NP Photonics, Oxsensis, BAE Systems plc, General Dynamics Corporation, ICOM Incorporation, Samsung Electronics, Leonardo S.R.L., MCS Digital, Intevac, Inc., Mitsubishi Electric Corporation |
| Key Drivers | • Increasing demand for automation in the manufacturing industry |
| RESTRAINTS | • Lack of Industry Standards to hamper market growth. • Technical difficulties in installing and maintaining equipment |
The Photonic Sensor Market size was valued at 23.15 billion in 2023 at a CAGR of 16% till 2031
North American region is dominating the Photonic Sensor Market.
The Key players in Global Photonic Sensor Market are BK Technologies Corporation, Hytera Communications Corporation Ltd, Toshiba Corporation, Prime Photonics, Banpil Photonics, Inc , L3 Harris, Motorola Solutions, omnisys - thales group, General Electric Company , NP Photonics, Oxsensis, BAE Systems plc, General Dynamics Corporation, ICOM Incorporation, Samsung Electronics, Leonardo S.R.L., MCS Digital, Intevac, Inc. , Mitsubishi Electric Corporation and Other.
Top-down research, bottom-up research, qualitative research, quantitative research, and Fundamental research.
Manufacturers, Consultants, Association, Research Institutes, private and university libraries, suppliers, and distributors of the product.
TABLE OF CONTENTS
1. Introduction
1.1 Market Definition
1.2 Scope
1.3 Research Assumptions
2. Industry Flowchart
3. Research Methodology
4. Market Dynamics
4.1 Drivers
4.2 Restraints
4.3 Opportunities
4.4 Challenges
5. Impact Analysis
5.1 Impact of Russia-Ukraine Crisis
5.2 Impact of Economic Slowdown on Major Countries
5.2.1 Introduction
5.2.2 United States
5.2.3 Canada
5.2.4 Germany
5.2.5 France
5.2.6 UK
5.2.7 China
5.2.8 Japan
5.2.9 South Korea
5.2.10 India
6. Value Chain Analysis
7. Porter’s 5 Forces Model
8. Pest Analysis
9. Photonic Sensor Market Segmentation, By Type
9.1 Introduction
9.2 Trend Analysis
9.3 Fibre optics photonic sensor
9.4 Biphotonic sensor
9.5 Image photonics sensor
10. Photonic Sensor Market Segmentation, By Audience
10.1 Introduction
10.2 Trend Analysis
10.3 Research Consultancy
10.4 Technology Investor
10.5 Sensor Manufacturer
10.6 Government Organisations
10.7 System Integrators
11. Photonic Sensor Market Segmentation, By End Users
11.1 Introduction
11.2 Trend Analysis
11.3 Oil and Gas
11.4 Automotive
11.5 Healthcare
11.6 Transport
11.7 Consumer Electronics
11.8 Energy
11.9 Industrial Sector
12. Regional Analysis
12.1 Introduction
12.2 North America
12.2.1 Trend Analysis
12.2.2 North America Photonic Sensor Market by Country
12.2.3 North America Photonic Sensor Market By Type
12.2.4 North America Photonic Sensor Market By Audience
12.2.5 North America Photonic Sensor Market By End Users
12.2.6 USA
12.2.6.1 USA Photonic Sensor Market By Type
12.2.6.2 USA Photonic Sensor Market By Audience
12.2.6.3 USA Photonic Sensor Market By End Users
12.2.7 Canada
12.2.7.1 Canada Photonic Sensor Market By Type
12.2.7.2 Canada Photonic Sensor Market By Audience
12.2.7.3 Canada Photonic Sensor Market By End Users
12.2.8 Mexico
12.2.8.1 Mexico Photonic Sensor Market By Type
12.2.8.2 Mexico Photonic Sensor Market By Audience
12.2.8.3 Mexico Photonic Sensor Market By End Users
12.3 Europe
12.3.1 Trend Analysis
12.3.2 Eastern Europe
12.3.2.1 Eastern Europe Photonic Sensor Market by Country
12.3.2.2 Eastern Europe Photonic Sensor Market By Type
12.3.2.3 Eastern Europe Photonic Sensor Market By Audience
12.3.2.4 Eastern Europe Photonic Sensor Market By End Users
12.3.2.5 Poland
12.3.2.5.1 Poland Photonic Sensor Market By Type
12.3.2.5.2 Poland Photonic Sensor Market By Audience
12.3.2.5.3 Poland Photonic Sensor Market By End Users
12.3.2.6 Romania
12.3.2.6.1 Romania Photonic Sensor Market By Type
12.3.2.6.2 Romania Photonic Sensor Market By Audience
12.3.2.6.4 Romania Photonic Sensor Market By End Users
12.3.2.7 Hungary
12.3.2.7.1 Hungary Photonic Sensor Market By Type
12.3.2.7.2 Hungary Photonic Sensor Market By Audience
12.3.2.7.3 Hungary Photonic Sensor Market By End Users
12.3.2.8 Turkey
12.3.2.8.1 Turkey Photonic Sensor Market By Type
12.3.2.8.2 Turkey Photonic Sensor Market By Audience
12.3.2.8.3 Turkey Photonic Sensor Market By End Users
12.3.2.9 Rest of Eastern Europe
12.3.2.9.1 Rest of Eastern Europe Photonic Sensor Market By Type
12.3.2.9.2 Rest of Eastern Europe Photonic Sensor Market By Audience
12.3.2.9.3 Rest of Eastern Europe Photonic Sensor Market By End Users
12.3.3 Western Europe
12.3.3.1 Western Europe Photonic Sensor Market by Country
12.3.3.2 Western Europe Photonic Sensor Market By Type
12.3.3.3 Western Europe Photonic Sensor Market By Audience
12.3.3.4 Western Europe Photonic Sensor Market By End Users
12.3.3.5 Germany
12.3.3.5.1 Germany Photonic Sensor Market By Type
12.3.3.5.2 Germany Photonic Sensor Market By Audience
12.3.3.5.3 Germany Photonic Sensor Market By End Users
12.3.3.6 France
12.3.3.6.1 France Photonic Sensor Market By Type
12.3.3.6.2 France Photonic Sensor Market By Audience
12.3.3.6.3 France Photonic Sensor Market By End Users
12.3.3.7 UK
12.3.3.7.1 UK Photonic Sensor Market By Type
12.3.3.7.2 UK Photonic Sensor Market By Audience
12.3.3.7.3 UK Photonic Sensor Market By End Users
12.3.3.8 Italy
12.3.3.8.1 Italy Photonic Sensor Market By Type
12.3.3.8.2 Italy Photonic Sensor Market By Audience
12.3.3.8.3 Italy Photonic Sensor Market By End Users
12.3.3.9 Spain
12.3.3.9.1 Spain Photonic Sensor Market By Type
12.3.3.9.2 Spain Photonic Sensor Market By Audience
12.3.3.9.3 Spain Photonic Sensor Market By End Users
12.3.3.10 Netherlands
12.3.3.10.1 Netherlands Photonic Sensor Market By Type
12.3.3.10.2 Netherlands Photonic Sensor Market By Audience
12.3.3.10.3 Netherlands Photonic Sensor Market By End Users
12.3.3.11 Switzerland
12.3.3.11.1 Switzerland Photonic Sensor Market By Type
12.3.3.11.2 Switzerland Photonic Sensor Market By Audience
12.3.3.11.3 Switzerland Photonic Sensor Market By End Users
12.3.3.1.12 Austria
12.3.3.12.1 Austria Photonic Sensor Market By Type
12.3.3.12.2 Austria Photonic Sensor Market By Audience
12.3.3.12.3 Austria Photonic Sensor Market By End Users
12.3.3.13 Rest of Western Europe
12.3.3.13.1 Rest of Western Europe Photonic Sensor Market By Type
12.3.3.13.2 Rest of Western Europe Photonic Sensor Market By Audience
12.3.3.13.3 Rest of Western Europe Photonic Sensor Market By End Users
12.4 Asia-Pacific
12.4.1 Trend Analysis
12.4.2 Asia-Pacific Photonic Sensor Market by Country
12.4.3 Asia-Pacific Photonic Sensor Market By Type
12.4.4 Asia-Pacific Photonic Sensor Market By Audience
12.4.5 Asia-Pacific Photonic Sensor Market By End Users
12.4.6 China
12.4.6.1 China Photonic Sensor Market By Type
12.4.6.2 China Photonic Sensor Market By Audience
12.4.6.3 China Photonic Sensor Market By End Users
12.4.7 India
12.4.7.1 India Photonic Sensor Market By Type
12.4.7.2 India Photonic Sensor Market By Audience
12.4.7.3 India Photonic Sensor Market By End Users
12.4.8 Japan
12.4.8.1 Japan Photonic Sensor Market By Type
12.4.8.2 Japan Photonic Sensor Market By Audience
12.4.8.3 Japan Photonic Sensor Market By End Users
12.4.9 South Korea
12.4.9.1 South Korea Photonic Sensor Market By Type
12.4.9.2 South Korea Photonic Sensor Market By Audience
12.4.9.3 South Korea Photonic Sensor Market By End Users
12.4.10 Vietnam
12.4.10.1 Vietnam Photonic Sensor Market By Type
12.4.10.2 Vietnam Photonic Sensor Market By Audience
12.4.10.3 Vietnam Photonic Sensor Market By End Users
12.4.11 Singapore
12.4.11.1 Singapore Photonic Sensor Market By Type
12.4.11.2 Singapore Photonic Sensor Market By Audience
12.4.11.3 Singapore Photonic Sensor Market By End Users
12.4.12 Australia
12.4.12.1 Australia Photonic Sensor Market By Type
12.4.12.2 Australia Photonic Sensor Market By Audience
12.4.12.3 Australia Photonic Sensor Market By End Users
12.4.13 Rest of Asia-Pacific
12.4.13.1 Rest of Asia-Pacific Photonic Sensor Market By Type
12.4.13.2 Rest of Asia-Pacific Photonic Sensor Market By Audience
12.4.13.3 Rest of Asia-Pacific Photonic Sensor Market By End Users
12.5 Middle East & Africa
12.5.1 Trend Analysis
12.5.2 Middle East
12.5.2.1 Middle East Photonic Sensor Market by Country
12.5.2.2 Middle East Photonic Sensor Market By Type
12.5.2.3 Middle East Photonic Sensor Market By Audience
12.5.2.4 Middle East Photonic Sensor Market By End Users
12.5.2.5 UAE
12.5.2.5.1 UAE Photonic Sensor Market By Type
12.5.2.5.2 UAE Photonic Sensor Market By Audience
12.5.2.5.3 UAE Photonic Sensor Market By End Users
12.5.2.6 Egypt
12.5.2.6.1 Egypt Photonic Sensor Market By Type
12.5.2.6.2 Egypt Photonic Sensor Market By Audience
12.5.2.6.3 Egypt Photonic Sensor Market By End Users
12.5.2.7 Saudi Arabia
12.5.2.7.1 Saudi Arabia Photonic Sensor Market By Type
12.5.2.7.2 Saudi Arabia Photonic Sensor Market By Audience
12.5.2.7.3 Saudi Arabia Photonic Sensor Market By End Users
12.5.2.8 Qatar
12.5.2.8.1 Qatar Photonic Sensor Market By Type
12.5.2.8.2 Qatar Photonic Sensor Market By Audience
12.5.2.8.3 Qatar Photonic Sensor Market By End Users
12.5.2.9 Rest of Middle East
12.5.2.9.1 Rest of Middle East Photonic Sensor Market By Type
12.5.2.9.2 Rest of Middle East Photonic Sensor Market By Audience
12.5.2.9.3 Rest of Middle East Photonic Sensor Market By End Users
12.5.3 Africa
12.5.3.1 Africa Photonic Sensor Market by Country
12.5.3.2 Africa Photonic Sensor Market By Type
12.5.3.3 Africa Photonic Sensor Market By Audience
12.5.3.4 Africa Photonic Sensor Market By End Users
12.5.3.5 Nigeria
12.5.3.5.1 Nigeria Photonic Sensor Market By Type
12.5.3.5.2 Nigeria Photonic Sensor Market By Audience
12.5.3.5.3 Nigeria Photonic Sensor Market By End Users
12.5.3.6 South Africa
12.5.3.6.1 South Africa Photonic Sensor Market By Type
12.5.3.6.2 South Africa Photonic Sensor Market By Audience
12.5.3.6.3 South Africa Photonic Sensor Market By End Users
12.5.3.7 Rest of Africa
12.5.3.7.1 Rest of Africa Photonic Sensor Market By Type
12.5.3.7.2 Rest of Africa Photonic Sensor Market By Audience
12.5.3.7.3 Rest of Africa Photonic Sensor Market By End Users
12.6 Latin America
12.6.1 Trend Analysis
12.6.2 Latin America Photonic Sensor Market by country
12.6.3 Latin America Photonic Sensor Market By Type
12.6.4 Latin America Photonic Sensor Market By Audience
12.6.5 Latin America Photonic Sensor Market By End Users
12.6.6 Brazil
12.6.6.1 Brazil Photonic Sensor Market By Type
12.6.6.2 Brazil Photonic Sensor Market By Audience
12.6.6.3 Brazil Photonic Sensor Market By End Users
12.6.7 Argentina
12.6.7.1 Argentina Photonic Sensor Market By Type
12.6.7.2 Argentina Photonic Sensor Market By Audience
12.6.7.3 Argentina Photonic Sensor Market By End Users
12.6.8 Colombia
12.6.8.1 Colombia Photonic Sensor Market By Type
12.6.8.2 Colombia Photonic Sensor Market By Audience
12.6.8.3 Colombia Photonic Sensor Market By End Users
12.6.9 Rest of Latin America
12.6.9.1 Rest of Latin America Photonic Sensor Market By Type
12.6.9.2 Rest of Latin America Photonic Sensor Market By Audience
12.6.9.3 Rest of Latin America Photonic Sensor Market By End Users
13. Company Profiles
13.1 BK Technologies Corporation
13.1.1 Company Overview
13.1.2 Financial
13.1.3 Products/ Services Offered
13.1.4 SWOT Analysis
13.1.5 The SNS View
13.2 Hytera Communications Corporation Ltd
13.2.1 Company Overview
13.2.2 Financial
13.2.3 Products/ Services Offered
13.2.4 SWOT Analysis
13.2.5 The SNS View
13.3 Toshiba Corporation
13.3.1 Company Overview
13.3.2 Financial
13.3.3 Products/ Services Offered
13.3.4 SWOT Analysis
13.3.5 The SNS View
13.4 Prime Photonics
13.4.1 Company Overview
13.4.2 Financial
13.4.3 Products/ Services Offered
13.4.4 SWOT Analysis
13.4.5 The SNS View
13.5 Banpil Photonics, Inc
13.5.1 Company Overview
13.5.2 Financial
13.5.3 Products/ Services Offered
13.5.4 SWOT Analysis
13.5.5 The SNS View
13.6 L3 Harris
13.6.1 Company Overview
13.6.2 Financial
13.6.3 Products/ Services Offered
13.6.4 SWOT Analysis
13.6.5 The SNS View
13.7 Motorola Solutions
13.7.1 Company Overview
13.7.2 Financial
13.7.3 Products/ Services Offered
13.7.4 SWOT Analysis
13.7.5 The SNS View
13.8 omnisys - thales group
13.8.1 Company Overview
13.8.2 Financial
13.8.3 Products/ Services Offered
13.8.4 SWOT Analysis
13.8.5 The SNS View
13.9 General Electric Company
13.9.1 Company Overview
13.9.2 Financial
13.9.3 Products/ Services Offered
13.9.4 SWOT Analysis
13.9.5 The SNS View
13.10 NP Photonics
13.10.1 Company Overview
13.10.2 Financial
13.10.3 Products/ Services Offered
13.10.4 SWOT Analysis
13.10.5 The SNS View
13.11 Oxsensis
13.11.1 Company Overview
13.11.2 Financial
13.11.3 Products/ Services Offered
13.11.4 SWOT Analysis
13.11.5 The SNS View
13.12 BAE Systems plc
13.12.1 Company Overview
13.12.2 Financial
13.12.3 Products/ Services Offered
13.12.4 SWOT Analysis
13.12.5 The SNS View
13.13 General Dynamics Corporation
13.13.1 Company Overview
13.13.2 Financial
13.13.3 Products/ Services Offered
13.13.4 SWOT Analysis
13.13.5 The SNS View
13.14 ICOM Incorporation
13.14.1 Company Overview
13.14.2 Financial
13.14.3 Products/ Services Offered
13.14.4 SWOT Analysis
13.14.5 The SNS View
13.15 Samsung Electronics
13.15.1 Company Overview
13.15.2 Financial
13.15.3 Products/ Services Offered
13.15.4 SWOT Analysis
13.15.5 The SNS View
13.16 Leonardo S.R.L.
13.16.1 Company Overview
13.16.2 Financial
13.16.3 Products/ Services Offered
13.16.4 SWOT Analysis
13.16.5 The SNS View
13.17 MCS Digital
13.17.1 Company Overview
13.17.2 Financial
13.17.3 Products/ Services Offered
13.17.4 SWOT Analysis
13.17.5 The SNS View
13.18 Intevac
13.18.1 Company Overview
13.18.2 Financial
13.18.3 Products/ Services Offered
13.18.4 SWOT Analysis
13.18.5 The SNS View
13.19 Mitsubishi Electric Corporation
13.19.1 Company Overview
13.19.2 Financial
13.19.3 Products/ Services Offered
13.19.4 SWOT Analysis
13.19.5 The SNS View
14. Competitive Landscape
14.1 Competitive Benchmarking
14.2 Market Share Analysis
14.3 Recent Developments
14.3.1 Industry News
14.3.2 Company News
14.3.3 Mergers & Acquisitions
15. Use Case and Best Practices
16. Conclusion
An accurate research report requires proper strategizing as well as implementation. There are multiple factors involved in the completion of good and accurate research report and selecting the best methodology to compete the research is the toughest part. Since the research reports we provide play a crucial role in any company’s decision-making process, therefore we at SNS Insider always believe that we should choose the best method which gives us results closer to reality. This allows us to reach at a stage wherein we can provide our clients best and accurate investment to output ratio.
Each report that we prepare takes a timeframe of 350-400 business hours for production. Starting from the selection of titles through a couple of in-depth brain storming session to the final QC process before uploading our titles on our website we dedicate around 350 working hours. The titles are selected based on their current market cap and the foreseen CAGR and growth.
The 5 steps process:
Step 1: Secondary Research:
Secondary Research or Desk Research is as the name suggests is a research process wherein, we collect data through the readily available information. In this process we use various paid and unpaid databases which our team has access to and gather data through the same. This includes examining of listed companies’ annual reports, Journals, SEC filling etc. Apart from this our team has access to various associations across the globe across different industries. Lastly, we have exchange relationships with various university as well as individual libraries.

Step 2: Primary Research
When we talk about primary research, it is a type of study in which the researchers collect relevant data samples directly, rather than relying on previously collected data. This type of research is focused on gaining content specific facts that can be sued to solve specific problems. Since the collected data is fresh and first hand therefore it makes the study more accurate and genuine.
We at SNS Insider have divided Primary Research into 2 parts.
Part 1 wherein we interview the KOLs of major players as well as the upcoming ones across various geographic regions. This allows us to have their view over the market scenario and acts as an important tool to come closer to the accurate market numbers. As many as 45 paid and unpaid primary interviews are taken from both the demand and supply side of the industry to make sure we land at an accurate judgement and analysis of the market.
This step involves the triangulation of data wherein our team analyses the interview transcripts, online survey responses and observation of on filed participants. The below mentioned chart should give a better understanding of the part 1 of the primary interview.

Part 2: In this part of primary research the data collected via secondary research and the part 1 of the primary research is validated with the interviews from individual consultants and subject matter experts.
Consultants are those set of people who have at least 12 years of experience and expertise within the industry whereas Subject Matter Experts are those with at least 15 years of experience behind their back within the same space. The data with the help of two main processes i.e., FGDs (Focused Group Discussions) and IDs (Individual Discussions). This gives us a 3rd party nonbiased primary view of the market scenario making it a more dependable one while collation of the data pointers.
Step 3: Data Bank Validation
Once all the information is collected via primary and secondary sources, we run that information for data validation. At our intelligence centre our research heads track a lot of information related to the market which includes the quarterly reports, the daily stock prices, and other relevant information. Our data bank server gets updated every fortnight and that is how the information which we collected using our primary and secondary information is revalidated in real time.

Step 4: QA/QC Process
After all the data collection and validation our team does a final level of quality check and quality assurance to get rid of any unwanted or undesired mistakes. This might include but not limited to getting rid of the any typos, duplication of numbers or missing of any important information. The people involved in this process include technical content writers, research heads and graphics people. Once this process is completed the title gets uploader on our platform for our clients to read it.
Step 5: Final QC/QA Process:
This is the last process and comes when the client has ordered the study. In this process a final QA/QC is done before the study is emailed to the client. Since we believe in giving our clients a good experience of our research studies, therefore, to make sure that we do not lack at our end in any way humanly possible we do a final round of quality check and then dispatch the study to the client.
The Optical Transceiver market size was valued at USD 8.75 Billion in 2022 and is expected to grow to USD 27.33 Billion by 2030 and grow at a CAGR Of 15.3% over the forecast period of 2023-2030.
The Smart Display Market Size will be valued at USD 30.53 billion by 2031, and it was valued at USD 3.09 billion in 2023, and grow at a CAGR of 33.1% over the forecast period 2024-2031.
The Fault Detection and Classification Market size was valued at USD 4.5 billion in 2022 and is expected to grow to USD 9.03 billion by 2030 and grow at a CAGR of 9.1% over the forecast period of 2023-2030.
The Speech and Voice Recognition Market Size was valued at USD 12.63 billion in 2023, and expected to reach USD 73.84 billion by 2031 and grow at a CAGR of 24.7% over the forecast period 2024-2031.
The Display Technology Market size was valued at USD 125.5 Billion in 2022 and is expected to grow to USD 212.42897 Billion by 2030 and grow at a CAGR Of 6.8 % over the forecast period of 2023-2030.
The Virtual Sensors Market size was valued at USD 0.79 Billion in 2023 and is expected to grow to USD 7.1 Billion by 2031 and grow at a CAGR of 31.25 % over the forecast period of 2024-2031.

Hi! Click one of our member below to chat on Phone
© 2024 All Rights Reserved by SNS Insider Pvt Ltd