Photonic Sensor Market Size & Overview:
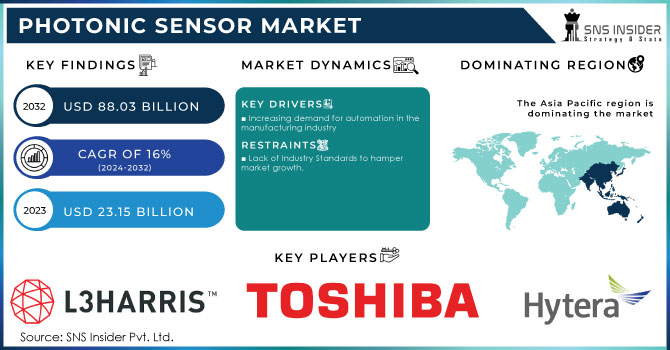
The Photonic Sensor Market was valued at USD 25.67 billion in 2023 and is expected to reach USD 77.99 billion by 2032, growing at a CAGR of 13.17% over the forecast period 2024-2032. Increased adoption of photonic sensing in industries such as automotive, healthcare, aerospace, and consumer electronics for high-accuracy and high-time resolution data is supporting the development of clear market opportunities for photonic sensors in the short term through increasing demand for these technologies. However, it is well known that reliability and performance metrics are essential, as industries utilize photonic sensors for high accuracy and durability in harsh environments. The use of sensors differs from use case to use case, with automotive (safety systems) and health care (diagnostics) sectors using them more frequently. Furthermore, the integration of photonic sensors with other technologies, including IoT devices and AI systems, is increasing the flexibility and range of photonic sensors for various applications.
Get more information on Photonic Sensor Market - Request Sample Report
Market Dynamics
Key Drivers:
-
Driving Forces Behind Photonic Sensor Market Growth in Automation Smart Manufacturing and Autonomous Vehicle Trends
Technological advancement and Growing Demand for high-precision & efficient sensors in various End-user industries are playing key drivers in the Photonic Sensor Market. The market is driven by the increase in automation along with the rising demands for real-time data and monitoring. Photonic sensors are growing in prominence within industries including healthcare, aerospace, and automotive applications due to the high-resolution imaging, fast response, and robustness offered. We know that the trend of smart manufacturing, autonomous vehicles, and increased deployment of IoT devices would also increase the market for photonic sensors.
Restrain:
-
Restrain in Photonic Sensor Design and Integration Hindering Broader Industry Adoption and Implementation
The complexity of both photonic sensor design and integration to existing systems translates to one of the primary determinants [that is limiting the] photonic sensor market. Creating sensors that are not only highly sensitive, but also efficient, stable, and durable, is technologically difficult and requires advanced materials and manufacturing methods. Additionally, due to the high skill required in photonics and optical technologies, this is only available to smaller amounts of specialized manufacturers and therefore does not allow for a larger amount of industry-wide implementation.
Opportunity:
-
Emerging Market Opportunities for Photonic Sensors in Healthcare 5G Telecom and Asia-Pacific Growth
Market opportunities exist for new, smaller, and cheaper sensor technologies. Along with various biophotonic and image sensor innovations, it can be promising for healthcare diagnostics, environmental monitoring & industrial applications. In addition, the growth of 5G and other beyond 5 G communication networks are finding new markets for photonic sensors, particularly in telco and data center environments. Photonic sensor solutions deliver better performance and enable a level of automation and operational efficiency that is the norm for industries in these emerging markets, resulting in significant adoption and strong growth in Asia-Pacific emerging markets.
Challenges:
-
Challenges from Competing Technologies and Harsh Environments Hindering Photonic Sensor Performance and Adoption
The other concern is the competition from alternative sensing technologies. Although photonic sensors yield high accuracy and sensitivity, other competing sensor technologies such as electronic or MEMS sensors, show similar functionalities at lower complexity and they can be beneficial for various applications. Also, in many industrial and automotive applications, temperature fluctuations, humidity, and vibrations affect sensor performance. These endeavors to solve these challenges necessitate ongoing development with new materials, design, and shielding methods, in addition to further understanding the challenges of making photonic sensors responsive to increasingly diverse, but harsher, environments.
Segment Analysis
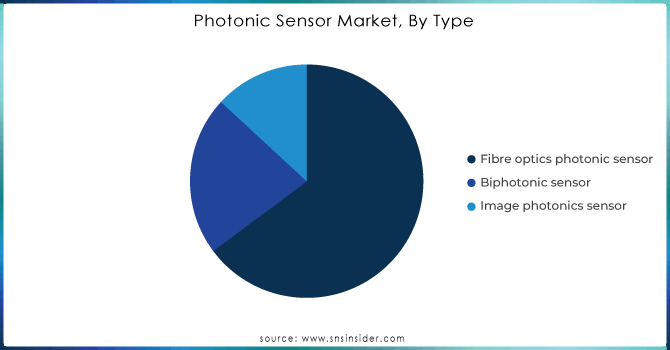
By Type
In 2023, image sensors retained the largest share of the overall photonic sensor market (41.2%) due to the high deployment of imaging systems in various applications including consumer electronics, automotive, healthcare, and security systems. This segment is growing due to the need for high-resolution imaging and advanced visual capabilities in smartphones, cameras, and autonomous vehicles. The precision and real-time information captured using image sensors render them an irreplaceable part of these applications where it is pertinent to work accurately and a reason for their market dominance for applications in medical diagnostics, industrial monitoring, etc.
Fiber Optic Sensors are expected to experience the fastest CAGR from 2024 to 2032, owing to unique benefits including high accuracy over extended range, high sensitivity, lack of electromagnetic interference, etc. With the increasing importance of reliable and efficient monitoring systems among end-use industries such as telecommunications, oil and gas, and power grids, the demand for these sensors will increase. Due to their prowess for extreme environment handling and continuous data-fed capabilities, they are among the most capable and quickly growing vertically for the highest number of our emerging applications for a few more years to come.
By End-use
The automotive sector accounted for 30.5% of the market share in 2023, due to the rising demand for ADAS, autonomous vehicles, and smart manufacturing technologies. Abstract Photonics has a major role in automotive applications, including LiDAR and optical cameras for enhanced vehicle safety and navigation to increase driving efficiency, resulting in the integration of many optical sensors on board cars today. Photonic sensor technologies in automotive had additional impetus from increased demand due to the growing electric vehicles (EVs) market and increased regulatory standards on vehicle safety and emissions.
The consumer electronics segment is expected to grow at the fastest CAGR from 2024 to 2032. Fueled by ongoing developments in smartphones, wearable technology, AR and other smart consumer gadgets that utilize significant amounts of photonic sensors including image sensors and proximity sensors. Consumer demand for more advanced, immersive, and low-power technologies will drive increased adoption of photonic sensors in consumer electronics, but growth is expected to gain momentum in the years ahead.
Get Customized Report as per your Business Requirement - Request For Customized Report
Regional Analysis
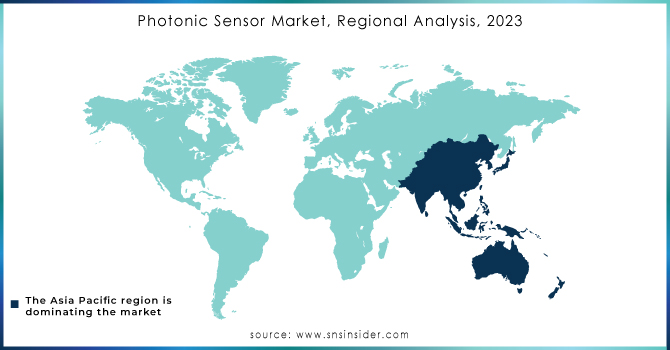
In 2023, North America captured a 35.4% share in the photonic sensors market, owing to the technological advancements in automotive, aerospace, healthcare, and consumer electronics. The strong local presence of key technology companies and research institutions, as well as a high adoption rate of emerging technologies, keep the region at the top of the global rankings. Take the automotive sector as an example, wherein auto manufacturers such as Tesla and General Motors are investing in photonic sensors for their autonomous vehicles, using LiDAR and other imaging technologies to assist with deterministic safe driving and navigation.
Asia Pacific is expected to grow at the fastest CAGR from 2024 to 2032. This boom is driven by rapid industrialization, technological progress, and the expansion of smart technology across industries. Photonic sensors are more prevalent in areas like telecommunications and consumer electronics in countries such as China and Japan. Examples include photonic sensors employed in state-of-the-art consumer electronics by corporations such as Huawei and Sony, or even their application in driverless cars the latter being pursued by Japan’s own Toyota Corporation.
Key players
Some of the major players in the Photonic Sensor Market are:
-
Honeywell (Fibre Optic Sensors, Laser Sensors)
-
Siemens (Optical Sensors, Photoelectric Sensors)
-
STMicroelectronics (Time-of-Flight (ToF) Sensors, Light Sensors)
-
Texas Instruments (Infrared Sensors, Optical Sensors)
-
Bosch (LIDAR Sensors, Light Sensors)
-
Analog Devices (Photodiodes, Light-to-Digital Sensors)
-
ams OSRAM (Ambient Light Sensors, Optical Sensors)
-
Keysight Technologies (Optical Power Sensors, Photodetectors)
-
Thorlabs (Optical Power Meters, Photodiodes)
-
Opto Diode (Photodiodes, Optical Sensors)
-
Edinburgh Instruments (Photoluminescence Sensors, UV Detectors)
-
Lumentum (Optical Sensors, LiDAR Sensors)
-
Murata Manufacturing (Ambient Light Sensors, Distance Sensors)
-
Vigo System (Photodiodes, Pyroelectric Detectors)
-
Hamamatsu Photonics (Photomultiplier Tubes, Light Sensors)
Recent Trends
-
In March 2024, Honeywell announced its acquisition of Civitanavi Systems, an Italian optical gyro specialist, for EURO 200 million.
-
In October 2024, Siemens extended its partnership with TSMC, enhancing collaboration on advanced semiconductor processes and certifications.
-
In July 2024, STMicroelectronics launched the VL53L4ED, a single-zone Time-of-Flight sensor with an extended operating temperature range of -40°C to 105°C, designed for industrial applications.
| Report Attributes | Details |
| Market Size in 2023 | USD 25.67 Billion |
| Market Size by 2032 | USD 77.99 Billion |
| CAGR | CAGR of 13.17% From 2024 to 2032 |
| Base Year | 2023 |
| Forecast Period | 2024-2032 |
| Historical Data | 2020-2022 |
| Report Scope & Coverage | Market Size, Segments Analysis, Competitive Landscape, Regional Analysis, DROC & SWOT Analysis, Forecast Outlook |
| Key Segments | • By Type (Fiber Optic Sensors, Image Sensors, Biophotonic Sensors) • By End use (Aerospace and Defense, Automotive, Consumer Electronics Source, Healthcare, Energy and Power, Others) |
| Regional Analysis/Coverage | North America (US, Canada, Mexico), Europe (Eastern Europe [Poland, Romania, Hungary, Turkey, Rest of Eastern Europe] Western Europe] Germany, France, UK, Italy, Spain, Netherlands, Switzerland, Austria, Rest of Western Europe]), Asia Pacific (China, India, Japan, South Korea, Vietnam, Singapore, Australia, Rest of Asia Pacific), Middle East & Africa (Middle East [UAE, Egypt, Saudi Arabia, Qatar, Rest of Middle East], Africa [Nigeria, South Africa, Rest of Africa], Latin America (Brazil, Argentina, Colombia, Rest of Latin America) |
| Company Profiles | Honeywell, Siemens, STMicroelectronics, Texas Instruments, Bosch, Analog Devices, ams OSRAM, Keysight Technologies, Thorlabs, Opto Diode, Edinburgh Instruments, Lumentum, Murata Manufacturing, Vigo System, Hamamatsu Photonics. |
Get in Touch
