Fault Detection and Classification Market Size
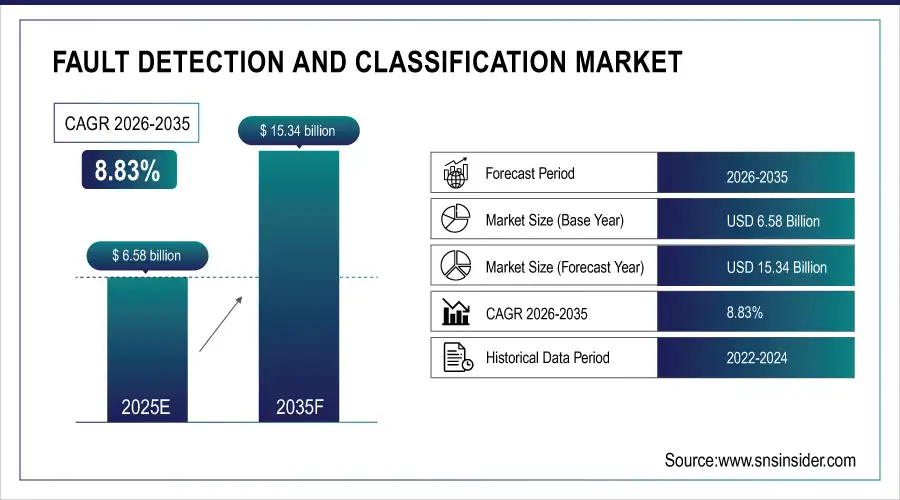
The Fault Detection and Classification Market size was valued at USD 6.58 billion in 2025 and is expected to grow to USD 15.34 billion by 2035 and grow at a CAGR of 8.83% over the forecast period of 2026-2035.
The growing focus on quality control is a crucial factor driving the growth of the Fault Detection and Classification (FDC) market, as it meets the urgent demand for providing top-notch products in a competitive setting. Currently, manufacturing, semiconductors, and oil and gas sectors are facing challenges to meet strict regulatory requirements and consumer demands, highlighting the importance of upholding product excellence. FDC systems are crucial in this situation as they use sensors, data analytics, and machine learning algorithms to identify abnormalities in manufacturing processes, thanks to their real-time monitoring abilities. By promptly identifying and categorizing errors, these systems assist organizations in quickly implementing corrections, thus mitigating the possibility of faulty products reaching the market. Reducing downtime and improving efficiency and consistency boosts brand reputation. The rise of FDC solutions is backed by the growing use of automation and smart manufacturing technologies, with AI-driven predictive maintenance and real-time analytics gaining importance.
Market Size and Forecast: 2025E
-
Market Size in 2025 USD 6.58 Billion
-
Market Size by 2035 USD 15.34 Billion
-
CAGR of 8.83% From 2026 to 2035
-
Base Year 2025
-
Forecast Period 2026-2035
-
Historical Data 2022-2024
Get E-PDF Sample Report on Fault Detection and Classification Market - Request Sample Report
Fault Detection and Classification Market Trends:
-
Increasing adoption of AI- and machine learning–based FDC platforms for real-time anomaly detection and predictive maintenance across high-precision manufacturing environments.
-
Integration of FDC systems with Industrial IoT (IIoT) sensors and edge computing to enable faster fault identification and localized decision-making on the factory floor.
-
Growing deployment of automated quality inspection and closed-loop process control systems to reduce scrap rates and improve yield in semiconductor and automotive manufacturing.
-
Rising demand for cloud-based and hybrid FDC solutions that support centralized monitoring, scalability, and cross-site manufacturing analytics.
-
Expansion of government-supported digital manufacturing and Industry 4.0 initiatives driving standardized adoption of advanced FDC technologies to meet stricter regulatory and quality compliance requirements.
The U.S. Fault Detection and Classification Market is projected to grow from USD 1.67 Billion in 2025. Growth is driven by increasing adoption of industrial automation, rising demand for predictive maintenance, integration of AI and machine learning in fault diagnostics, expansion of smart manufacturing and Industry 4.0 initiatives, and growing focus on operational efficiency, safety, and downtime reduction across industries.

Fault Detection and Classification Market Growth Drivers:
-
Automation-driven growth in Fault Detection and Classification (FDC) Market boosted by Quality Control improvements through Digital Transformation
The incorporation of automation in manufacturing plays a significant role in the expansion of the Fault Detection and Classification (FDC) market, as companies aim to increase efficiency, reduce errors, and improve quality control. Automation has converted many conventional manual processes into data-driven systems, reducing human participation in tasks related to inspection and fault detection. Businesses are utilizing advanced FDC technology to monitor production activities in real time, utilizing sensors, data analysis, and AI analytics to quickly identify and address potential problems. AI-powered FDC systems help to identify discrepancies more accurately than manual inspections, decreasing errors and improving overall product quality. These systems use machine learning algorithms to examine historical data, enabling proactive maintenance by identifying potential equipment issues ahead of time.
Fault Detection and Classification Market Restraints:
-
Obstacles that are impeding the growth of the Fault Detection and Classification (FDC) Market.
Despite the progress and practical use of Fault Detection and Classification (FDC) systems, various constraints in the market impede their widespread implementation. The high cost of implementation, especially for small- and medium-sized enterprises (SMEs), is a major hindrance. Implementing FDC systems entails a substantial financial commitment to hardware, including sensors, data acquisition devices, and computing infrastructure. Furthermore, companies with limited resources may face difficulties in acquiring a well-trained workforce necessary for implementing AI-driven analytics and machine learning models. The cost-conscious industries may face delays in adopting these systems due to the financial strain of upkeep and improvements.
Fault Detection and Classification Market Segment Analysis:
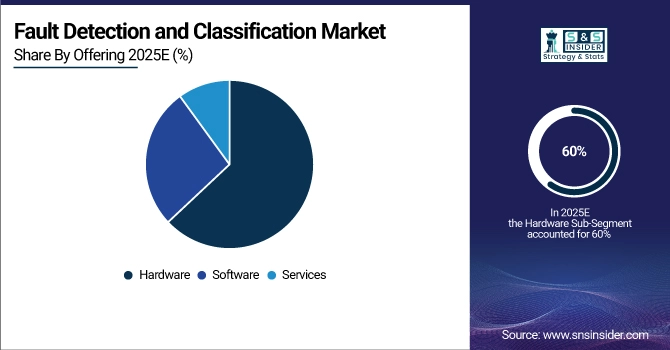
By Offering
Based on offering, Hardware has become the leading segment in the Fault Detection and Classification (FDC) market, accounting for 60% of total revenue in 2025E. This substantial percentage highlights the importance of tangible elements in fault detection systems such as sensors, controllers, and diagnostic tools. Hardware is essential for fault detection systems, as it plays a crucial role in supporting the monitoring, data acquisition, and real-time analysis of equipment performance. Sophisticated sensors, like the ones found in cars and factory equipment, are essential for identifying abnormalities and potential malfunctions through constant monitoring of factors such as temperature, vibration, and pressure. Controllers analyze the information from these sensors and use complex algorithms to identify issues and activate measures to prevent or fix them.
By End-User
In 2025, the Electronic and Semiconductor industry dominated the Fault Detection and Classification (FDC) market, holding a 31% market share. This importance highlights the sector's crucial requirement for advanced fault detection systems to uphold the reliability and performance of electronic devices and semiconductor manufacturing processes. The demand for advanced FDC solutions is fueled by the rising intricacy of electronic components and the precision needed in semiconductor manufacturing. Texas Instruments and Analog Devices are leading the market by providing advanced solutions to meet these specific needs. For instance, Texas Instruments' LMV321, a low-power op-amp, is created to boost the accuracy and dependability of fault detection setups by enhancing signal precision.
Fault Detection and Classification Market Regional Analysis:
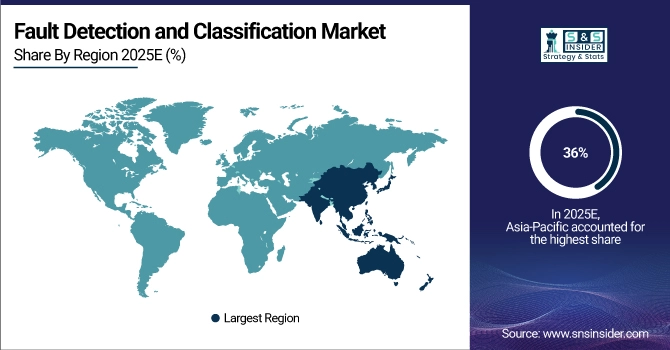
Asia Pacific Fault Detection and Classification Market Insights
In 2025, Asia-Pacific emerged as the top competitor in the Fault Detection and Classification (FDC) market, capturing a 36% share of revenue. The primary reasons for this control are the strong industrial sector in the area, fast technological progress, and growing funding in automation and smart technologies. Different manufacturing and industrial sectors such as automotive, electronics, and semiconductor industries can be found in the Asia-Pacific region. These sectors depend on advanced fault detection systems to maintain efficiency and reduce downtimes. China, Japan, and South Korea are leading in this trend by heavily investing in advanced manufacturing facilities and making progress in electronics and semiconductor technologies. For example, as China moves towards Industry 4.0 and smart manufacturing, the need for FDC systems is increasing as manufacturers seek to enhance production processes and quality control.
Get Customized Report as Per Your Business Requirement - Request For Customized Report
North America Fault Detection and Classification Market Insights
The FDC market in North America is witnessing fast growth as the second region, driven by notable technological progress and acceptance in numerous industries. The area's expansion is fueled by its strong industrial structure, a focus on innovation, and significant investment in automation and predictive maintenance technologies. Both the United States and Canada are promoting growth by more frequently implementing FDC systems to improve efficiency, reduce downtime, and guarantee safety. An instance of this is General Electric (GE) taking the lead in incorporating sophisticated fault detection technologies into its industrial machinery.
Europe Fault Detection and Classification Market Insights
The Europe Fault Detection and Classification market is driven by strong adoption of Industry 4.0, automation, and smart manufacturing across Germany, France, the U.K., and Italy. Strict regulatory standards in automotive, aerospace, and semiconductor industries are accelerating demand for advanced quality control systems. Government-backed digital transformation initiatives and investments in AI, IoT, and predictive maintenance technologies further support FDC adoption to enhance productivity, reduce downtime, and ensure compliance.
Latin America (LATAM) and Middle East & Africa (MEA) Fault Detection and Classification Market Insights
The LATAM and MEA FDC market is growing steadily as industries modernize manufacturing operations and improve operational efficiency. Expansion of automotive, oil & gas, mining, and industrial manufacturing sectors is increasing demand for automated fault detection systems. Government-led industrialization programs, rising adoption of smart factories, and investments in digital infrastructure are supporting the gradual deployment of FDC solutions across these emerging regions.
Fault Detection and Classification Market Key Players:
Some of the Fault Detection and Classification Market Companies are
- ADVANTEST CORPORATION (Automated Test Equipment, Fault Detection Systems)
- Amazon Web Services, Inc. (AWS IoT SiteWise, AWS Fault Injection Simulator)
- Applied Materials, Inc. (Producer™ Platform, Endura™ Platform for semiconductor manufacturing)
- CIM Environmental Pty Ltd. (CIMScan, Environmental Monitoring Systems)
- Cognex Corporation (In-Sight® Vision Systems, DataMan® Barcode Readers)
- einnoSys Technologies Inc. (Embedded Fault Detection Software)
- INFICON (ICS-5000® Intelligent Control System, UltraTrace® Gas Analyzers)
- KILI TECHNOLOGY (AI-Based Fault Detection Solutions)
- KLA Corporation (TeraScan™ for Semiconductor Defect Inspection, ICOS™ Series for Wafer Inspection)
- Microsoft (Azure IoT Central, Azure Monitor for Fault Detection)
- MobiDev (Custom Fault Detection Software Solutions)
- OMRON Corporation (Sysmac® Studio for Machine Vision and Fault Detection)
- Qualitas Technologies (Predictive Maintenance Solutions)
- SAMSUNG SDS (Samsung Smart Factory, IoT-based Fault Detection)
- Siemens AG (MindSphere® IoT Platform, SIMATIC® Machine Vision Systems)
- Synopsys, Inc. (DesignWare® IP for Fault Detection in Semiconductors)
- Teradyne Inc. (TestStation™ Automatic Test Equipment)
- Tokyo Electron Limited (Tactras™ for Semiconductor Inspection, ACT™ Series for Defect Detection)
Competitive Landscape for Fault Detection and Classification Market:
Samsung is a prominent player in the Fault Detection and Classification market through its Samsung SDS smart manufacturing and digital factory solutions. The company integrates AI, IoT, and advanced analytics to enable real-time fault detection, predictive maintenance, and process optimization. Samsung’s FDC capabilities support high-precision industries such as electronics, semiconductors, and automotive manufacturing, helping organizations enhance quality control, reduce downtime, and improve overall operational efficiency.
-
In March 2023, Samsung SDS launched an AI-powered FDC solution for transportation. The solution is designed to help transportation companies detect and classify faults in vehicles & infrastructure, improving safety and efficiency.
Synopsys, Inc. is a key contributor to the Fault Detection and Classification market, particularly within semiconductor design and manufacturing environments. The company provides advanced EDA tools, design analytics, and AI-driven solutions that support defect detection, process monitoring, and yield optimization. Synopsys’ technologies enable early fault identification, predictive analysis, and compliance with stringent quality standards across complex, high-volume semiconductor production operations.
-
In August 2023, Synopsys, Inc. launched Synopsys Software Risk Manager, a powerful new application security posture management (ASPM) solution. Software Risk Manager enables security and development teams to simplify, align and streamline their application security testing across projects, teams and application security testing (AST) tools.
Teledyne Technologies is an important participant in the Fault Detection and Classification market through its advanced sensing, imaging, and instrumentation solutions. The company supports real-time fault detection, condition monitoring, and quality assurance across aerospace, industrial manufacturing, energy, and defense sectors. Teledyne’s high-precision sensors, machine vision systems, and analytics-driven platforms help manufacturers improve reliability, reduce unplanned downtime, and maintain strict operational and safety standards.
-
On March 7, 2024, FLIR, a Teledyne Technologies company, launched the Si2-Series acoustic imaging cameras, including the Si2-Pro, Si2-LD, and Si2-PD, designed to detect air and gas leaks, mechanical faults, and partial discharges. These industrial-grade cameras feature enhanced image quality, increased sensitivity, and longer battery life, making them top performers for fault detection.
| Report Attributes | Details |
|---|---|
| Market Size in 2025 | USD 6.58 Billion |
| Market Size by 2035 | USD 15.34 Billion |
| CAGR | CAGR of 8.83% From 2026 to 2035 |
| Base Year | 2025 |
| Forecast Period | 2026-2035 |
| Historical Data | 2022-2024 |
| Report Scope & Coverage | Market Size, Segments Analysis, Competitive Landscape, Regional Analysis, DROC & SWOT Analysis, Forecast Outlook |
| Key Segments |
|
| Regional Analysis/Coverage | North America (US, Canada), Europe (Germany, UK, France, Italy, Spain, Russia, Poland, Rest of Europe), Asia Pacific (China, India, Japan, South Korea, Australia, ASEAN Countries, Rest of Asia Pacific), Middle East & Africa (UAE, Saudi Arabia, Qatar, South Africa, Rest of Middle East & Africa), Latin America (Brazil, Argentina, Mexico, Colombia, Rest of Latin America). |
| Company Profiles | Advantest Corporation, Amazon Web Services, Inc., Applied Materials, Inc., CIM Environmental Pty Ltd., Cognex Corporation, einnoSys Technologies Inc., INFICON, KILI Technology, KLA Corporation, Microsoft, MobiDev, OMRON Corporation, Qualitas Technologies, Samsung SDS, Siemens AG, Synopsys, Inc., Teradyne Inc., Tokyo Electron Limited. |
Frequently Asked Questions
The Fault Detection and Classification Market grow at a CAGR of 8.83% over the forecast period of 2026-2035.
The Fault Detection and Classification Market size was valued at USD 6.58 billion in 2025 and is expected to grow to USD 15.34 billion by 2035 and grow at a CAGR of 8.83% over the forecast period of 2026-2035.
The major growth factor of the Fault Detection and Classification Market is the increasing adoption of advanced technologies like AI and machine learning for predictive maintenance and real-time monitoring.
The Hardware segment dominated the Fault Detection and Classification Market.
Asia-Pacific dominated the Fault Detection and Classification Market in 2025.
Get in Touch
