Plant-based Bars Market Report Scope & Overview:
Get More Information on Plant-based Bars Market - Request Sample Report
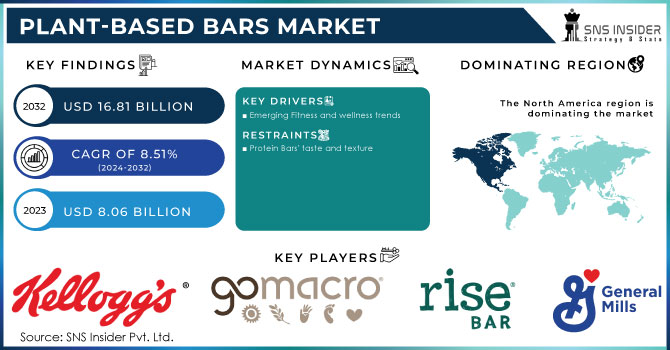
The Plant-based Bars Market size was USD 8.06 billion in 2023 and is expected to Reach USD 16.81 billion by 2032 and grow at a CAGR of 8.51% by 2024-2032.
The market for plant-based bars is growing due to an increase in consumer demand for plant-based food items, particularly bars. Consumers embracing plant-based or vegan diets, people who are health-conscious, and people looking for substitutes for conventional snack bars are the main drivers of this demand.
Plant-based protein bars had a market share of more than 35.5% in 2023. Plant-based diets have grown in popularity in recent years, with many people choosing for a more plant-based, vegan lifestyle. As a result, there is a higher need for plant-based protein sources, such as plant-based protein bars. Many manufacturers are now responding to this need by developing a wide range of plant-based protein bars that are both delicious and nutritious. However, as food technology and production have advanced, many plant-based protein bars nowadays taste and feel equally as wonderful as typical snack bars. As a result, as a tasty and nutritious snack alternative, more consumers are turning to plant-based protein bars. Protein bars have a high protein to carbohydrate and fat ratio.
MARKET DYNAMICS
KEY DRIVERS
-
Emerging Fitness and wellness trends
Consumers have grown more health-conscious, and they are looking for healthier snack options that fit their dietary and lifestyle preferences. Because they are often manufactured with whole-food components and are free of artificial flavors, colors, and preservatives, plant-based bars are considered as a healthier alternative to standard snack bars. Plant-based bars are also an excellent source of plant-based protein, which is gaining popularity among consumers. People who follow a plant-based or flexitarian diet are looking for easy and pleasant methods to add more plant-based protein to their diets. Plant-based bars provide consumers an easy and convenient method to meet their protein demands while enjoying a tasty snack.
RESTRAIN
-
Protein Bars' taste and texture
Taste and texture are possible market limitations for plant-based bars, as some customers may find the bars to taste and feel different than standard snack bars. Many protein bars are manufactured using whole-food ingredients, which can have an impact on their taste and texture. While some customers may appreciate this texture, others may dislike it. Similarly, some consumers may find that protein bars have a distinct flavor profile than regular snack bars, particularly if they are unfamiliar with the flavors of whole food ingredients.
OPPORTUNITY
-
Market efforts for vegan restaurants and an increase in vegan population
Protein bars manufactured with pea protein, soy protein, and brown rice protein are a handy solution for people to achieve their protein demands without consuming animal products. Plant-based protein bars are frequently touted as a healthier alternative to standard protein bars because they contain less saturated fat and cholesterol and can include additional nutrients including fiber, vitamins, and minerals. Key players are running attempts to raise awareness of vegan protein bars, which will help the plant-based bar business. Furthermore, as the prevalence of food allergies rises, customers are substituting plant-based alternatives for dairy and animal products, driving the market.
CHALLENGES
-
High cost and a wide range of substitutes
Plant-derived components are frequently more expensive than animal-derived products. This is due to a variety of causes, including greater production costs, a smaller market for plant-based products, and a lack of government subsidies for plant-based agriculture. Consumers have a variety of additional snack options, many of which are less expensive than plant-based bars.
IMPACT OF RUSSIA-UKRAINE WAR
The Russia-Ukraine conflict has had an influence on the plant-based bar business. Russia imports a significant amount of fresh and processed fruits and vegetables. Ukraine is a significantly smaller market. The battle has hampered the supply of sunflower oil, a common ingredient in plant-based bars. Some plant-based products, such as soy and wheat, have also become scarce as a result of the war. The global market for protein bars alone is expected to reach $7 billion by 2027. However, the supply of fruits, nuts, and other materials is less disrupted. It has had an impact on the availability and affordability of plant-based bars in several markets.
IMPACT OF ONGOING RECESSION
Snacks, convenience foods, protein bars, and other goods have seen price increases as a result of the recession. Wheat gluten, another key ingredient in plant-based snacks, has climbed by 15% since the war began. Companies may be pushed to decrease pricing or give discounts as they compete for a smaller pool of consumers, reducing the profitability of the plant-based bar business. People's consumption habits have been affected by the recession. People choose to eat less expensive and more nutritious snacks and meals.
MARKET SEGMENTATION
By Product
-
Cereal/Granola Bars
-
Protein Bars
-
Energy Bars/ Meal Replacement Bars
-
Fruits & Nuts Bars
-
Others
By Distribution Channel
-
Hypermarkets & Supermarkets
-
Convenience Stores
-
Specialty Stores
-
Online
-
Others
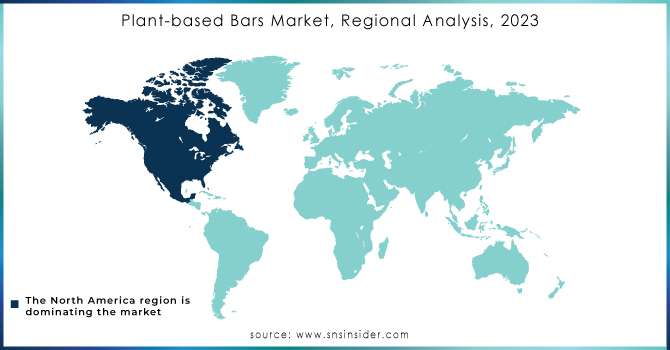
REGIONAL ANALYSIS
North American region dominated the plant-based bars market due to its busy lifestyle led to plant-based protein bars. The U.S., Canada, and other countries are major contributors to protein bars. This is due to customer desire to consume fewer meat-based foods overall and more plant-based foods, particularly plant-based bars, as a more healthful snack option. As a result, more Americans are choosing to eat meals that are made from plants.
Asia Pacific regional market is fast growing at a CAGR of 15.9% over the forecast period. In many Asian countries, including India, where vegan and vegetarian diets are connected to religious or cultural practices, there is a sizable and expanding number of vegetarians and vegans. As a result, there is a high demand for plant-based goods among these groups, such as plant-based protein bars, which serve as nutritional supplements. Due to this, people in the area who care about their health have an increased need for these products.
Europe represented more than 34.9% of the market in 2023. Consumers in the region are opting to consume fewer animal products and more plant-based alternatives, such as plant-based protein bars. Many supermarkets and health food stores now sell a wide variety of plant-based bars, making it easier for consumers to identify and purchase these items. Furthermore, there is an increasing trend in Europe toward veganism and vegetarianism. The top three users of plant-based protein ingredients are the United Kingdom, Germany, and France.
The Middle East and Africa, as well as South America, are relatively small and developing slowly, although this is expected to change in the coming years. Factors such as increased product availability, an increasing distribution channel, and the amalgamation of various regional brands operating at reasonable unit pricing are likely to boost total sales of plant-based bars.
Get Customized Report as per Your Business Requirement - Request For Customized Report
REGIONAL COVERAGE
North America
-
US
-
Canada
-
Mexico
Europe
-
Eastern Europe
-
Poland
-
Romania
-
Hungary
-
Turkey
-
Rest of Eastern Europe
-
-
Western Europe
-
Germany
-
France
-
UK
-
Italy
-
Spain
-
Netherlands
-
Switzerland
-
Austria
-
Rest of Western Europe
-
Asia Pacific
-
China
-
India
-
Japan
-
South Korea
-
Vietnam
-
Singapore
-
Australia
-
Rest of Asia Pacific
Middle East & Africa
-
Middle East
-
UAE
-
Egypt
-
Saudi Arabia
-
Qatar
-
Rest of Middle East
-
-
Africa
-
Nigeria
-
South Africa
-
Rest of Africa
-
Latin America
-
Brazil
-
Argentina
-
Colombia
-
Rest of Latin America
KEY PLAYERS
Some major key players in the Plant-based Bars Market are Kellogg's, Greens Gone Wild, LLC., GoMacro, LLC, 88 ACRES, Rise Bar, Clif Bar & Company, Växa Bars, General Mills Inc., MadeGood, GNC Holdings, LLC, SternLife, LoveRaw, GNC Holdings LLC, and other key players.
RECENT DEVELOPMENTS
In 2023, Bobo's released a new line of protein bars that include 15 grams of protein and are made with clean and simple ingredients. There are two kinds of protein bars: chocolate chip peanut butter and double chocolate almond butter. These new protein bars are also gluten-free, kosher, and non-GMO.
In 2022, SternLife, a prominent distributor of functional food, created four vegan bars. These items are becoming more popular in response to consumer demand for environmentally friendly products.
In 2022, Australian Plant Protein began an initiative to increase South Australia's animal-free protein manufacturing capabilities.
| Report Attributes | Details |
| Market Size in 2023 | US$ 8.06 Billion |
| Market Size by 2032 | US$ 16.81 Billion |
| CAGR | CAGR of 8.51 % From 2024 to 2032 |
| Base Year | 2023 |
| Forecast Period | 2024-2032 |
| Historical Data | 2020-2022 |
| Report Scope & Coverage | Market Size, Segments Analysis, Competitive Landscape, Regional Analysis, DROC & SWOT Analysis, Forecast Outlook |
| Key Segments | • By Product (Cereal/Granola Bars, Protein Bars, Energy Bars/ Meal Replacements Bars, Fruits & Nuts Bars, and others) • By Distribution Channel (Hypermarkets and supermarkets, Convenience Stores, Specialty Stores, Online, Others) |
| Regional Analysis/Coverage | North America (US, Canada, Mexico), Europe (Eastern Europe [Poland, Romania, Hungary, Turkey, Rest of Eastern Europe] Western Europe] Germany, France, UK, Italy, Spain, Netherlands, Switzerland, Austria, Rest of Western Europe]), Asia Pacific (China, India, Japan, South Korea, Vietnam, Singapore, Australia, Rest of Asia Pacific), Middle East & Africa (Middle East [UAE, Egypt, Saudi Arabia, Qatar, Rest of Middle East], Africa [Nigeria, South Africa, Rest of Africa], Latin America (Brazil, Argentina, Colombia Rest of Latin America) |
| Company Profiles | Kellogg's, Greens Gone Wild, LLC., GoMacro, LLC, 88 ACRES, Rise Bar, Clif Bar & Company, Växa Bars, General Mills Inc., MadeGood, GNC Holdings, LLC, SternLife, LoveRaw, GNC Holdings LLC |
| Key Drivers | • Emerging Fitness and wellness trends |
| Market Opportunity | • Market efforts for vegan restaurants and an increase in vegan population |
Frequently Asked Questions
Ans: Asia Pacific is fast-growing region for the Plant-based Bars Market in 2023.
Ans: Plant-based Bars Market size was valued at USD 8.06 billion in 2023
Ans: High cost and a wide range of substitutes for plant-based bars are challenges
Ans: Market efforts for vegan restaurants and an increase in the vegan population are Opportunities for the growth of the market
Ans: Plant-based Bars Market is anticipated to expand by 8.51% from 2023 to 2030.
Get in Touch
