Plant-Based Shrimp Market Report Scope & Overview:

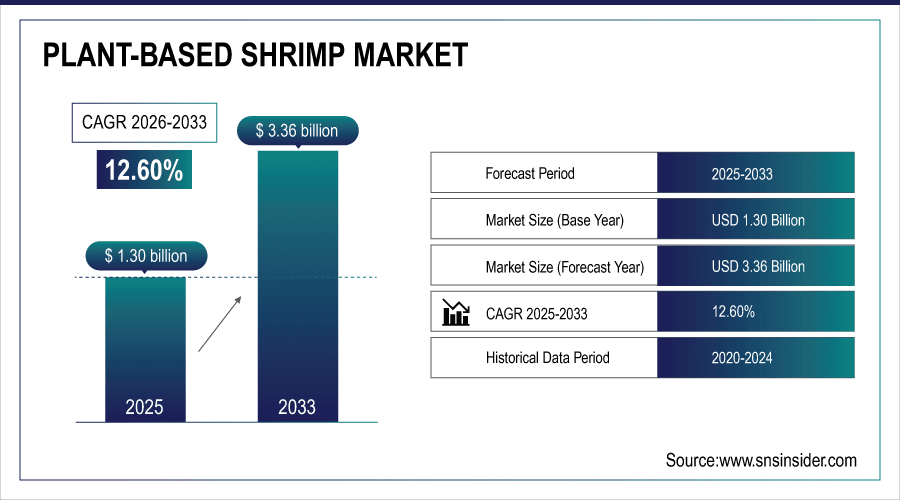
The Plant-Based Shrimp Market size was valued at USD 1.30 Billion in 2025E and is projected to reach USD 3.36 Billion by 2033, growing at a CAGR of 12.60% during 2026-2033.

The Plant-Based Shrimp Market is expanding due to the rising adoption of electric vehicles and automation across industries. Increasing demand for energy-efficient motors in automotive, aerospace, and industrial applications drives growth. Advancements in AI- and IoT-enabled testing solutions enhance accuracy, reliability, and predictive maintenance capabilities. Supportive regulations and sustainability goals further boost the adoption of advanced motor testing equipment globally.

Over 40% of consumers globally identify as flexitarian, fueling higher adoption of plant-based seafood formats like shrimp.

Plant-Based Shrimp Market Trends

  • Growing health consciousness and concerns over overfishing are increasing demand for cholesterol-free, low-fat plant-based shrimp.

  • Consumers following flexitarian diets prefer familiar seafood formats without sustainability issues, supported by ready-to-eat and convenient options.

  • Social media influence, recipe trends, and menu placements in quick-service and casual dining outlets are boosting trial.

  • High seafood consumption regions with limited wild-capture fisheries present strong opportunities for plant-based shrimp exports.

  • Retailers launching private-label products at competitive prices help secure higher-volume contracts for manufacturers.

  • Strategic B2B collaborations, co-branding, and white-labeling accelerate market entry and expand global revenue potential.

U.S. Plant-Based Shrimp Market Insights

The U.S. Plant-Based Shrimp Market size was valued at USD 0.36 Billion in 2025E and is projected to reach USD 0.79 Billion by 2033, growing at a CAGR of 10.37% during 2026-2033. 
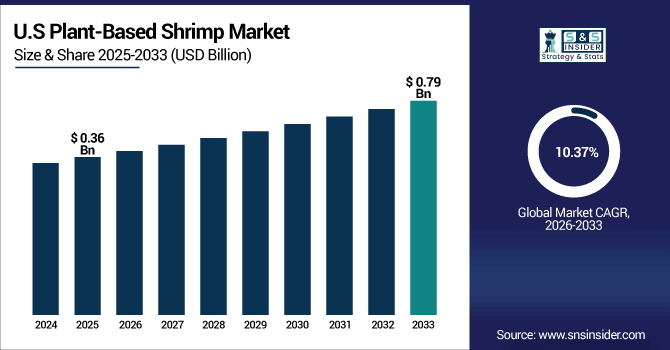
The U.S. market growth is supported by the increasing demand of consumers for sustainable and healthy protein options, and by expanded distribution across retail and foodservice outlets. With ongoing innovations in texture and flavor plant-based shrimp are becoming more appealing to the mainstream consumer. In addition, private-label launches and the partnerships between start-ups and large food manufacturers increase the production scale, decrease production costs, and improve feasibility. Together, they help expand market reach and enable faster adoption in both household and commercial channels.

Plant-Based Shrimp Market Growth Drivers:

  • Rising Consumer Demand for Sustainable, High-Protein, Meatless Seafood Alternatives Driven by Health and Environmental Concerns and Increasingly Convenient Ready-to-Eat Options

Increasing health consciousness as well as growing apprehensions regarding overfishing led proliferation of plant-based seafood amongst the customers owing to cholesterol-free, lesser-saturated-fat protein creativity. Plant-based shrimp appeals to flexitarian diets as consumers want their old favorite sea formats without the sustainability baggage. The ready-to-eat and convenience formats are expanding their appeal among busy households. The rise of social media and influencer-led recipe trends, as well as increasing quick-service and casual-dining menu placements, drive trial. This union of health, ethics, and ease are growing the addressable market and driving investment in R&D and greater retail distribution.

Over 40% of consumers globally identified as flexitarian in 2025, driving adoption of plant-based seafood alternatives such as shrimp.

Plant-Based Shrimp Market Restraints:

  • High Production Costs and Limited Economies of Scale Increase Price Premiums Making Mass Adoption Among Price-Sensitive Consumers Challenging in Markets

Today, the sourcing of ingredients, the specialized processing (texturization, flavor encapsulation) and the limited scale of manufacturing all conspire to keep the unit costs to result in cost-effective substitutes being higher than conventional shrimp, producing a retail premium. The slow repeat purchases stem from price-conscious markets where consumers rule out sustainability claims in favor of seeking out the lowest price point. Pockets of manufacturing capability and supply of functional plant proteins and seaweed flavors are fragile, leading to variability in cost and quality. Price promotions can drive trial, but for smaller producers can also hurt margins. Higher prices are a continued key barrier to faster penetration into mainstream and emerging markets until scale benefits, ingredient cost reductions, and process efficiencies are realized.

Plant-Based Shrimp Market Opportunities:

  • Growing Consumer Interest in Sustainable Seafood Alternatives Opens Export and Private-Label Opportunities for Manufacturers Targeting Health-Conscious Markets and Foodservice Partnerships

Demand from both the environmentally and ethically conscious consumers and institutional buyers (hotels, airlines, catering) creates good space for export-oriented growth and scale. Private-label plant-based seafood that holds retail shoppers wanting sustainability credentials at competitive prices is the ticket to higher-volume contracts for manufacturers. These markets, where wild-capture fisheries are limited but seafood consumption is high, are therefore, good opportunities for manufactured plant-based shrimp exports. In combination with foodservice pilots and menu rollouts, manufacturers have an opportunity for repeat large-scale orders that will encourage capacity growth. In addition, strategic B2B partnerships enable co-branding and white-labeling, which shortens time to market entry in international markets and generates revenue well beyond direct-to-consumer sales.

Over 55% of global shrimp exports come from regions facing sustainability concerns, making plant-based options attractive for import-driven markets.

Plant-Based Shrimp Market Segment Analysis

  • By Source, Soy Protein led the Plant-Based Shrimp Market with a 32.84% share in 2025E, while Pea Protein is the fastest-growing segment with a CAGR of 17.33%.

  • By Product Type, the Breaded Vegan Shrimp sector dominated the market with 41.62% share in 2025E, whereas the Raw Vegan Shrimp segment is expected to grow fastest with a CAGR of 16.38%.

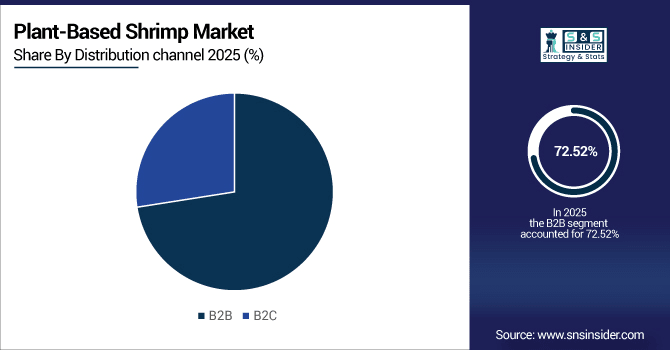
  • By Distribution Channel, B2B led the market with 72.52% share in 2025E, while B2C is registering the fastest growth with a CAGR of 14.61%.

  • By End-User, Food Service Industry held 48.36% share in 2025E, while Household is growing the fastest with a CAGR of 17.10%.

By Source, Soy Protein Leads Market While Pea Protein Registers Fastest Growth

The Plant-Based Shrimp Market was led by Soy Protein segment possessing the highest revenue share of 32.84% in 2025E owing to cost-effectiveness, established supply chains, and proven performance and vast texturization opportunities. Soy is a widely used base ingredient; companies such as Impossible Foods use it to imitate shrimp-like textures at scale. In contrast, the Pea Protein segment is projected to register the highest CAGR of 17.33% during the forecast period 2026–2033 due to its bland taste, hypoallergenic properties, and clean-label perception which appeal to health-centric consumers.

By Product Type, Breaded Vegan Shrimp Dominate While Raw Vegan Shrimp Shows Rapid Growth

The Breaded Vegan Shrimp segment captured the largest revenue share of approximately 41.62% in 2025E owing to its familiarity, convenience, and high penetration of frozen and foodservice formats. Options that are playing well into the breaded variety for typical consumers & restaurants are what companies like New Wave Foods are targeting. However, the fastest-growing segment is the Raw Vegan Shrimp, with the highest CAGR of 16.38% during the forecast period of 2026–2033 as texturization and flavor innovation opens the door for raw-style formats ideal for sushi and premium dishes.

By Distribution Channel, B2B Lead While B2C Registers Fastest Growth

The Plant-Based Shrimp Market was led by the B2B segment, with approximately 72.52% of sales revenue in 2025E, as bulk orders for restaurants, caterers and quick-service chains drive demand. Collaborations with distributors, such as Sysco Corporation, enable large scale availability to foodservice operators. Conversely, the B2C segment is projected to register the highest growth between 2026–2033, with the fastest CAGR of 14.61% fueled by growth in supermarket listings, private-label launches, and DTC e-commerce, making plant-based shrimp more accessible for homes looking for sustainable substitutes.

By End-User, Food Service Industry Lead While Household Grow Fastest

The Food Service Industry segment dominated the Plant-Based Shrimp Market and generated the highest revenue share of about 48.36% in 2025E owing to the tremendous purchases in bulk by restaurants and cafeterias as they are pioneers in the menu innovation. Nestlé Professional has introduced new plant-based seafood lines to tap into rising demand for these products in foodservice channels. Among them, the Household segment is expected to witness the highest growth rate (CAGR) of 17.10% during 2026–2033, owing to the rise in retail penetration for frozen convenience products and the growing interest among consumers in cooking sustainable shrimp substitutes at home.

Plant-Based Shrimp Market Regional Analysis:

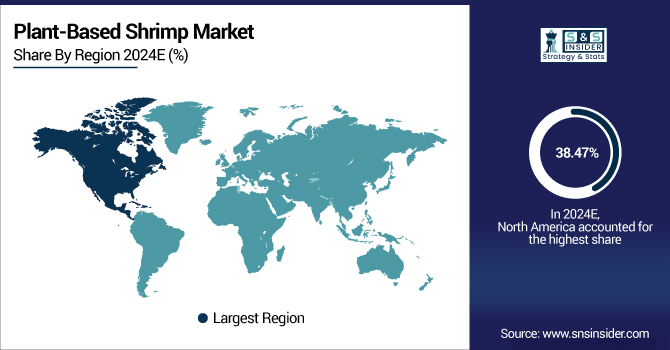
North America Plant-Based Shrimp Market Insights

In 2024E, North America region accounted for the highest revenue share of the Plant-Based Shrimp Market, which is approximately 38.47% due to strong consumer awareness towards sustainability and health, well-established retail infrastructure, innovative startup ecosystems, and favorable support from investors that bolster product development and distribution sales. Both the U.S. and Canada have plant-based supply chains in place, large-scale foodservice trials, and private-label adoption in addition to regulatory environments that enable the commercialization of alternative protein products.

U.S. Plant-Based Shrimp Market Insights

U.S. itself dominates the North America plant-based shrimp market on account of extensive consumer awareness, developed retail infrastructure, and active foodservice partnership. All of this is bolstered by substantial startup and corporate food company investment, innovation, national distribution, and widespread adoption.

Asia-Pacific Plant-Based Shrimp Market Insights

Asia Pacific segment will rise at highest CAGR of nearly 16.72% in between 2026–2033 owing to growing disposable income, increasing penetration of retail, strong culinary tradition which prefers seafood make the region favorable market. The adoption of edible insects is driven by urbanization, greater awareness of health issues, as well as the need to find sustainable alternatives to protein sources in countries such as China, Japan, South Korea, and Southeast Asia.

China Plant-Based Shrimp Market Insights

China occupies the highest share in the Asia Pacific plant-based shrimp market due to the highest consumption of seafood along with the rapid urbanization and rising population starting to shift towards healthy oriented habits. Great domestic startups, increasing retail channel and supportive government in terms of sustainable food alternative all facilitate China taking the lead.

Europe Plant-Based Shrimp Market Insights

Europe accounts for a large portion of the Plant-Based Shrimp Market, backed by high preference towards sustainable seafood alternatives backed by friendly government regulations and the growing flexitarin population. Germany, the U.K., and the Netherlands are some leading adopters, driven by retail expansions and foodservice innovations. As a result, growing investments toward R&D and clean-label products will further contribute to the regional market growth.

Germany Plant-Based Shrimp Market Insights

Germany is the leading country in Europe for plant-based shrimp due, in part, to its large population of vegans and flexitarians, optimized retail penetration and high consumer awareness surrounding sustainable food purchasing. Startups and international brands are actively launching plant-based seafood alternatives across supermarkets, specialty stores, and foodservice channels, making the country also a pioneer in product innovation.

Latin America (LATAM) and Middle East & Africa (MEA) Plant-Based Shrimp Market Insights

In the Middle East & Africa, the plant-based shrimp market is growing as more consumers embrace a healthier lifestyle and the products are being increasingly embraced in the UAE and Saudi Arabia, alongside a rising focus on foodservice in South Africa and Qatar. Brazil and Argentina drive most of demand in Latin America, underpinned by sustainability trends, retail expansion and growing flexitarian consumers.

Plant-Based Shrimp Market Competitive Landscape:

New Wave Foods is a plant-based seafood start-up focused on sustainable shrimp made from seaweed and plant proteins. It boasts a Plant-Based Breaded Shrimp that mimics a crunchy texture traditionally used in foodservice and retail frozen aisles and a Plant-Based Raw Shrimp that promises to replicate authentic taste and bite and can be used in a variety of dishes ranging from stir-fry to sushi. The company partners with distributors such as Sysco to reach scale, which will hopefully further the world’s transition to sustainable seafood.

  • In February 2024, New Wave Foods officially ceased operations, entering an assignment for the benefit of creditors after closing in November 2023.

Good Catch Foods, a US-based company developing its unique plant-grown sea food seasoned with a 6 legume protein blend. The Plant-Based Breaded Shrimp delivers a hearty crunch with marine-inspired taste, perfect for quick-service restaurants and home kitchens. In the meantime, its Plant-Based Fish-Free Tuna offers an adaptable, protein-rich substitute that is ideal for salads, sandwiches, or sushi rolls. Good Catch encourages a firm retail and foodservice presence by focusing on clean-label, allergen-friendly products which still aid global ocean conservation.

  • In July 2025, the company secured over $32 million in Series B funding aimed at expanding distribution across North America, Europe, and Asia.

Sophie’s Kitchen has found its niche in allergen-free plant-based seafood by prioritizing the use of soy-free and gluten-free ingredients. Plant-Based Breaded Shrimp that is crunchy and mimics traditional shrimp, making it perfect for flexitarians and households. Elsewhere its Plant-Based Smoked Salmon delivers deep, smoky flavors created for bagels and sushi or as an appetizer. Available through major retail chains and e-commerce platforms, Sophie’s Kitchen leads the way in seafood innovation by targeting health-oriented consumers looking for a combination of sustainability along with the familiar taste of seafood products.

  • In April 2025, Sophie’s Kitchen introduced an improved pea protein–based canned “Plant-Based Toona” in Sea Salt and Black Pepper flavors, now available on Amazon and in retailers like Stop & Shop and Wegman’s.

Plant-Based Shrimp Market Key Players:

Some of the Plant-Based Shrimp Market Companies are: 

  • Beyond Meat, Inc.

  • Gathered Foods Corp.

  • Maple Leaf Foods, Inc.

  • Finless Foods

  • Ocean Hunger Foods

  • The Vegetarian Butcher

  • The Kraft Heinz Co.

  • Moving Mountains Foods

  • Monde Nissin Corp.

  • Tyson Foods, Inc.

  • Impossible Foods Inc.

  • Van Cleve Seafood

  • Good Catch

  • The Tofurky Co. Inc.

  • New Wave Foods

  • Sophie’s Kitchen

  • Plantish

  • Aqua Cultured Foods

  • Vegan Zeastar

  • OmniFoods

Plant-Based Shrimp Market Report Scope:

Report Attributes Details
Market Size in 2025 USD 1.30 Billion 
Market Size by 2033 USD 3.36 Billion 
CAGR CAGR of 12.6% From 2026 to 2033
Base Year 2025
Forecast Period 2026-2033
Historical Data 2022-2024
Report Scope & Coverage Market Size, Segments Analysis, Competitive Landscape, Regional Analysis, DROC & SWOT Analysis, Forecast Outlook
Key Segments • By Source (Seaweed, Legume Protein, Plant-based omega-3, Soy Protein, Pea Protein, Others [quinoa, oats, beans, and seeds])
• By Product Type (Breaded Vegan Shrimp, Crunchy Coconut Shrimp, Crispy Vegan Shrimp, Raw Vegan Shrimp)
• By Distribution Channel (B2B, B2C [Store-based Retailing, Online Retailing])
• By End-Use (Food Service Industry, Household, Retail)
Regional Analysis/Coverage North America (US, Canada), Europe (Germany, UK, France, Italy, Spain, Russia, Poland, Rest of Europe), Asia Pacific (China, India, Japan, South Korea, Australia, ASEAN Countries, Rest of Asia Pacific), Middle East & Africa (UAE, Saudi Arabia, Qatar, South Africa, Rest of Middle East & Africa), Latin America (Brazil, Argentina, Mexico, Colombia, Rest of Latin America).
Company Profiles Beyond Meat, Inc., Gathered Foods Corp., Maple Leaf Foods, Inc., Finless Foods, Ocean Hunger Foods, The Vegetarian Butcher, The Kraft Heinz Co., Moving Mountains Foods, Monde Nissin Corp., Tyson Foods, Inc., Impossible Foods Inc., Van Cleve Seafood, Good Catch, The Tofurky Co. Inc., New Wave Foods, Sophie’s Kitchen, Plantish, Aqua Cultured Foods, Vegan Zeastar, OmniFoods, and Others.

Table Of Contents

1. Introduction

1.1 Market Definition & Scope

 1.2 Research Assumptions & Abbreviations

 1.3 Research Methodology

2. Executive Summary

2.1 Market Snapshot

 2.2 Market Absolute $ Opportunity Assessment & Y-o-Y Analysis, 2022–2033

 2.3 Market Size & Forecast, By Segmentation, 2022–2033

  2.3.1 Market Size By Source

  2.3.2 Market Size By Product type

  2.3.3 Market Size By Distribution Channel

  2.3.4 Market Size By End-User

 2.4 Market Share & Bps Analysis By Region, 2025

 2.5 Industry Growth Scenarios – Conservative, Likely & Optimistic

 2.6 Industry CxO’s Perspective

3. Market Overview

3.1 Market Dynamics

  3.1.1 Drivers

  3.1.2 Restraints

  3.1.3 Opportunities

  3.1.4 Key Market Trends

 3.2 Industry PESTLE Analysis

 3.3 Key Industry Forces (Porter’s) Impacting Market Growth

 3.4 Industry Supply Chain Analysis

  3.4.1 Raw Material Suppliers

  3.4.2 Manufacturers

  3.4.3 Distributors/Suppliers

  3.4.4 Customers/End-Users

 3.5 Industry Life Cycle Assessment

 3.6 Parent Market Overview

 3.7 Market Risk Assessment

4. Statistical Insights & Trends Reporting

     4.1 Production & Ingredient Metrics

4.1.1 Share (%) of plant-based shrimp manufactured using different protein sources (soy, pea, algae, etc.)

4.1.2 Average protein content per 100g of plant-based shrimp products

4.1.3 Annual production volume (tons) by leading manufacturers

     4.2 Consumer Adoption & Usage Trends

4.2.1 Percentage of consumers substituting conventional shrimp with plant-based alternatives

4.2.2 Average consumption frequency per household per month

4.2.3 Purchase preference by channel (retail, e-commerce, foodservice)

     4.3 Product Innovation & Nutritional Insights

4.3.1 Share (%) of plant-based shrimp products fortified with vitamins or minerals

4.3.2 Average sensory ratings (taste, texture, appearance) based on consumer panels

4.3.3 Proportion of products using non-GMO or organic ingredients

     4.4 Sustainability & Supply Chain Statistics

4.4.1 Reduction in water and carbon footprint compared to traditional shrimp

4.4.2 Share of suppliers sourcing raw plant proteins sustainably

4.4.3 Percentage of products certified by eco-labels or sustainability standards

5. Plant-Based Shrimp Market Segmental Analysis & Forecast, By Source, 2022 – 2033, Value (USD Billion)

5.1 Introduction

 5.2 Seaweed

  5.2.1 Key Trends

  5.2.2 Market Size & Forecast, 2022 – 2033

 5.3 Legume Protein

 5.4 Plant-based omega-3

 5.5 Soy Protein

 5.6 Pea Protein

 5.7 Others (quinoa, oats, beans, and seeds)

6. Plant-Based Shrimp Market Segmental Analysis & Forecast, By Product type, 2022 – 2033, Value (USD Billion)

    6.1 Introduction

 6.2 Breaded Vegan Shrimp

  6.2.1 Key Trends

  6.2.2 Market Size & Forecast, 2022 – 2033

 6.3 Crunchy Coconut Shrimp

 6.4 Crispy Vegan Shrimp

 6.5 Raw Vegan Shrimp

7. Plant-Based Shrimp Market Segmental Analysis & Forecast, By Distribution Channel, 2022 – 2033, Value (USD Billion)

    7.1 Introduction

 7.2 B2B

  7.2.1 Key Trends

  7.2.2 Market Size & Forecast, 2022 – 2033

 7.3 B2C

 7.3.1 Store-based retailing

 7.3.2 Online retailing

8. Plant-Based Shrimp Market Segmental Analysis & Forecast, By End-User, 2022 – 2033, Value (USD Billion)

    8.1 Introduction

 8.2 Food Service Industry

  8.2.1 Key Trends

  8.2.2 Market Size & Forecast, 2022 – 2033

 8.3 Household

 8.4 Retail

9. Plant-Based Shrimp Market Segmental Analysis & Forecast By Region, 2021 – 2025, Value (USD Billion)

9.1 Introduction

9.2 North America

 9.2.1 Key Trends

 9.2.2 Plant-Based Shrimp Market Size & Forecast, By Source, 2022 – 2033

 9.2.3 Plant-Based Shrimp Market Size & Forecast, By Product type, 2022 – 2033

 9.2.4 Plant-Based Shrimp Market Size & Forecast, By Distribution Channel, 2022 – 2033

 9.2.5 Plant-Based Shrimp Market Size & Forecast, By End-User, 2022 – 2033

 9.2.6 Plant-Based Shrimp Market Size & Forecast, By Country, 2022 – 2033

  9.2.6.1 USA

   9.2.6.1.1 Plant-Based Shrimp Market Size & Forecast, By Source, 2022 – 2033

   9.2.6.1.2 Plant-Based Shrimp Market Size & Forecast, By Product type, 2022 – 2033

   9.2.6.1.3 Plant-Based Shrimp Market Size & Forecast, By Distribution Channel, 2022 – 2033

   9.2.6.1.4 Plant-Based Shrimp Market Size & Forecast, By End-User, 2022 – 2033

  9.2.6.2 Canada

   9.2.6.2.1 Plant-Based Shrimp Market Size & Forecast, By Source, 2022 – 2033

   9.2.6.2.2 Plant-Based Shrimp Market Size & Forecast, By Product type, 2022 – 2033

   9.2.6.2.3 Plant-Based Shrimp Market Size & Forecast, By Distribution Channel, 2022 – 2033

   9.2.6.2.4 Plant-Based Shrimp Market Size & Forecast, By End-User, 2022 – 2033

9.3 Europe

 9.3.1 Key Trends

 9.3.2 Plant-Based Shrimp Market Size & Forecast, By Source, 2022 – 2033

 9.3.3 Plant-Based Shrimp Market Size & Forecast, By Product type, 2022 – 2033

 9.3.4 Plant-Based Shrimp Market Size & Forecast, By Distribution Channel, 2022 – 2033

 9.3.5 Plant-Based Shrimp Market Size & Forecast, By End-User, 2022 – 2033

 9.3.6 Plant-Based Shrimp Market Size & Forecast, By Country, 2022 – 2033

  9.3.6.1 Germany

   9.3.6.1.1 Plant-Based Shrimp Market Size & Forecast, By Source, 2022 – 2033

   9.3.6.1.2 Plant-Based Shrimp Market Size & Forecast, By Product type, 2022 – 2033

   9.3.6.1.3 Plant-Based Shrimp Market Size & Forecast, By Distribution Channel, 2022 – 2033

   9.3.6.1.4 Plant-Based Shrimp Market Size & Forecast, By End-User, 2022 – 2033

  9.3.6.2 UK

   9.3.6.2.1 Plant-Based Shrimp Market Size & Forecast, By Source, 2022 – 2033

   9.3.6.2.2 Plant-Based Shrimp Market Size & Forecast, By Product type, 2022 – 2033

   9.3.6.2.3 Plant-Based Shrimp Market Size & Forecast, By Distribution Channel, 2022 – 2033

   9.3.6.2.4 Plant-Based Shrimp Market Size & Forecast, By End-User, 2022 – 2033

  9.3.6.3 France

   9.3.6.3.1 Plant-Based Shrimp Market Size & Forecast, By Source, 2022 – 2033

   9.3.6.3.2 Plant-Based Shrimp Market Size & Forecast, By Product type, 2022 – 2033

   9.3.6.3.3 Plant-Based Shrimp Market Size & Forecast, By Distribution Channel, 2022 – 2033

   9.3.6.3.4 Plant-Based Shrimp Market Size & Forecast, By End-User, 2022 – 2033

  9.3.6.4 Italy

   9.3.6.4.1 Plant-Based Shrimp Market Size & Forecast, By Source, 2022 – 2033

   9.3.6.4.2 Plant-Based Shrimp Market Size & Forecast, By Product type, 2022 – 2033

   9.3.6.4.3 Plant-Based Shrimp Market Size & Forecast, By Distribution Channel, 2022 – 2033

   9.3.6.4.4 Plant-Based Shrimp Market Size & Forecast, By End-User, 2022 – 2033

  9.3.6.5 Spain

   9.3.6.5.1 Plant-Based Shrimp Market Size & Forecast, By Source, 2022 – 2033

   9.3.6.5.2 Plant-Based Shrimp Market Size & Forecast, By Product type, 2022 – 2033

   9.3.6.5.3 Plant-Based Shrimp Market Size & Forecast, By Distribution Channel, 2022 – 2033

   9.3.6.5.4 Plant-Based Shrimp Market Size & Forecast, By End-User, 2022 – 2033

  9.3.6.6 Russia

   9.3.6.6.1 Plant-Based Shrimp Market Size & Forecast, By Source, 2022 – 2033

   9.3.6.6.2 Plant-Based Shrimp Market Size & Forecast, By Product type, 2022 – 2033

   9.3.6.6.3 Plant-Based Shrimp Market Size & Forecast, By Distribution Channel, 2022 – 2033

   9.3.6.6.4 Plant-Based Shrimp Market Size & Forecast, By End-User, 2022 – 2033

  9.3.6.7 Poland

   9.3.6.7.1 Plant-Based Shrimp Market Size & Forecast, By Source, 2022 – 2033

   9.3.6.7.2 Plant-Based Shrimp Market Size & Forecast, By Product type, 2022 – 2033

   9.3.6.7.3 Plant-Based Shrimp Market Size & Forecast, By Distribution Channel, 2022 – 2033

   9.3.6.7.4 Plant-Based Shrimp Market Size & Forecast, By End-User, 2022 – 2033

  9.3.6.8 Rest of Europe

   9.3.6.8.1 Plant-Based Shrimp Market Size & Forecast, By Source, 2022 – 2033

   9.3.6.8.2 Plant-Based Shrimp Market Size & Forecast, By Product type, 2022 – 2033

   9.3.6.8.3 Plant-Based Shrimp Market Size & Forecast, By Distribution Channel, 2022 – 2033

   9.3.6.8.4 Plant-Based Shrimp Market Size & Forecast, By End-User, 2022 – 2033   

9.4 Asia-Pacific

 9.4.1 Key Trends

 9.4.2 Plant-Based Shrimp Market Size & Forecast, By Source, 2022 – 2033

 9.4.3 Plant-Based Shrimp Market Size & Forecast, By Product type, 2022 – 2033

 9.4.4 Plant-Based Shrimp Market Size & Forecast, By Distribution Channel, 2022 – 2033

 9.4.5 Plant-Based Shrimp Market Size & Forecast, By End-User, 2022 – 2033

 9.4.6 Plant-Based Shrimp Market Size & Forecast, By Country, 2022 – 2033

  9.4.6.1 China

   9.4.6.1.1 Plant-Based Shrimp Market Size & Forecast, By Source, 2022 – 2033

   9.4.6.1.2 Plant-Based Shrimp Market Size & Forecast, By Product type, 2022 – 2033

   9.4.6.1.3 Plant-Based Shrimp Market Size & Forecast, By Distribution Channel, 2022 – 2033

   9.4.6.1.4 Plant-Based Shrimp Market Size & Forecast, By End-User, 2022 – 2033

  9.4.6.2 India

   9.4.6.2.1 Plant-Based Shrimp Market Size & Forecast, By Source, 2022 – 2033

   9.4.6.2.2 Plant-Based Shrimp Market Size & Forecast, By Product type, 2022 – 2033

   9.4.6.2.3 Plant-Based Shrimp Market Size & Forecast, By Distribution Channel, 2022 – 2033

   9.4.6.2.4 Plant-Based Shrimp Market Size & Forecast, By End-User, 2022 – 2033

  9.4.6.3 Japan

   9.4.6.3.1 Plant-Based Shrimp Market Size & Forecast, By Source, 2022 – 2033

   9.4.6.3.2 Plant-Based Shrimp Market Size & Forecast, By Product type, 2022 – 2033

   9.4.6.3.3 Plant-Based Shrimp Market Size & Forecast, By Distribution Channel, 2022 – 2033

   9.4.6.3.4 Plant-Based Shrimp Market Size & Forecast, By End-User, 2022 – 2033

  9.4.6.4 South Korea

   9.4.6.4.1 Plant-Based Shrimp Market Size & Forecast, By Source, 2022 – 2033

   9.4.6.4.2 Plant-Based Shrimp Market Size & Forecast, By Product type, 2022 – 2033

   9.4.6.4.3 Plant-Based Shrimp Market Size & Forecast, By Distribution Channel, 2022 – 2033

   9.4.6.4.4 Plant-Based Shrimp Market Size & Forecast, By End-User, 2022 – 2033

  9.4.6.5 Australia

   9.4.6.5.1 Plant-Based Shrimp Market Size & Forecast, By Source, 2022 – 2033

   9.4.6.5.2 Plant-Based Shrimp Market Size & Forecast, By Product type, 2022 – 2033

   9.4.6.5.3 Plant-Based Shrimp Market Size & Forecast, By Distribution Channel, 2022 – 2033

   9.4.6.5.4 Plant-Based Shrimp Market Size & Forecast, By End-User, 2022 – 2033

  9.4.6.6 ASEAN Countries

   9.4.6.6.1 Plant-Based Shrimp Market Size & Forecast, By Source, 2022 – 2033

   9.4.6.6.2 Plant-Based Shrimp Market Size & Forecast, By Product type, 2022 – 2033

   9.4.6.6.3 Plant-Based Shrimp Market Size & Forecast, By Distribution Channel, 2022 – 2033

   9.4.6.6.4 Plant-Based Shrimp Market Size & Forecast, By End-User, 2022 – 2033

  9.4.6.7 Rest of Asia-Pacific

   9.4.6.7.1 Plant-Based Shrimp Market Size & Forecast, By Source, 2022 – 2033

   9.4.6.7.2 Plant-Based Shrimp Market Size & Forecast, By Product type, 2022 – 2033

   9.4.6.7.3 Plant-Based Shrimp Market Size & Forecast, By Distribution Channel, 2022 – 2033

   9.4.6.7.4 Plant-Based Shrimp Market Size & Forecast, By End-User, 2022 – 2033

9.5 Latin America

 9.5.1 Key Trends

 9.5.2 Plant-Based Shrimp Market Size & Forecast, By Source, 2022 – 2033

 9.5.3 Plant-Based Shrimp Market Size & Forecast, By Product type, 2022 – 2033

 9.5.4 Plant-Based Shrimp Market Size & Forecast, By Distribution Channel, 2022 – 2033

 9.5.5 Plant-Based Shrimp Market Size & Forecast, By End-User, 2022 – 2033

 9.5.6 Plant-Based Shrimp Market Size & Forecast, By Country, 2022 – 2033

  9.5.6.1 Brazil

   9.5.6.1.1 Plant-Based Shrimp Market Size & Forecast, By Source, 2022 – 2033

   9.5.6.1.2 Plant-Based Shrimp Market Size & Forecast, By Product type, 2022 – 2033

   9.5.6.1.3 Plant-Based Shrimp Market Size & Forecast, By Distribution Channel, 2022 – 2033

   9.5.6.1.4 Plant-Based Shrimp Market Size & Forecast, By End-User, 2022 – 2033

  9.5.6.2 Argentina

   9.5.6.2.1 Plant-Based Shrimp Market Size & Forecast, By Source, 2022 – 2033

   9.5.6.2.2 Plant-Based Shrimp Market Size & Forecast, By Product type, 2022 – 2033

   9.5.6.2.3 Plant-Based Shrimp Market Size & Forecast, By Distribution Channel, 2022 – 2033

   9.5.6.2.4 Plant-Based Shrimp Market Size & Forecast, By End-User, 2022 – 2033

  9.5.6.3 Mexico

   9.5.6.3.1 Plant-Based Shrimp Market Size & Forecast, By Source, 2022 – 2033

   9.5.6.3.2 Plant-Based Shrimp Market Size & Forecast, By Product type, 2022 – 2033

   9.5.6.3.3 Plant-Based Shrimp Market Size & Forecast, By Distribution Channel, 2022 – 2033

   9.5.6.3.4 Plant-Based Shrimp Market Size & Forecast, By End-User, 2022 – 2033

  9.5.6.4 Colombia

   9.5.6.4.1 Plant-Based Shrimp Market Size & Forecast, By Source, 2022 – 2033

   9.5.6.4.2 Plant-Based Shrimp Market Size & Forecast, By Product type, 2022 – 2033

   9.5.6.4.3 Plant-Based Shrimp Market Size & Forecast, By Distribution Channel, 2022 – 2033

   9.5.6.4.4 Plant-Based Shrimp Market Size & Forecast, By End-User, 2022 – 2033

  9.5.6.5 Rest of Latin America

   9.5.6.5.1 Plant-Based Shrimp Market Size & Forecast, By Source, 2022 – 2033

   9.5.6.5.2 Plant-Based Shrimp Market Size & Forecast, By Product type, 2022 – 2033

   9.5.6.5.3 Plant-Based Shrimp Market Size & Forecast, By Distribution Channel, 2022 – 2033

   9.5.6.5.4 Plant-Based Shrimp Market Size & Forecast, By End-User, 2022 – 2033

9.6 Middle East & Africa

 9.6.1 Key Trends

 9.6.2 Plant-Based Shrimp Market Size & Forecast, By Source, 2022 – 2033

 9.6.3 Plant-Based Shrimp Market Size & Forecast, By Product type, 2022 – 2033

 9.6.4 Plant-Based Shrimp Market Size & Forecast, By Distribution Channel, 2022 – 2033

 9.6.5 Plant-Based Shrimp Market Size & Forecast, By End-User, 2022 – 2033

 9.6.6 Plant-Based Shrimp Market Size & Forecast, By Country, 2022 – 2033

  9.6.6.1 UAE

   9.6.6.1.1 Plant-Based Shrimp Market Size & Forecast, By Source, 2022 – 2033

   9.6.6.1.2 Plant-Based Shrimp Market Size & Forecast, By Product type, 2022 – 2033

   9.6.6.1.3 Plant-Based Shrimp Market Size & Forecast, By Distribution Channel, 2022 – 2033

   9.6.6.1.4 Plant-Based Shrimp Market Size & Forecast, By End-User, 2022 – 2033

  9.6.6.2 Saudi Arabia

   9.6.6.2.1 Plant-Based Shrimp Market Size & Forecast, By Source, 2022 – 2033

   9.6.6.2.2 Plant-Based Shrimp Market Size & Forecast, By Product type, 2022 – 2033

   9.6.6.2.3 Plant-Based Shrimp Market Size & Forecast, By Distribution Channel, 2022 – 2033

   9.6.6.2.4 Plant-Based Shrimp Market Size & Forecast, By End-User, 2022 – 2033

  9.6.6.3 Qatar

   9.6.6.3.1 Plant-Based Shrimp Market Size & Forecast, By Source, 2022 – 2033

   9.6.6.3.2 Plant-Based Shrimp Market Size & Forecast, By Product type, 2022 – 2033

   9.6.6.3.3 Plant-Based Shrimp Market Size & Forecast, By Distribution Channel, 2022 – 2033

   9.6.6.3.4 Plant-Based Shrimp Market Size & Forecast, By End-User, 2022 – 2033

  9.6.6.4 Egypt

   9.6.6.4.1 Plant-Based Shrimp Market Size & Forecast, By Source, 2022 – 2033

   9.6.6.4.2 Plant-Based Shrimp Market Size & Forecast, By Product type, 2022 – 2033

   9.6.6.4.3 Plant-Based Shrimp Market Size & Forecast, By Distribution Channel, 2022 – 2033

   9.6.6.4.4 Plant-Based Shrimp Market Size & Forecast, By End-User, 2022 – 2033

  9.6.6.5 South Africa

   9.6.6.5.1 Plant-Based Shrimp Market Size & Forecast, By Source, 2022 – 2033

   9.6.6.5.2 Plant-Based Shrimp Market Size & Forecast, By Product type, 2022 – 2033

   9.6.6.5.3 Plant-Based Shrimp Market Size & Forecast, By Distribution Channel, 2022 – 2033

   9.6.6.5.4 Plant-Based Shrimp Market Size & Forecast, By End-User, 2022 – 2033

  9.6.6.6 Rest of Middle East & Africa

   9.6.6.6.1 Plant-Based Shrimp Market Size & Forecast, By Source, 2022 – 2033

   9.6.6.6.2 Plant-Based Shrimp Market Size & Forecast, By Product type, 2022 – 2033

   9.6.6.6.3 Plant-Based Shrimp Market Size & Forecast, By Distribution Channel, 2022 – 2033

   9.6.6.6.4 Plant-Based Shrimp Market Size & Forecast, By End-User, 2022 – 2033

10. Competitive Landscape

 10.1 Key Players' Positioning

 10.2 Competitive Developments

  10.2.1 Key Strategies Adopted (%), By Key Players, 2025

  10.2.2 Year-Wise Strategies & Development, 2021 – 2025

  10.2.3 Number Of Strategies Adopted By Key Players, 2025

 10.3 Market Share Analysis, 2025

 10.4 Product/Service & Application Benchmarking

  10.4.1 Product/Service Specifications & Features By Key Players

  10.4.2 Product/Service Heatmap By Key Players

  10.4.3 Application Heatmap By Key Players

 10.5 Industry Start-Up & Innovation Landscape

10.6 Key Company Profiles

10.6.1 Beyond Meat, Inc. 

  10.6.1.1 Company Overview & Snapshot 

  10.6.1.2 Product/Service Portfolio 

  10.6.1.3 Key Company Financials 

  10.6.1.4 SWOT Analysis 

10.6.2 Gathered Foods Corp. 

10.6.3 Maple Leaf Foods, Inc. 

10.6.4 Finless Foods 

10.6.5 Ocean Hunger Foods 

10.6.6 The Vegetarian Butcher 

10.6.7 The Kraft Heinz Co. 

10.6.8 Moving Mountains Foods 

10.6.9 Monde Nissin Corp. 

10.6.10 Tyson Foods, Inc. 

10.6.11 Impossible Foods Inc. 

10.6.12 Van Cleve Seafood 

10.6.13 Good Catch 

10.6.14 The Tofurky Co. Inc. 

10.6.15 New Wave Foods 

10.6.16 Sophie’s Kitchen 

10.6.17 Plantish 

10.6.18 Aqua Cultured Foods 

10.6.19 Vegan Zeastar 

10.6.20 OmniFoods 

11. Analyst Recommendations

 11.1 SNS Insider Opportunity Map

 11.2 Industry Low-Hanging Fruit Assessment

 11.3 Market Entry & Growth Strategy

 11.4 Analyst Viewpoint & Suggestions On Market Growth

12. Assumptions

13. Disclaimer

14. Appendix

 14.1 List Of Tables

 14.2 List Of Figures

Key Segments: 

By Source

  • Seaweed

  • Legume Protein

  • Plant-based omega-3

  • Soy Protein

  • Pea Protein

  • Others (quinoa, oats, beans, and seeds)

By Product type

  • Breaded Vegan Shrimp

  • Crunchy Coconut Shrimp

  • Crispy Vegan Shrimp

  • Raw Vegan Shrimp

By Distribution channel

  • B2B

  • B2C

    • Store-based retailing

    • Online retailing

By End-Use

  • Food Service Industry

  • Household

  • Retail

Request for Segment Customization as per your Business Requirement: Segment Customization Request

Regional Coverage: 

North America

  • US

  • Canada

Europe

  • Germany

  • France

  • UK

  • Italy

  • Spain

  • Poland

  • Russia

  • Rest of Europe

Asia Pacific

  • China

  • India

  • Japan

  • South Korea

  • Australia

  • ASEAN Countries

  • Rest of Asia Pacific

Middle East & Africa

  • UAE

  • Saudi Arabia

  • Qatar

  • South Africa

  • Rest of Middle East & Africa

Latin America

  • Brazil

  • Argentina

  • Mexico

  • Colombia

  • Rest of Latin America

Request for Country Level Research Report: Country Level Customization Request

Available Customization 

With the given market data, SNS Insider offers customization as per the company’s specific needs. The following customization options are available for the report: 

  • Detailed Volume Analysis 

  • Criss-Cross segment analysis (e.g. Product X Application) 

  • Competitive Product Benchmarking 

  • Geographic Analysis 

  • Additional countries in any of the regions 

  • Customized Data Representation 

  • Detailed analysis and profiling of additional market players

An accurate research report requires proper strategizing as well as implementation. There are multiple factors involved in the completion of good and accurate research report and selecting the best methodology to compete the research is the toughest part. Since the research reports we provide play a crucial role in any company’s decision-making process, therefore we at SNS Insider always believe that we should choose the best method which gives us results closer to reality. This allows us to reach at a stage wherein we can provide our clients best and accurate investment to output ratio.

Each report that we prepare takes a timeframe of 350-400 business hours for production. Starting from the selection of titles through a couple of in-depth brain storming session to the final QC process before uploading our titles on our website we dedicate around 350 working hours. The titles are selected based on their current market cap and the foreseen CAGR and growth.


The 5 steps process:

Step 1: Secondary Research:

Secondary Research or Desk Research is as the name suggests is a research process wherein, we collect data through the readily available information. In this process we use various paid and unpaid databases which our team has access to and gather data through the same. This includes examining of listed companies’ annual reports, Journals, SEC filling etc. Apart from this our team has access to various associations across the globe across different industries. Lastly, we have exchange relationships with various university as well as individual libraries.

Secondary Research

Step 2: Primary Research

When we talk about primary research, it is a type of study in which the researchers collect relevant data samples directly, rather than relying on previously collected data.  This type of research is focused on gaining content specific facts that can be sued to solve specific problems. Since the collected data is fresh and first hand therefore it makes the study more accurate and genuine.

We at SNS Insider have divided Primary Research into 2 parts.

Part 1 wherein we interview the KOLs of major players as well as the upcoming ones across various geographic regions. This allows us to have their view over the market scenario and acts as an important tool to come closer to the accurate market numbers. As many as 45 paid and unpaid primary interviews are taken from both the demand and supply side of the industry to make sure we land at an accurate judgement and analysis of the market.

This step involves the triangulation of data wherein our team analyses the interview transcripts, online survey responses and observation of on filed participants. The below mentioned chart should give a better understanding of the part 1 of the primary interview.

Primary Research

Part 2: In this part of primary research the data collected via secondary research and the part 1 of the primary research is validated with the interviews from individual consultants and subject matter experts.

Consultants are those set of people who have at least 12 years of experience and expertise within the industry whereas Subject Matter Experts are those with at least 15 years of experience behind their back within the same space. The data with the help of two main processes i.e., FGDs (Focused Group Discussions) and IDs (Individual Discussions). This gives us a 3rd party nonbiased primary view of the market scenario making it a more dependable one while collation of the data pointers.

Step 3: Data Bank Validation

Once all the information is collected via primary and secondary sources, we run that information for data validation. At our intelligence centre our research heads track a lot of information related to the market which includes the quarterly reports, the daily stock prices, and other relevant information. Our data bank server gets updated every fortnight and that is how the information which we collected using our primary and secondary information is revalidated in real time.

Data Bank Validation

Step 4: QA/QC Process

After all the data collection and validation our team does a final level of quality check and quality assurance to get rid of any unwanted or undesired mistakes. This might include but not limited to getting rid of the any typos, duplication of numbers or missing of any important information. The people involved in this process include technical content writers, research heads and graphics people. Once this process is completed the title gets uploader on our platform for our clients to read it.

Step 5: Final QC/QA Process:

This is the last process and comes when the client has ordered the study. In this process a final QA/QC is done before the study is emailed to the client. Since we believe in giving our clients a good experience of our research studies, therefore, to make sure that we do not lack at our end in any way humanly possible we do a final round of quality check and then dispatch the study to the client.