-
Rapid shift toward cashless and digital payments is driving POS adoption, with over 65% of global transactions now conducted via cards or digital wallets.
-
Rising demand for mobile and wireless POS (mPOS) solutions is accelerating, growing at a CAGR of over 12%, especially among SMEs and retail outlets.
-
Expansion of contactless payments (NFC-enabled POS) is increasing, accounting for more than 50% of in-store transactions in developed markets.
-
Integration with cloud-based POS and analytics platforms is growing, with over 55% of new deployments supporting real-time data tracking and inventory management.
-
Growth of omnichannel retail and e-commerce integration is boosting POS upgrades, with retailers reporting 20–30% improvement in transaction efficiency.
POS Terminals Market Size:
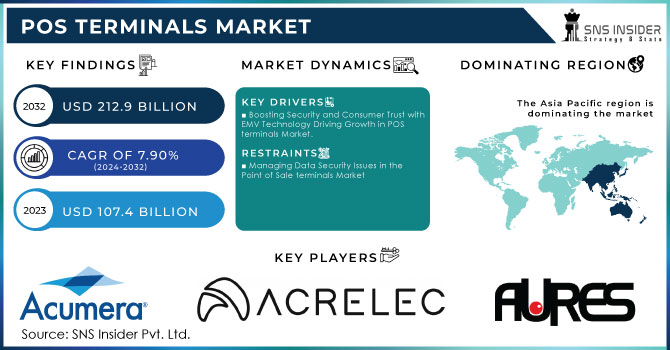
The POS Terminals Market Size was valued at USD 107.4 billion in 2023 and is expected to reach USD 212.9 billion by 2032 and grow at a CAGR of 7.90% over the forecast period 2024-2032.
The POS terminals market has experienced significant growth in the past few years, thanks to its capacity to improve return on investment (ROI) and provide user-friendly solutions in different sectors like retail, hospitality, transportation, and banking. POS systems have transformed from simple transaction-focused devices to complex tools that merge with financial solutions and customer relationship management (CRM) systems, giving businesses access to business intelligence (BI) for improved revenue and inventory control. Transitioning to POS systems provides many benefits such as precise transactions, reduced maintenance expenses, and live inventory monitoring. The advantages of modern POS systems have led businesses to switch from traditional billing software, resulting in the steady expansion of the market. Companies like Aures Technologies and Sharp Electronics have decreased deployment and maintenance costs significantly by offering innovations like modular terminals with low power usage and touchscreen displays, making it more cost-effective for small and large businesses.
POS Terminals Market Size and Forecast
-
Market Size in 2023: USD 107.4 Billion
-
Market Size by 2032: USD 212.9 Billion
-
CAGR: 7.90% from 2024 to 2032
-
Base Year: 2023
-
Forecast Period: 2024–2032
-
Historical Data: 2020–2022
Get more information on POS Terminals Market - Request Sample Report
POS Terminals Market Trends
Contemporary POS terminals have reduced moving components by incorporating fanless temperature control, enhancing durability and lifespan. The increasing popularity of contactless payments, virtual consultations, and social commerce has continued to drive the need for advanced POS solutions. Nevertheless, security issues continue to be a problem, as POS systems are at risk of network-based attacks that could reveal sensitive payment details like Track2 and PIN data, resulting in card theft and duplication. Even with these dangers, the operational benefits of POS systems in enhancing efficiency and lowering expenses keep propelling market expansion worldwide. With the rise of digital transformation in industries, the use of POS terminals is expected to increase, with advancements focusing on enhancing security and data encryption to manage risks and ensure sustained growth in the market.
The POS terminals market has seen a notable increase, fueled by the rising need for wireless communication technologies and the embrace of high-tech payment options. Wireless POS systems simplify payment procedures in different sectors, especially in retail, hospitality, and food services, by improving tasks such as sales monitoring, inventory control, and accounting. Restaurants and fast-casual establishments like Chipotle, Starbucks, and Panera have adopted POS technology to unify their drive-thru queues, kitchens, and administrative functions, leading to enhanced order processing and customer contentment. The growth of the market, particularly in e-commerce and retail, has been significantly driven by the increase in mobile POS terminals and the prevalence of EMV cards from companies like Europay, Mastercard, and Visa. Furthermore, the rising trend of contactless payments and the expanding presence of Near Field Communication (NFC) technology in various sectors have also heightened the need for POS systems. Businesses have chosen to utilize modern POS solutions due to their convenience, improved ROI, and ability to manage customer interactions, oversee employees, and unify in-store and online sales using mobile devices such as tablets. In spite of the numerous advantages, issues regarding security and privacy stemming from data breaches and information misuse persist as challenges, largely because these systems are vulnerable when exposed over networks. Prominent POS breaches heighten the possibility of identity theft, financial loss, and fraudulent transactions, highlighting the need for enhanced security measures like VeriFone’s VeriShield to protect data transmission in POS systems.
| Report Attributes | Details |
|---|---|
| Key Segments | • By Product (Fixed, Mobileb) • By Component (Hardware, Software, Services) • By Deployment (Cloud, On-premise) • By End-User (Restaurants(FSR, QSR, Institutional, Fast Casual), Healthcare, Entertainment, Warehouse, Retail, Hospitality) |
| Regional Coverage | North America (US, Canada, Mexico), Europe (Eastern Europe [Poland, Romania, Hungary, Turkey, Rest of Eastern Europe] Western Europe] Germany, France, UK, Italy, Spain, Netherlands, Switzerland, Austria, Rest of Western Europe]), Asia Pacific (China, India, Japan, South Korea, Vietnam, Singapore, Australia, Rest of Asia Pacific), Middle East & Africa (Middle East [UAE, Egypt, Saudi Arabia, Qatar, Rest of Middle East], Africa [Nigeria, South Africa, Rest of Africa], Latin America (Brazil, Argentina, Colombia, Rest of Latin America) |
| Company Profiles |
Acumera,Inc.,Acrelec,AURESGroup, HM Electronics, Hewlett Packard Development,NCR Corporation,Oracle Corporation,Payabl POSaBIT Systems Corporation, Presto Group,Qu, Inc.,Quail Digital,Revel Systems Toast, Inc., Toshiba Corp. ,Touch Bistro ,Xenial, Inc. ,Diebold Nixdorf , Ingenico , Others |
POS Terminals Market Dynamics:
Drivers
-
Boosting Security and Consumer Trust with EMV Technology Driving Growth in POS terminals Market.
The increased use of EMV chip technology, consisting of Europay, MasterCard, and Visa, is a key factor in the growth of the POS terminals industry, enhancing security and trust among consumers in payment systems. EMV technology, which uses embedded chips to create unique transaction codes, has significantly decreased the chances of card fraud in comparison to magnetic stripe cards. Consequently, more than 90% of point-of-sale (POS) terminals in the U.S. have now adopted EMV technology, demonstrating the industry's dedication to improving security measures. The industry's focus on transitioning to chip-based payments is demonstrated through recent initiatives by the EMV Migration Forum, including consumer educational videos, white papers on managing tips and gratuities, and detailed presentations on cardholder verification methods (CVMs). These tools are designed to inform both buyers and sellers, making it easier to transition to the new technology and promoting its widespread use. Moreover, the establishment of the Petroleum Working Committee highlights continued attempts to tackle particular sector issues concerning EMV integration, improving POS system interoperability among different industries such as petroleum and convenience sectors. With the increasing number of merchants adopting EMV technology, the need for advanced POS terminals that can handle secure chip transactions is also on the rise. This change does not just improve transaction security but also increases consumer confidence in digital payments, leading to more growth in the POS terminals market. As contactless payments and integrated payment solutions become more widespread, modern POS systems are becoming more capable of managing complicated payment situations, leading to a wider use in retail and service industries. The market is being advanced greatly by EMV technology, which focuses on security and enhancing consumer experience, easing worries and building trust in digital payment systems.
-
Speeding up payments and improving point-of-sale systems with the introduction of FedNow in the POS terminals market.
The introduction of the FedNow Service by the Federal Reserve will play a crucial role in changing the U.S. payments industry, especially impacting the development and advancement of Point-of-Sale (POS) systems. The FedNow Service, set to launch in mid-2023, will allow for real-time payments, making it easier to transfer money instantaneously between accounts. This progress facilitates a economy that operates 24 hours a day, 7 days a week, 365 days a year, with a growing need for instant transactions from both consumers and businesses. In contrast to apps for consumers, FedNow serves as a basic framework that banks can incorporate to provide their own immediate payment options. Having more than 100 service providers available on the FedNow Explorer, such as payment processors and banking operations, gives institutions strong support in utilizing and benefiting from this service. This advancement improves transaction speed and efficiency while updating POS systems through real-time payment processing. As POS terminals advance to include instant payment features, they play a crucial role in enhancing customer satisfaction, simplifying processes, and enabling fast transaction processing. The FedNow Service aims to cover the entire nation, filling in the current gaps in smooth payment transfers and meeting the growing demand for secure and efficient POS solutions. This change in infrastructure is fueling the need for more sophisticated POS systems capable of processing instant payments, leading to the growth and update of the POS terminals industry. Incorporating real-time payment features into POS systems is expected to improve operational efficiency and customer happiness, leading to increased expansion in the industry.
Restraints
-
Managing Data Security Issues in the Point of Sale terminals Market
With the rising importance of Point-of-Sale (POS) systems in business operations, data security issues are posing a major challenge, affecting the market's progress and development. POS terminals are desirable targets for cyber-attacks because they handle sensitive payment data. The DBIR for 2023 from Verizon emphasized that more than 80% of data breaches included compromised point-of-sale systems, showing the urgent requirement for strong security measures. The PCI DSS offers rules for protecting cardholder data, yet breaches persist as a result of weaknesses in obsolete systems and insufficient security measures. In the United States, 45% of data breaches are connected to point-of-sale systems, highlighting the importance of adhering to industry standards and utilizing advanced security technologies, according to the FTC. NIST suggests using various security measures like encryption, tokenization, and secure network protocols to safeguard payment data and reduce risks. The increase in technologies like EMV chip cards, providing improved security with individual transaction codes, is a reaction to these worries, with over 90% of U.S. POS terminals now meeting EMV standards.
POS Terminals Market Segment Analysis:
By Product
In the POS terminals market, the fixed POS terminals segment held a majority share of 62% in 2023, showing its importance and appeal to big vendors and businesses. Fixed POS terminals, commonly categorized as kiosks and other variants, provide strong capabilities and dependability, making them the top option for companies with significant budgets for purchasing and setting up. Leading this category are Aures Technologies and Sharp Electronics with high-performance fixed POS systems that incorporate advanced features for different business functions. Fixed POS systems are appreciated for their extensive features, such as bill printing, Customer Relationship Management (CRM), managing inventory, and efficient payment processing. Aures Technologies provides the Sango POS terminal, known for its durability and multifunctionality, while Sharp Electronics has released the Sharp XE-A217 model, which includes an integrated receipt printer and advanced sales reporting features.The inclination towards fixed POS terminals is also influenced by their ability to securely store data, often through on-site servers for businesses that prioritize strong data security. As companies acknowledge the significance of protecting transaction data from breaches and cyber threats, this becomes particularly important. Furthermore, the continuous development and introduction of advanced products are helping drive the growth of the fixed POS segment. For instance, Verifone recently introduced the Verifone Carbon, a stationary POS system created to improve transaction speed and security by connecting with cloud-based data storage choices. The significant funding in stationary POS terminals matches the demand for dependable, safe, and versatile systems that meet various business requirements, strengthening the sector's top spot in the POS industry.
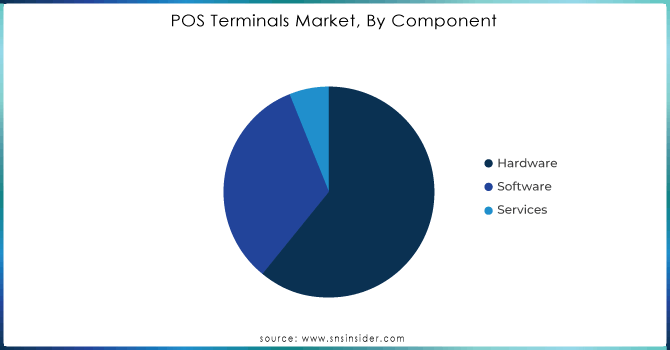
By Component
In 2023, the hardware division of the POS terminals market held a significant 61% share, showcasing its importance in transaction processing and system functionality. This sector, which includes important elements such as EFT-POS machines, network devices, barcode scanners, cash drawers, receipt printers, tablets, and monitors, prioritizes hardware due to the requirement for dependable and versatile devices that facilitate smooth transaction handling and ensure data protection. Top companies are always finding new ways to improve hardware capabilities and functionality through innovation. One instance is when Ingenico, a prominent market player, unveiled the Ingenico Desk/5000, a multi-functional payment terminals with a spacious touchscreen and high-level security components. Verifone has also launched the Verifone P400 Plus, a durable point of sale device meant to connect with different peripheral equipment, providing improved speed and reliability for transactions. The merging of hardware components with customized software solutions plays a major role in driving market growth. Retail POS systems utilize advanced software to offer a wide range of capabilities including real-time inventory tracking, transaction notifications, and in-depth sales analysis. Square, recognized for its inventive methods, has broadened its range of hardware by introducing the Square Register, a comprehensive system featuring an integrated receipt printer and a display for customers, simplifying the payment process. In addition to that, Elo Touch Solutions has launched the Elo PayPoint, a versatile POS terminals that merges touchscreen technology with adaptable payment processing features.The growth of the hardware industry is also driven by its essential function in maintaining efficient processes in different fields such as retail and hospitality. High-quality hardware components like modern card readers and high-definition touchscreens are necessary for providing a smooth customer experience and ensuring strong transaction security. The constant evolution and merging of hardware with sophisticated software features highlight the sector's control and its important role in the complete POS terminals market.
Get Customized Report as per your Business Requirement - Request For Customized Report
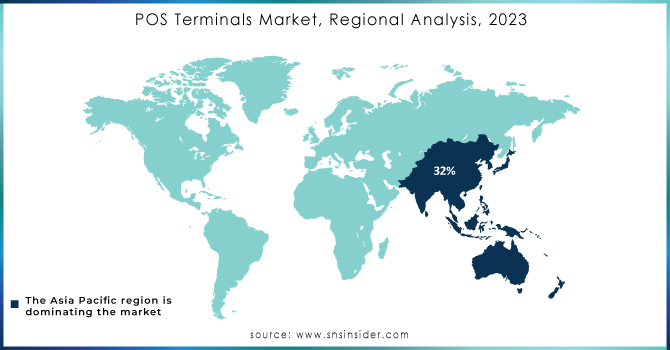
POS Terminals Market Regional Analysis:
In 2023, the Asia-Pacific region commanded a substantial 32% share of the global POS terminals market, reflecting its leadership in technology adoption and the rising demand for cashless payments. This region's rapid embrace of digital payment solutions has significantly influenced POS terminals growth, driven by increased usage of credit and debit cards for point-of-sale transactions. For instance, according to the Reserve Bank of India, India alone had over 4.7 Billion POS terminals, underscoring the sector's expansion across diverse business segments including restaurants, grocery stores, and fuel stations. The region's growth trajectory is further supported by strategic investments and partnerships. For example, MYPINPAD collaborated with SPECTRA Technologies and Hong Kong’s leading payment terminals manufacturer to launch a software-based contactless payment solution, enhancing the payment experience for small and micro-merchants in Hong Kong. This innovation, backed by Mastercard, aims to broaden the Mastercard Tap on Phone acceptance network, catering to the increasing demand for secure and convenient payment methods. Additionally, the growth of e-commerce in Asia-Pacific presents further opportunities for the POS terminals market. A recent study by Reprise and Google highlighted that online shoppers in the region are outpacing their offline counterparts, with online shopping frequencies significantly exceeding those of offline shoppers. This surge in e-commerce activities is propelling the need for advanced POS systems that can integrate seamlessly with online platforms and offer robust transaction capabilities. Companies like Verifone and Ingenico have responded to these demands by rolling out new POS solutions tailored to the region's evolving needs, such as the Verifone P400 Plus and the Ingenico Desk/5000, which offer enhanced functionalities to meet the diverse requirements of businesses across Asia-Pacific. The region's rapid digital transformation and strategic investments are thus driving the robust growth and innovation in the POS terminals market.
In 2023, North America emerged as a significant player in the global POS terminals market, ranking as the second fastest-growing region. The growth of modern retail settings is being driven significantly by the region's high demand for innovative payment technologies such as contactless payments and NFC. Major US retailers like Walmart, Costco, Target, Kroger, and Home Depot heavily rely on POS terminals for tasks like billing, payment processing, employee management, and inventory control, showcasing the strength of the country's retail industry. The growing market power of these major retailers underscores the increasing need for advanced POS systems capable of efficiently handling complex transactions. Additionally, strict regulatory requirements and the widespread use of digital payment systems in the U.S. contribute to the high demand for advanced POS terminals, which are crucial for ensuring transaction security and meeting compliance standards. Square and Clover are leading the way in innovation, as Square introduces new POS solutions for small to medium-sized businesses and Clover enhances its systems to better integrate with various payment technologies. The region's emphasis on technological developments and enhancing customer convenience contributes to its position as a major player in shaping global payment processing trends. North America remains at the forefront of the POS terminals market by focusing on combining cutting-edge technology with robust regulatory frameworks, influencing both domestic growth and global norms.
KEY PLAYERS:
-
Acumera, Inc. (Secure network solutions for POS systems)
-
Acrelec (Interactive kiosks and self-service terminals)
-
AURES Group (POS terminals, digital signage, and mobile POS solutions)
-
HM Electronics (Wireless communication systems and accessories for POS)
-
Hewlett Packard Development LP (POS hardware including receipt printers and cash drawers)
-
NCR Corporation (Retail POS systems, self-service kiosks, and ATMs)
-
Oracle Corporation (POS software solutions, integrated hardware and software systems)
-
Payabl (Payment processing solutions integrated with POS systems)
-
POSaBIT Systems Corporation (POS systems for the cannabis industry)
-
Presto Group (Restaurant POS solutions, self-service kiosks)
-
Qu, Inc. (Cloud-based POS solutions and payment processing)
-
Quail Digital (Wireless communication solutions for retail and hospitality)
-
Revel Systems (iPad-based POS systems for retail and restaurants)
-
Toast, Inc. (Restaurant POS systems and management software)
-
Toshiba Corp. (Retail POS hardware and software, including self-checkout systems)
-
TouchBistro (Restaurant POS systems and management tools)
-
Xenial, Inc. (POS systems, self-service kiosks, and payment solutions)
-
Diebold Nixdorf (Retail and banking POS systems, self-service kiosks)
-
Ingenico (Payment terminals, PIN pads, and integrated payment solutions)
-
VeriFone Systems, Inc. (Payment Terminals, Mobile POS Solutions)
-
Others (Various POS terminals, accessories, and related solutions)
RECENT DEVELOPMENT
-
In January 2024, Acumera, Inc. will present Acumera Reliant Platform at the National Retail Federation (NRF) 2024 Conference and Expo. The Acumera Reliant Platform is designed for retailers. Retailers have constant access to critical applications to remain competitive in the rapidly evolving retail market.
-
In June 2023, the FinTech company paid. has launched a new point-of-sale (POS) solution that enables businesses to accept payments from both online and offline sales through a single terminal, enhancing its omni-channel payment services for in-person purchases from retailers.
-
On July 15, 2024, Posiflex Technology Inc. introduces its stylish, customizable Mozart BT Series POS terminals, showcasing powerful computing, the newest operating system, and seamless design suitable for various business settings.
-
On May 19, 2024, Applova Inc. introduced the Applova On-the-Go POS system on the Elo Pay M60 handheld device, improving restaurant operations and customer satisfaction through in-person ordering and payments at the table.
| Report Attributes | Details |
|---|---|
| Market Size in 2023 | USD 107.4 Billion |
| Market Size by 2032 | USD 212.9 Billion |
| CAGR | CAGR of 7.90 % From 2024 to 2032 |
| Base Year | 2023 |
| Forecast Period | 2024-2032 |
| Historical Data | 2020-2022 |
| Report Scope & Coverage | Market Size, Segments Analysis, Competitive Landscape, Regional Analysis, DROC & SWOT Analysis, Forecast Outlook |
| Key Drivers |
• Boosting Security and Consumer Trust with EMV Technology Driving Growth in POS terminals Market. • Speeding up payments and improving point-of-sale systems with the introduction of FedNow in the POS terminals market. |
| Restraints | • Managing Data Security Issues in the Point of Sale terminals Market |
Frequently Asked Questions
Ans: Asia-Pacific dominated the POS Terminals Market in 2023.
Ans: The Fixed segment dominated the POS Terminals Market.
Ans: The major growth factor for the POS terminals market is the increasing consumer preference for seamless and secure digital and contactless payment methods.
Ans: The POS Terminals Market Size was valued at USD 107.4 billion in 2023 and is expected to reach USD 212.9 billion by 2032 and grow at a CAGR of 7.90% over the forecast period 2024-2032.
Ans: The POS Terminals Market grow at a CAGR of 7.90% over the forecast period of 2024-2032.
Get in Touch
