Interactive Display Market Size & Growth:
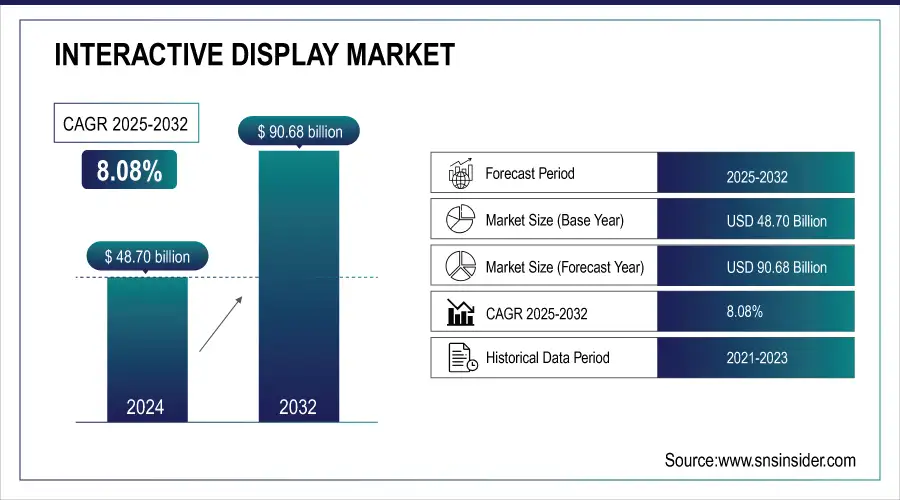
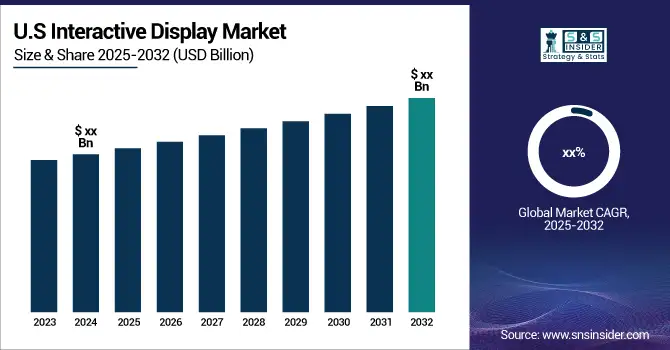
The Interactive Display Market Size was valued at USD 48.70 billion in 2024 and is expected to reach USD 90.68 billion by 2032, and grow at a CAGR of 8.08% over the forecast period 2025-2032.
The interactive display market is experiencing rapid growth as retailers adopt advanced technologies to enhance customer engagement and create immersive shopping experiences. These displays combine digital screens, touchscreen technology, sensors, software integration, and network connectivity to provide personalized and engaging in-store interactions. They effectively bridge the gap between online research and physical shopping, improving customer retention and brand loyalty. With AI and data analytics, interactive displays enable tailored experiences that drive foot traffic and sales. Rising demand is fueled by consumers’ preference for hands-on product exploration and retailers’ focus on innovative ways to differentiate themselves in a competitive retail environment.
In Mar 2025, Interactive retail displays boosted engagement by 50% across 50 stores, with digital screens and touch-enabled displays grabbing attention 400% more effectively than static signs.

Get More Information on Interactive Display Market - Request Sample Report
Interactive Display Market Highlights:
-
The interactive display market is growing rapidly, driven by increasing mobile usage and the demand for personalized customer experiences.
-
Consumers check their smartphones over 50 times daily, spending around four hours on apps, creating opportunities for brands to engage via interactive displays.
-
Interactive displays enhance retail engagement by delivering tailored content, improving customer experiences, and fostering brand loyalty, especially during peak seasons like holidays.
-
Advancements in mobile advertising and technologies like 5G further support seamless interactions with digital displays, boosting consumer engagement and sales.
-
Limited consumer awareness remains a key restraint, with over 60% of consumers unfamiliar with the benefits of interactive displays, reducing their effectiveness.
-
Brands must invest in marketing and educational initiatives to inform consumers, drive foot traffic, and maximize the potential of interactive display solutions.
Many brands are shifting away from Google Ads, indicating a significant change in the digital advertising landscape. While search engine marketing remains vital, social media platforms are becoming oversaturated with ads, leading to consumer fatigue. Display advertising continues to be an essential part of media strategy, with projections suggesting U.S. spending will reach USD 163.29 billion in 2023. To succeed in the holiday season, brands must adapt to changing consumer behaviors, leveraging the increase in mobile usage-users check their phones over 50 times daily-to engage customers and capture attention through interactive displays, ultimately transforming the in-store experience and reshaping customer connections.

Interactive Display Market Drivers:
-
Elevating retail engagement, the interactive display market is experiencing significant growth fueled by increasing mobile usage and the demand for personalized customer experiences.
The interactive display market is experiencing substantial growth driven by the significant rise in mobile device usage. Studies show that consumers check their smartphones over 50 times daily and spend an average of four hours each day on apps. This increase in mobile engagement creates a prime opportunity for brands to connect with customers through interactive displays, particularly in retail environments. With mobile transactions projected to represent a significant share of all e-commerce revenue, incorporating interactive displays into marketing strategies is crucial for capturing consumer attention. Mobile devices not only facilitate tailored content delivery but also enhance engagement, leading to higher sales. Additionally, advancements in mobile advertising technologies encourage brands to adopt innovative solutions that leverage mobile interactions to improve customer experiences. With more than 90% of consumers favoring personalized content, the ability of interactive displays to adjust to individual preferences is vital for retaining interest and fostering brand loyalty. The integration of technologies like 5G further enhances mobile media consumption, allowing for seamless interactions with digital displays. As retailers embrace these trends, interactive displays are poised to transform shopping experiences and meet evolving consumer expectations during peak seasons, such as the holidays.
Interactive Display Market Restraints:
-
Limited consumer awareness remains a significant restraint in the interactive display market, hindering its potential for widespread adoption and effectiveness.
Despite the increasing interaction with technology, many consumers still lack a thorough understanding of the benefits and functionalities offered by interactive displays in retail and other environments. Research indicates that over 60% of consumers are unaware of how these displays can enhance their shopping experiences, leading to missed opportunities for businesses seeking to utilize these technologies for improved customer engagement. This knowledge gap can significantly reduce the effectiveness of interactive displays, as consumers may not recognize the personalized experiences or valuable information they provide. Additionally, nearly 70% of brands acknowledge the importance of raising awareness about their interactive solutions to drive foot traffic and enhance customer interactions. Without focused marketing and educational initiatives, companies may find it challenging to attract consumers to their interactive displays, resulting in underutilization of these tools. As competition in the retail sector intensifies, businesses must prioritize not only the implementation of interactive solutions but also consumer education about their advantages. This is especially critical in saturated markets where consumers face numerous choices. Addressing the issue of limited consumer awareness is vital for brands to fully leverage interactive displays, fostering a more informed customer base and optimizing marketing strategies to boost engagement and sales.
Interactive Display Market Segment Analysis:
By Display
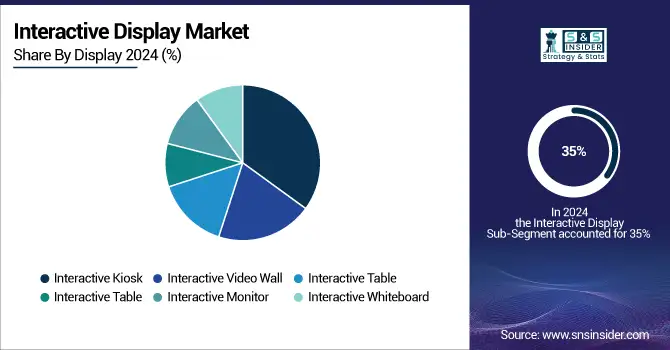
The interactive display market analysis indicates that interactive kiosks captured around 35% of the revenue share in 2024, reflecting their significant appeal across various sectors. Their versatility is a key factor, as these kiosks are widely utilized in retail, hospitality, healthcare, and transportation for applications like wayfinding, self-service checkouts, and information dissemination. This broad utility enhances their adoption. Moreover, interactive kiosks elevate customer experiences by providing immediate access to information and services, thus reducing wait times and increasing satisfaction. They also offer cost efficiency by minimizing staffing needs and providing 24/7 customer service availability, which is particularly beneficial in competitive environments. Technological advancements, such as touchscreens, artificial intelligence, and data analytics, have further transformed kiosks, enabling businesses to gather valuable insights and personalize user interactions. The COVID-19 pandemic heightened the demand for touchless solutions, solidifying kiosks' role in maintaining hygiene standards while engaging customers. Companies like Zivelo have launched innovative kiosk solutions that incorporate advanced features for enhanced user interaction. Similarly, companies such as Olea Kiosks have developed robust kiosks that cater to various industries, ensuring continued growth and solid market presence. As the focus on customer engagement and operational efficiency persists, the demand for interactive kiosks is poised to remain robust.

By Application
In the interactive display market, the Banking, Financial Services, and Insurance (BFSI) sector stands out as the largest revenue contributor, accounting for approximately 29% of the market share in 2024. This prominence is fueled by several factors that enhance the effectiveness and relevance of interactive displays in this competitive field. Firstly, these displays significantly boost customer engagement by offering instant access to financial information, services, and personalized experiences. Banks utilize them for product promotions, account management, and self-service options, simplifying customer navigation through their offerings. Furthermore, companies like Diebold Nixdorf have introduced advanced interactive banking kiosks featuring touchscreen technology and biometric authentication, enabling secure and convenient transactions for users. Interactive displays also improve operational efficiency by reducing wait times and facilitating self-service functions such as account inquiries and transaction processing, which is crucial in busy banking environments. Additionally, integrating data analytics capabilities allows financial institutions to collect valuable customer insights, enabling them to tailor services and enhance overall customer experiences. With a strong focus on security, interactive displays often feature advanced protective measures, including encryption and secure access protocols, to safeguard sensitive customer data. Consequently, the BFSI segment's substantial market share highlights its pivotal role in improving customer engagement and operational efficiency.
Interactive Display Market Regional Analysis:
North America Interactive Display Market Trends
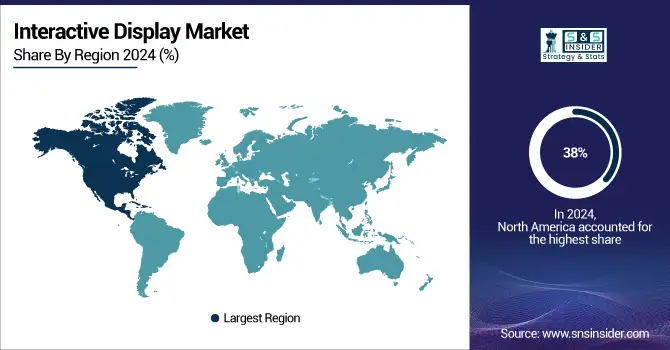
In 2024, North America emerged as the leading region in the interactive display market, accounting for approximately 38% of total revenue. This dominance is fueled by rapid digital technology adoption across various sectors, including retail, education, and healthcare, where interactive displays enhance customer engagement and streamline operations. Retailers increasingly leverage kiosks and digital signage for personalized promotions and self-service options, catering to tech-savvy consumers. Major companies like LG Electronics and Samsung drive innovation; LG launched a new line of interactive displays for educational settings, while Samsung introduced its "Flip" series for interactive business meetings. Additionally, advancements in touch technology and software integration further propel market growth, especially as organizations adapt to remote work and hybrid learning. With a strong technological infrastructure and a growing preference for personalized experiences, North America's interactive display market is set for continued expansion, reflecting substantial investments in enhancing user experience and operational efficiency.
Asia-Pacific Interactive Display Market Trends
The Asia Pacific region is the fastest-growing market for interactive displays in 2024, driven by several key factors. Rapid urbanization is creating a demand for innovative technologies across retail, education, and entertainment sectors, prompting businesses to adopt interactive displays for enhanced customer engagement. The rising middle class in countries like China, India, and Southeast Asia is increasing consumer spending on technology, making interactive displays more accessible and appealing. Additionally, substantial investments in educational technology are leading institutions to implement interactive solutions that facilitate engaging learning environments. Government initiatives promoting digital transformation and smart city projects further encourage businesses to invest in interactive displays. The presence of local tech companies also fosters innovation, with tailored products launched to meet regional needs.

Need Any Customization Research On Interactive Display Market- Inquiry Now
Europe Interactive Display Market Trends
In 2024, Europe held a significant share in the interactive display market, supported by widespread digitalization across education, corporate, and retail sectors. European businesses and educational institutions increasingly deploy interactive displays to improve collaboration, training, and customer engagement. The integration of advanced touch technologies and cloud-based software enhances the functionality and connectivity of these displays. Sustainability and energy efficiency also play a role, with companies opting for eco-friendly solutions in line with regional regulations. Government initiatives promoting digital classrooms and smart workplaces further drive adoption. The mature technological infrastructure, coupled with a strong focus on productivity and innovation, positions Europe as a stable and evolving market for interactive display solutions.
Latin America Interactive Display Market Trends
Latin America’s interactive display market is witnessing steady growth in 2024, fueled by rising digital adoption in education, retail, and corporate sectors. Educational institutions are increasingly integrating interactive displays to modernize classrooms and support remote or hybrid learning models. Retailers leverage digital signage and kiosks to enhance customer experiences, while businesses adopt collaborative displays for meetings and presentations. Government programs encouraging digitalization and smart city initiatives further support market expansion. Despite infrastructure and economic challenges in some regions, investments in technology and the growing middle-class consumer base are boosting demand. The market’s growth is strengthened by the entry of global tech providers offering region-specific solutions to meet local needs.
Middle East & Africa Interactive Display Market Trends
In 2024, the Middle East & Africa (MEA) region is emerging as a growing market for interactive displays, driven by technological modernization and investments in smart infrastructure. Educational institutions are adopting interactive solutions to improve engagement and learning outcomes, while businesses utilize interactive displays for corporate collaboration and customer-facing applications. Retailers are increasingly deploying digital signage to attract and engage consumers in high-traffic areas. Government initiatives supporting digital transformation, smart city projects, and infrastructure development further encourage adoption. The market is characterized by a mix of multinational and regional technology providers introducing products tailored to local requirements. With rising digital literacy and expanding IT infrastructure, MEA’s interactive display market shows promising growth potential.
Interactive Display Companies are:
-
Samsung Electronics: (Interactive Digital Signage, SMART Signage Solutions)
-
LG Electronics: (Interactive Whiteboards, Touch Displays)
-
Microsoft: (Surface Hub 2S, Microsoft Teams Rooms)
-
Google: (Jamboard, Interactive Displays for Google Workspace)
-
Sharp: (AQUOS BOARD Interactive Display Panels)
-
BenQ: (Interactive Flat Panel Displays, Smart Signage)
-
Elo Touch Solutions: (Touchscreen Displays, Interactive Kiosks)
-
NEC Display Solutions: (MultiSync Interactive Displays)
-
ViewSonic: (Interactive Flat Panel Displays, Touch Monitors)
-
SMART Technologies: (SMART Board Interactive Displays)
-
Promethean: (ActivPanel Interactive Displays)
-
InFocus: (Mondopad Interactive Displays)
-
Panasonic: (Interactive Whiteboards, 4K Touch Displays)
-
Crestron: (DigitalMedia Solutions with Interactive Touchscreens)
-
Cisco: (Cisco Webex Board)
-
Zebra Technologies: (Interactive Kiosks for Retail and Healthcare)
-
DynaScan Technology: (High Brightness Interactive Digital Signage)
-
TouchSystems: (Touch Screen Monitors and Interactive Displays)
-
Acer: (Interactive Flat Panels for Education and Business)
-
Raspberry Pi Foundation: (Raspberry Pi-based Interactive Displays and Kiosks)
List of potential customer companies that may be interested in interactive display solutions, categorized into two-party categories:
Potential Corporate Customers
-
Walmart
-
Amazon
-
Coca-Cola
-
Starbucks
-
McDonald's
-
Bank of America
-
Siemens
-
Microsoft
-
Apple
-
Nike
Potential Educational Institutions
-
Harvard University
-
Stanford University
-
Khan Academy
-
University of California, Berkeley
-
Massachusetts Institute of Technology (MIT)
-
Texas A&M University
-
Los Angeles Unified School District
-
New York City Department of Education
-
Duke University
-
University of Southern California (USC)
Interactive Display Market Competitive Landscape:
Samsung Electronics is a global technology leader headquartered in Suwon, South Korea, renowned for its innovation across consumer electronics, semiconductors, and IT solutions. The company develops a wide range of products, including smartphones, TVs, home appliances, memory chips, and display technologies, serving both consumer and enterprise markets. Samsung is recognized for pioneering advanced display solutions, such as interactive panels and AI-integrated systems, enhancing collaboration, education, and productivity. Committed to research and development, the company invests heavily in emerging technologies like AI, 5G, and IoT, driving digital transformation worldwide.
-
August 6, 2024 A recent development in the workplace, is the increased investment in meeting room interactive displays, such as the Samsung WAD Interactive Displays, which facilitate dynamic presentations and enhance hybrid collaboration. With 63% of U.S. companies adopting these technologies, they provide features like an infinite whiteboard and videoconferencing capabilities, significantly boosting productivity and teamwork in modern office environments.
Barter Boat, established in 2016, is an innovative interactive art experience that emphasizes the emotional and artistic value of objects. It enables participants to barter meaningful personal items with artists, fostering creativity, community engagement, and interactive participation. Traveling across multiple U.S. states, Barter Boat encourages connection, reflection, and playful exploration of art beyond monetary exchange.
-
On October 21, 2024, an interactive display called "Barter Boat" was featured at the BLINK festival in Covington, Kentucky, allowing participants to test their bartering skills with artists while exploring the emotional and artistic value of objects. This unique display, which operates like a carnival game without monetary costs, encourages attendees to bring meaningful items to trade for prizes sourced from previous stops on the Barter Boat's journey across ten states.
Samsung Electronics is a global technology leader headquartered in Suwon, South Korea, renowned for its innovation across consumer electronics, semiconductors, and IT solutions. The company develops a wide range of products, including smartphones, TVs, home appliances, memory chips, and display technologies, serving both consumer and enterprise markets. Samsung is recognized for pioneering advanced display solutions, such as interactive panels and AI-integrated systems, enhancing collaboration, education, and productivity. Committed to research and development, the company invests heavily in emerging technologies like AI, 5G, and IoT, driving digital transformation worldwide.
-
On July 1, 2024, Samsung Electronics America announced the upcoming launch of its Samsung AI Class Assistant for the WAD series of interactive displays, set to introduce generative AI tools later this year. This innovative feature will provide automatic transcriptions and summaries of lessons, generate quizzes based on classroom materials, and incorporate voice recognition technology for seamless control of display functions by teachers.
Lubbock Economic Development Alliance (LEDA) is a public-private organization focused on fostering economic growth in Lubbock, Texas. It supports business expansion, attracts new industries, and promotes job creation by providing strategic resources, incentives, and partnerships to enhance the region’s economic development and investment opportunities.
-
On October 5, 2024, the Lubbock Economic Development Alliance (LEDA) celebrated its 20-year anniversary by launching an interactive exhibit in collaboration with Visit Lubbock, showcasing significant milestones and landmarks in the city. Located in the Arts District near downtown Lubbock, the exhibit features interactive art, including QR codes that link to a map called "Chilton Trail" and a comprehensive city guide.
| Report Attributes | Details |
| Market Size in 2024 | USD 48.70 Billion |
| Market Size by 2032 | USD 90.68 Billion |
| CAGR | CAGR of 8.08% From 2025 to 2032 |
| Base Year | 2024 |
| Forecast Period | 2025-2032 |
| Historical Data | 2021-2023 |
| Report Scope & Coverage | Market Size, Segments Analysis, Competitive Landscape, Regional Analysis, DROC & SWOT Analysis, Forecast Outlook |
| Key Segments | • By Display Type (Interactive Kiosk, Interactive Video Wall, Interactive Table, Interactive Monitor, Interactive Whiteboard) • By Application (Retail, Hospitality, Healthcare, Transportation, BFSI, Corporate, Entertainment, Education, Others) |
| Regional Analysis/Coverage | North America (US, Canada), Europe (Germany, UK, France, Italy, Spain, Russia, Poland, Rest of Europe), Asia Pacific (China, India, Japan, South Korea, Australia, ASEAN Countries, Rest of Asia Pacific), Middle East & Africa (UAE, Saudi Arabia, Qatar, South Africa, Rest of Middle East & Africa), Latin America (Brazil, Argentina, Mexico, Colombia, Rest of Latin America). |
| Company Profiles | Samsung Electronics, LG Electronics, Microsoft, Google, Sharp, BenQ, Elo Touch Solutions, NEC Display Solutions, ViewSonic, SMART Technologies, Promethean, InFocus, Panasonic, Crestron, Cisco, Zebra Technologies, DynaScan Technology, TouchSystems, Acer, Raspberry Pi Foundation. |

